Since bottoming on March 2020 low, Silver Miners ETF (SIL) has continued to extend lower to correct the cycle from March 2020 low. The correction looks to be in the form of a double Below is what a double three structure looks like:
A double three is a 3-3-3 structure, labelled as WXY. The first leg wave W and the third leg Y both subdivide into 3 corrective waves. The subdivision of each leg can be either zigzag, flat or another double three but in lesser degree. We can see the double three correction in the daily chart of Silver Miners ETF (SIL).
SIL Monthly Elliott Wave Chart
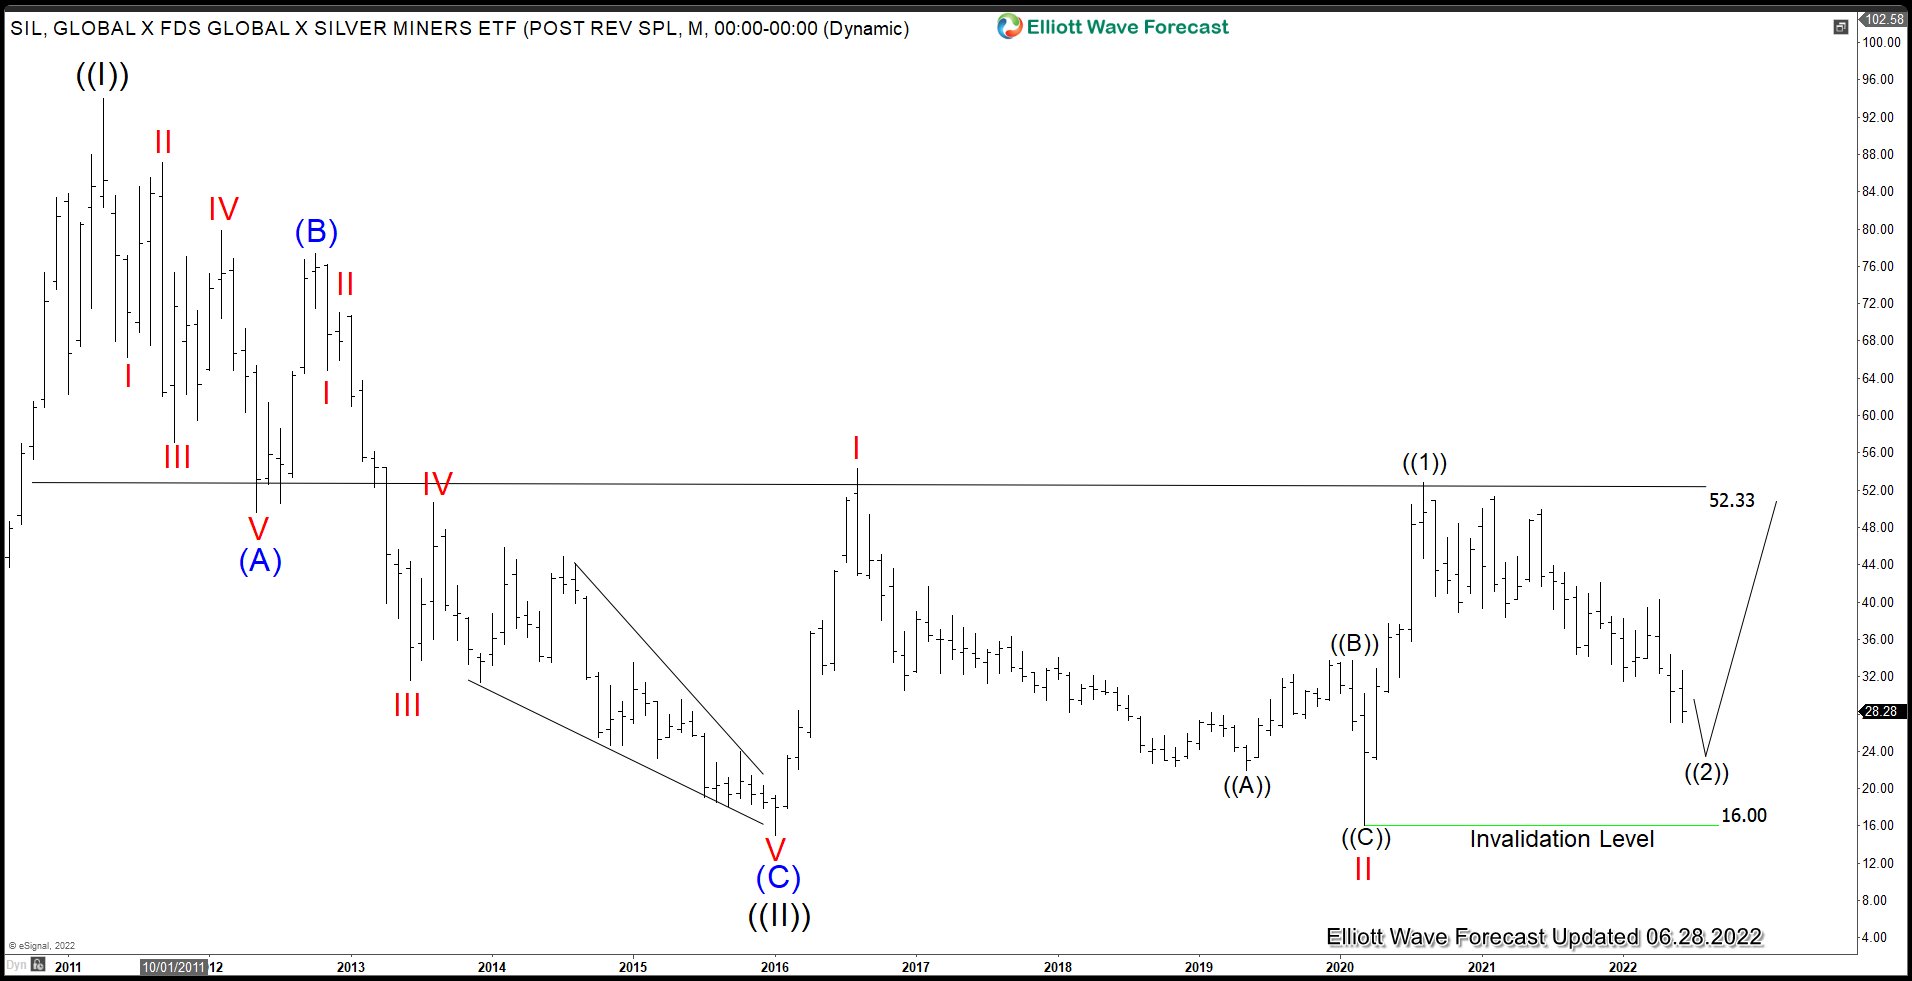
Silver Miners ETF (SIL) Monthly Elliott Wave chart above shows that the ETF is correcting cycle from 3/16/2020 low i wave ((2)) before it resumes higher. Further downside still can be seen in the near term but as far as pivot at 16 low stays intact, expect the ETF to extend higher again soon.
SIL Daily Elliott Wave Chart
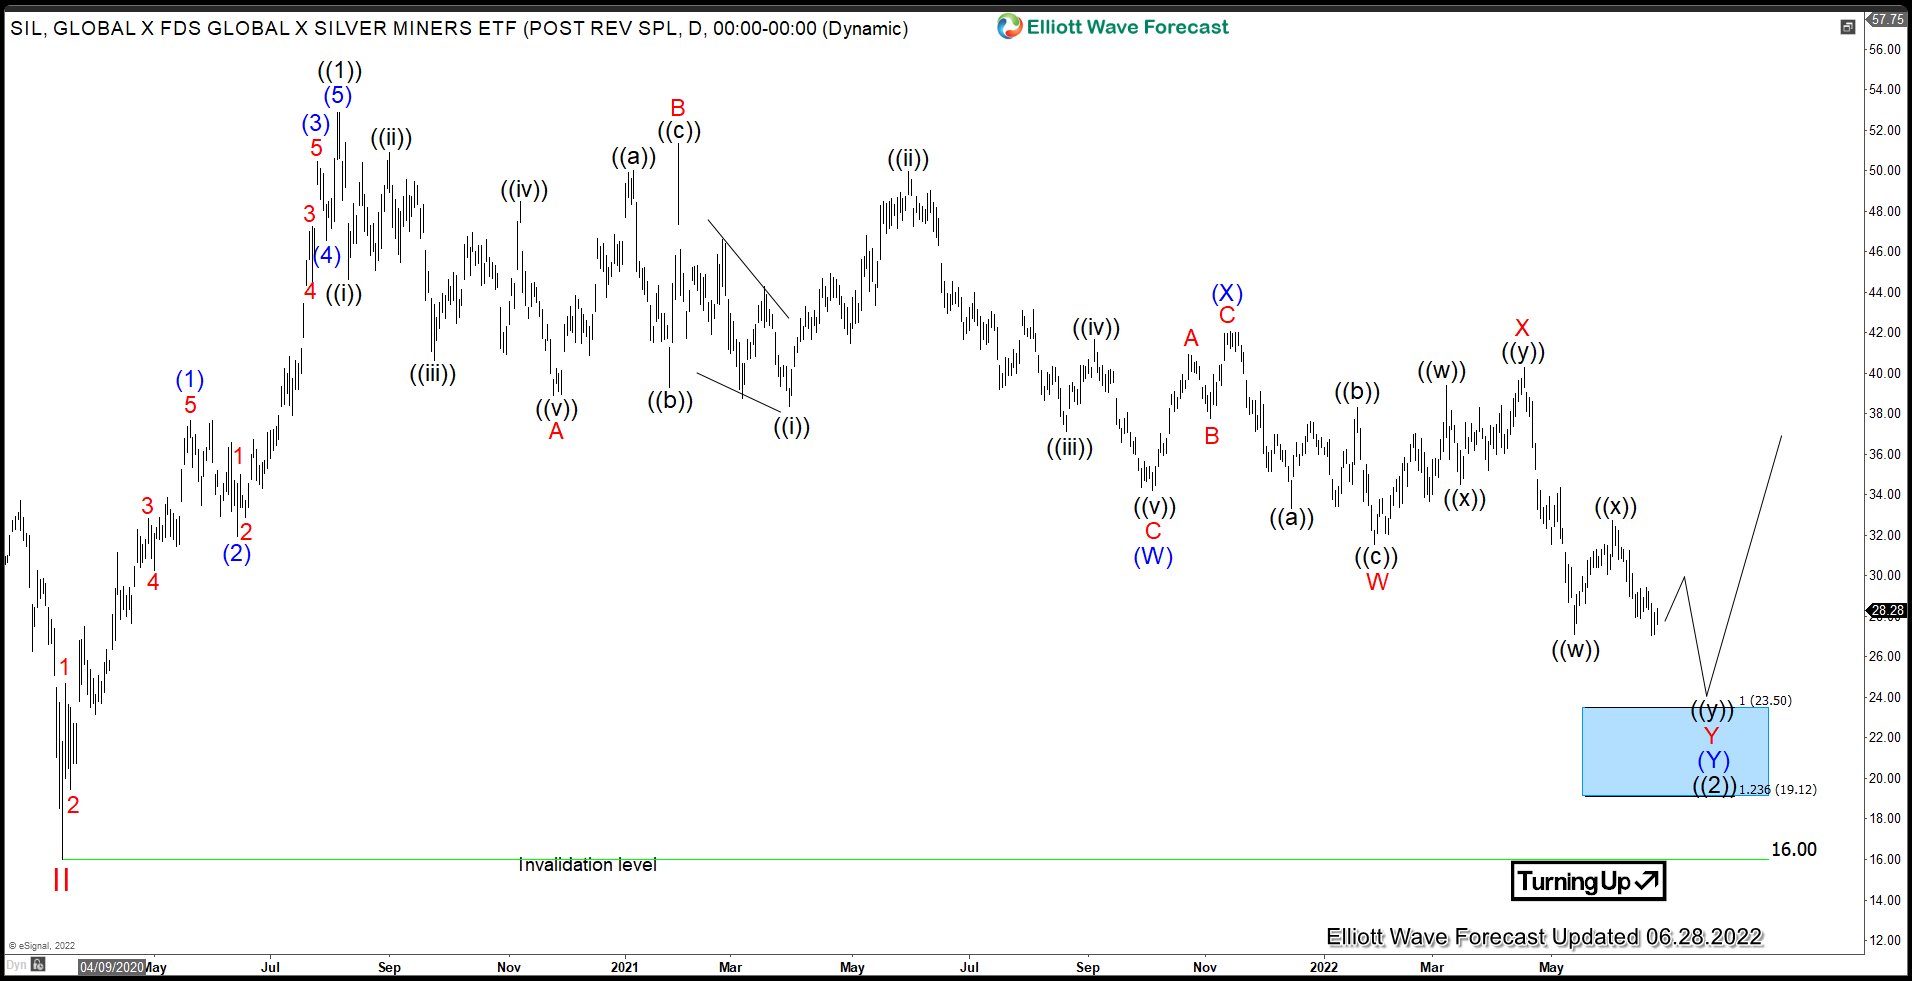
Daily Elliott Wave chart of SIL above suggests wave ((2)) is ongoing as a double three Elliott Wave structure. Down from wave ((1)) peak, wave A ended at 38.89 and rally in wave B ended at 51.35. The ETF then extends lower in wave C towards 34.21 which ended wave (W). Rally in wave (X) ended at 42.08 and the ETF extends lower again in wave (Y). Wave (Y) is unfolding as a double three where wave W ended at 31.54 and wave X rally ended at 40.29. Expect further downside in wave Y with potential target 100% – 123.6% of (W) at 19.1. $23.5. Then as far as pivot at 16 low stays intact, it should extend higher again.
If you want to get further updates in ETF, stocks, Indices, forex, and commodities, feel free to take trial here –> 14 days Trial
Back


