During the Earnings Report last Thursday, Amazon (ticker symbol: AMZN) beat Street estimates by reporting impressive revenue of $29 bn (10% higher yoy) and all-time-record of $2.8 billion quarterly net income. This compares to $256 million profit during the same period last year. The $3.7 billion in operating income also far exceeded Street estimates of $2.1 billion. However, despite the absolutely stellar result, the stock took a battering. Amazon shares tanked 10% in Friday pre-market trading to $1600 a share.
After such a negative reaction to a very positive result, the financial media quickly changed the narrative and focused on the lower-than-expected Q4 projections. The pundits say the reason for the decline is because the company gave fourth-quarter revenue guidance of $66.5 – $72.5 billion, which is below the consensus of $73.79. The Q4 operating-income guidance of $2.1 – $3.6 billion is also below the Street expectation of $3.9 billion.
Therein lies the issue of fundamental trading. Even if traders can predict the fundamental outcome, that doesn’t necessarily mean the market reaction will logically follow. In the case above, a spectacular revenue and all-time-record earnings beat result in 10% stock drop. The fundamental narrative often then shifts to justify an unexpected reaction.
On the other spectrum, technical traders argue that price action is the collective consensus of the market. Thus, the price action itself is the story, and by being able to read and interpret it, traders do not need to know the fundamental reason for every move. Just to be clear, technical trading is not 100% and will never be perfect. However, at the least, it does give traders a clear key level to trade against. Technical trading at minimum helps traders to manage position size and thus limit risk.
Below is what we saw in Amazon using Elliott Wave before the Earnings Report and what we look forward:
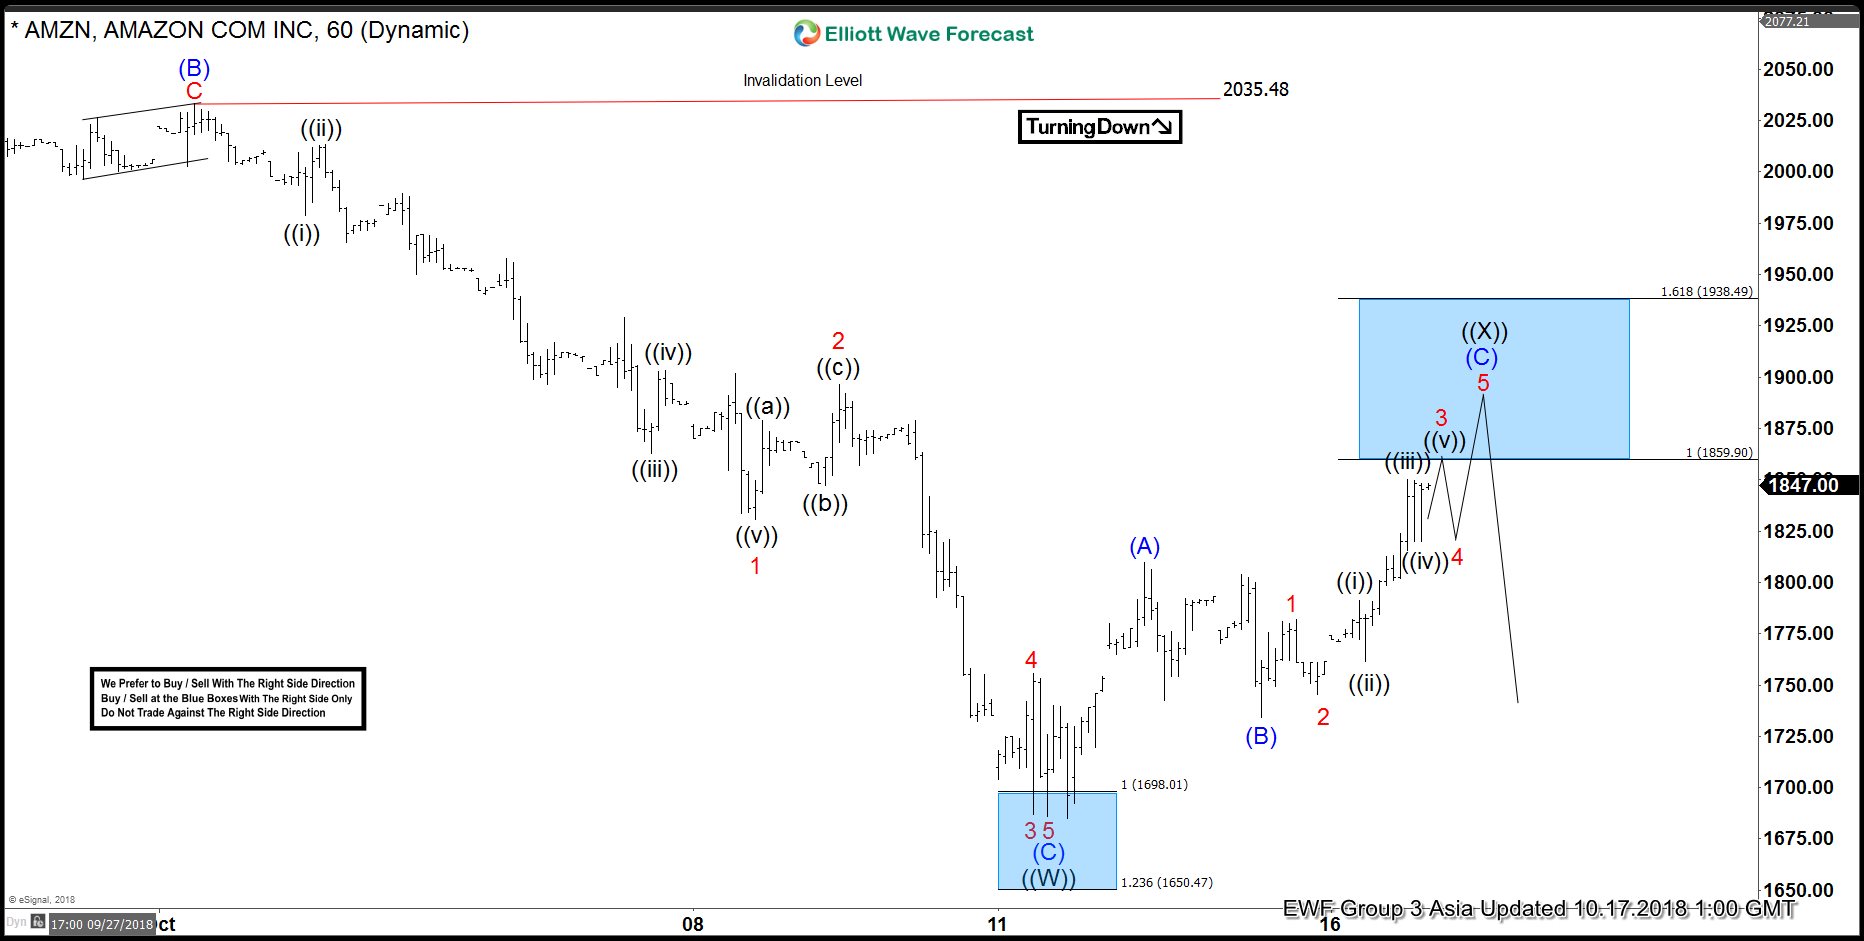
Amazon 1 hour Elliott Wave Chart Update on 17 October
We’ve been looking for more downside in the stock this month. As above chart shows, we are looking for Amazon to end a 3 waves zigzag correction at the blue box area ($1859.9 – $1938.5) before turning lower again.
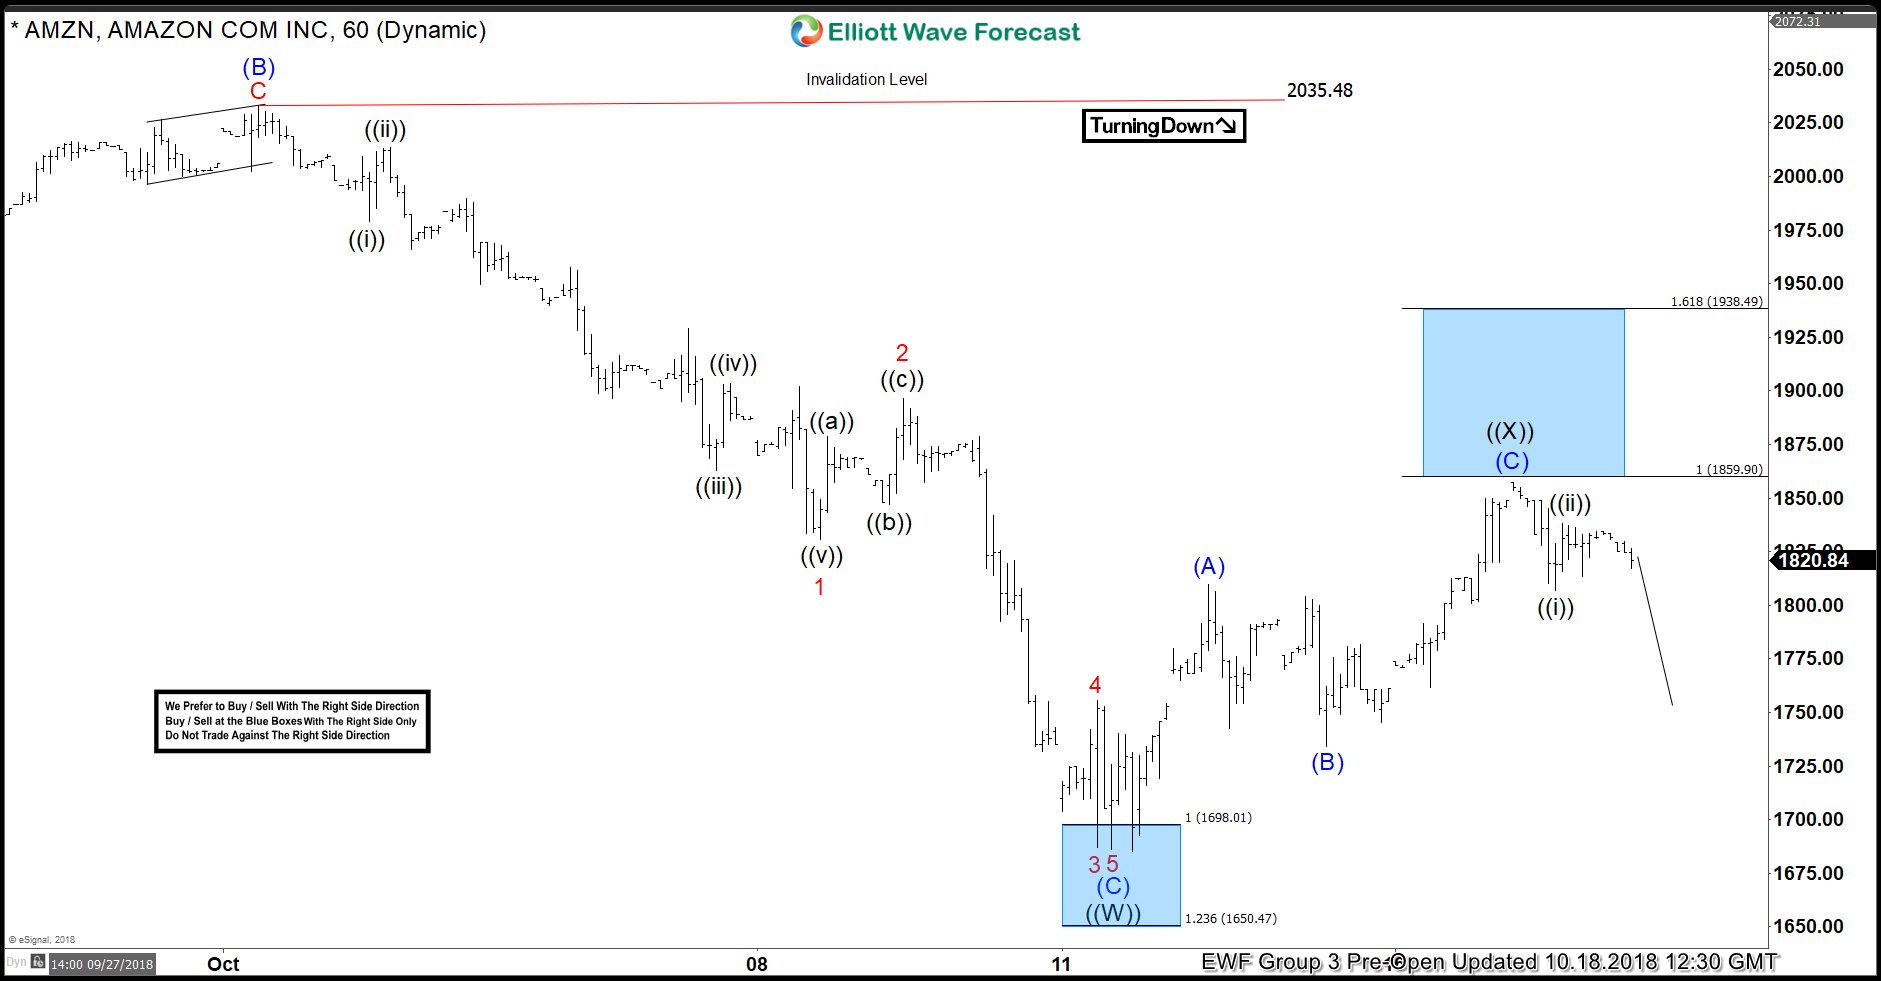
Amazon 1 hour Elliott Wave Chart Update on 18 October
The next day, Amazon started to turn lower from around the blue box area and we called the correction has ended in wave ((X)) at $1857.50. We expected Amazon to start the next leg to the downside from here.
Amazon 4 Hour Elliott Wave Chart Update on 20 October
Above chart is the 4 hour chart weekend update prior to the Earnings Report week anticipating a move lower. We got the anticipated break below wave ((W)) at $1685.99 on Wednesday prior to the Earnings Report. This break further validates the view that more downside is likely as Amazon shows a 5 swing bearish sequence from 9/4 high ($2044.4).
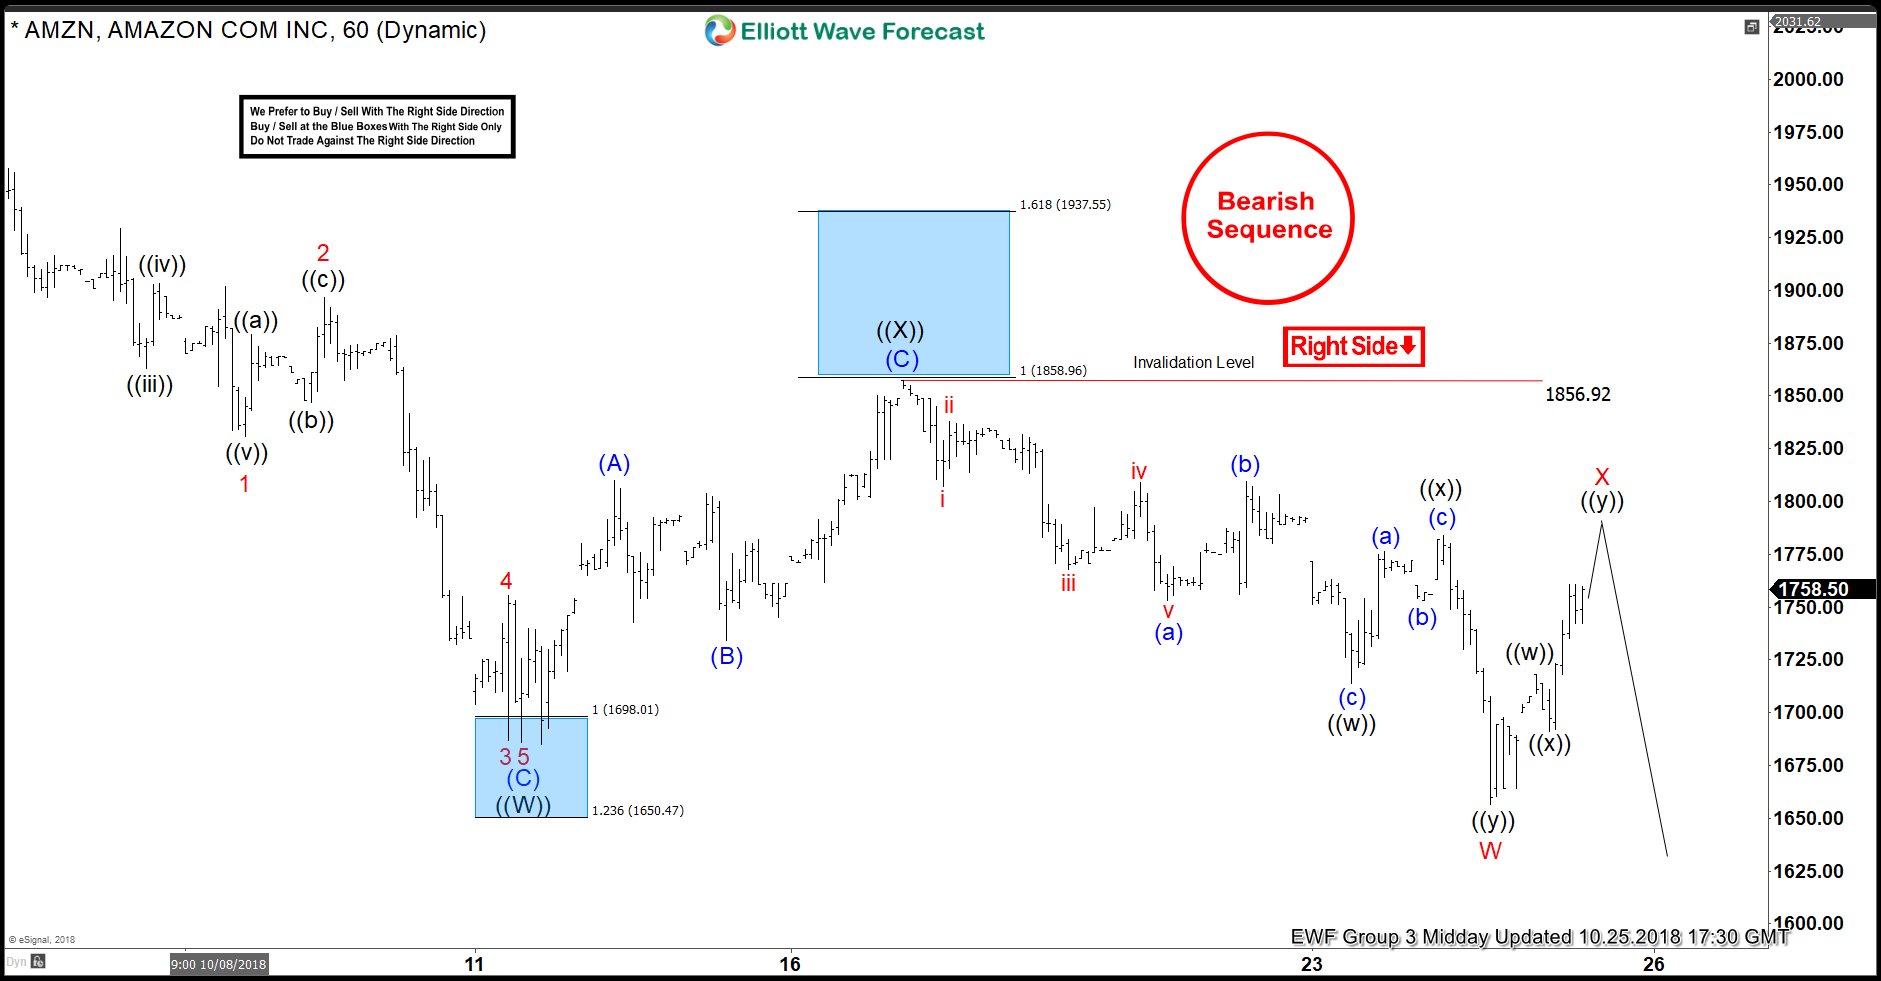
Amazon 1 Hour Elliott Wave Chart Update on 25 October
Above is the 1 hour Midday update on Thursday last week just prior to the closing bell’s Earnings Report. We were calling for rally to fail below $1856.92 in 3-7-11 swing and we highlight the bearish nature of the stock with a lower right side and bearish sequence stamp.
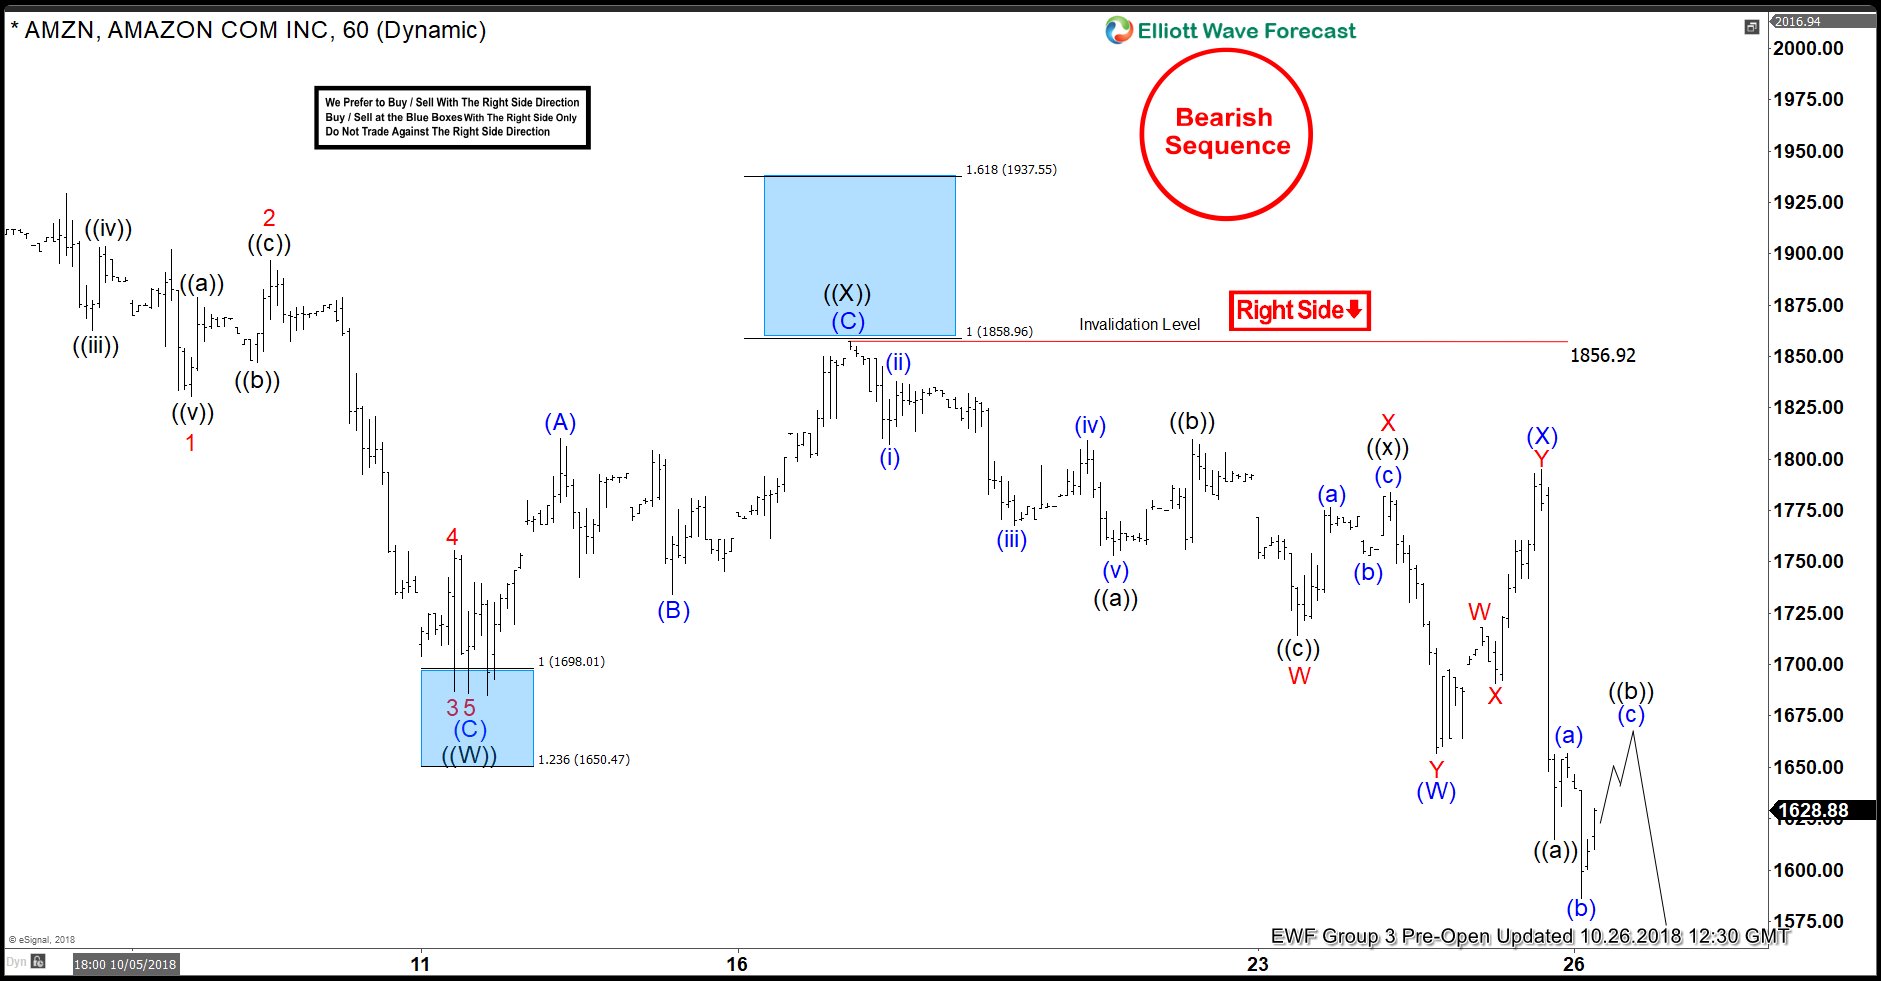
Amazon 1 Hour Elliott Wave Chart Update on 26 October
We know what happened after the Earnings Report, Amazon stock fell precipitously. We still look for an extension to the downside towards $1390 – $1477 area in Amazon as far as bounces fail below $1856.9 as the sequence from 9/4/2018 high (2050.6) is incomplete.
To get the next update in Amazon and other stocks / ETF / forex, welcome to take FREE trial here —> 14 days FREE Trial We provide Elliott Wave forecast in 4 different time frames for 78 instrument, live session, daily technical video, trading setup, 24 hour chat room, and more! We are also currently running 30% promotion for Gold and Platinum Plan. You can get your discount here –> 30% OFF Gold and Platinum Plan
Back


