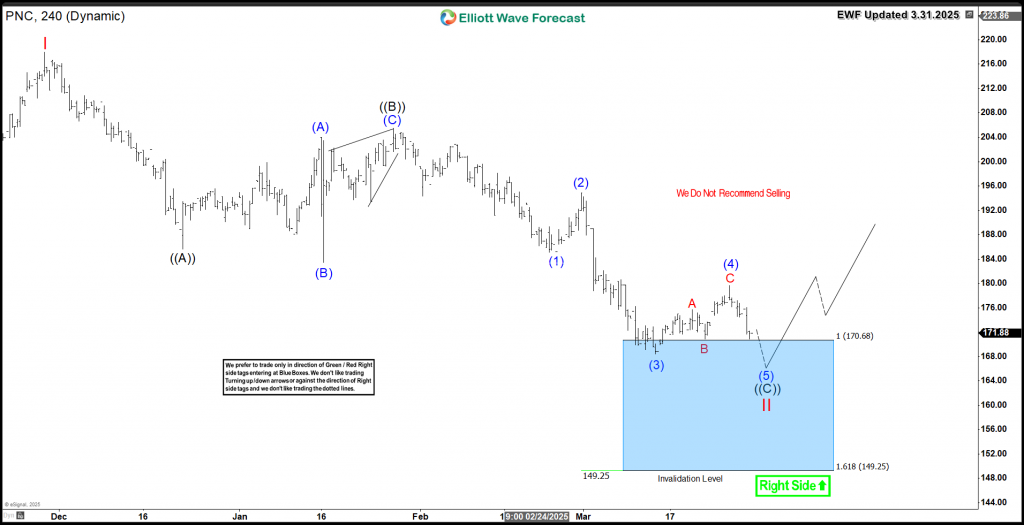
PNC Financial Services (NYSE: PNC) is down more than 20% in the recent 4 months. Investors are looking for clues into the current decline to prepare a plan for the next move. We’ll use the Elliott Wave Theory to define the technical structure and understand the potential path.
Since December 2024 peak, PNC is showing a clear 3 swings decline and we can define it as an Elliott Wave Zigzag structure. Wave ((A)) ended in 12.20.2024 at $185, wave ((B)) ended in 1/29/2025 at $205 and the wave ((C)) remains in progress. In other words, the current move to the downside is corrective and it’s still expected to end wave (5) of ((C)) at the equal legs with the Blue Box area $170.68 – $149.25.
PNC 4 Hour Elliott Wave Chart
The blue boxe in the above charts is a High-frequency area where the market is likely to end the current cycle and make a turn. Consequently, we expect PNC to react to the upside as buyers will be looking for the trend to resume or will be looking for a 3 waves bounce at least.
In conclusion, PNC is showing a corrective decline and we only recommend buying the pullback in 3 , 7 or 11 swings as we expect a reaction higher to take place in the second quarter of this year.
Explore a variety of Stocks & ETFs investing ideas by trying out our services 14 days and learning how to trade our blue boxes using the 3, 7 or 11 swings sequence. You will get access to our 78 instruments updated in 4 different time frames, Live Trading & Analysis Session done by our Expert Analysts every day, 24-hour chat room support and much more.
Back


