With a market capitalization of over $200 billion, PepsiCo (NASDAQ: PEP) is a global leader in the food and beverage industry. It has recently broken into new all-time highs, indicating a potentially bullish outlook for the stock. Despite ongoing market volatility and changing consumer preferences, the company’s strong revenue and profits suggest a solid business model with promising growth potential. With the stock’s recent surge, investors may want to consider the mid-term movement of the stock to take advantage of potential buying opportunities.
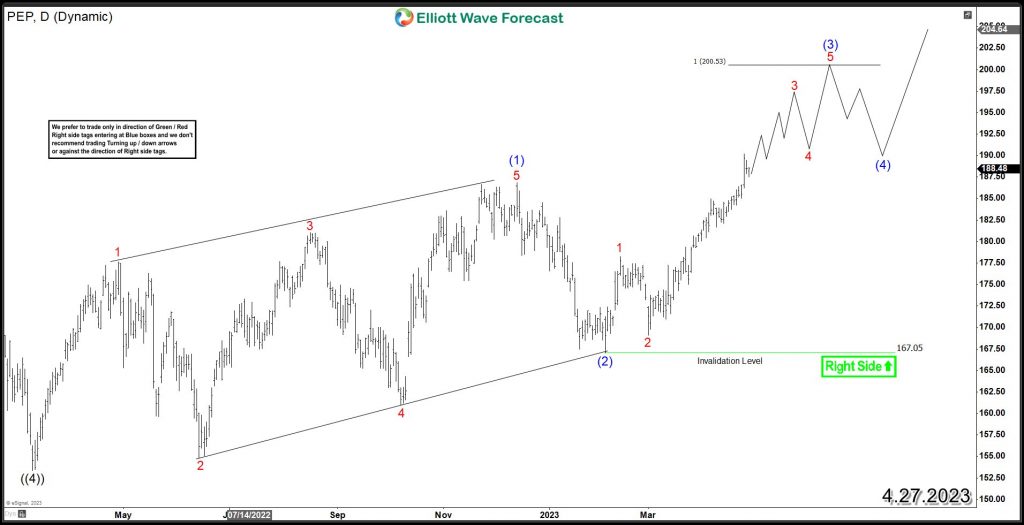
The recent surge in PEP’s price, surpassing the peak of December 2022, successfully erased the RSI divergence in the daily charts. This event is crucial, as it indicates that the cycle from March 2020 will continue and confirms that the wave (3) cycle from March 2022 is still in progress.
The rally from March 2022 low unfolded as a leading diagonal in wave (1) at $186.84, followed by a pullback in wave (2) ended at $167.05. Ideally, the move higher in wave (3) should target the 100% Fibonacci extension area at $200.53, followed by a potential 3-wave pullback before resuming the rally. Additionally, the 123.6% – 161.8% Fibonacci extension levels, located at $208 – $221, may come into play at a later stage of the cycle.
In conclusion, PEP’s Elliott Wave patterns suggest that the stock is in a bullish sequence from March 2022 low, with the wave (3) in progress. Any pullbacks in 3, 7, or 11 swings should be seen as potential buying opportunities, as long as the stock remains supported above the wave (2) low of $167.05.
PEP Elliott Wave Daily Chart
Back


