Paypal ( NASDAQ: PYPL) is a payment processor platform that enables digital and mobile payments on behalf of consumers and merchants worldwide providing an electronic alternative to traditional paper methods like checks and money. The company initial public offering was in 2002 then became a wholly owned subsidiary of eBay later that year before it spun off in 2015.
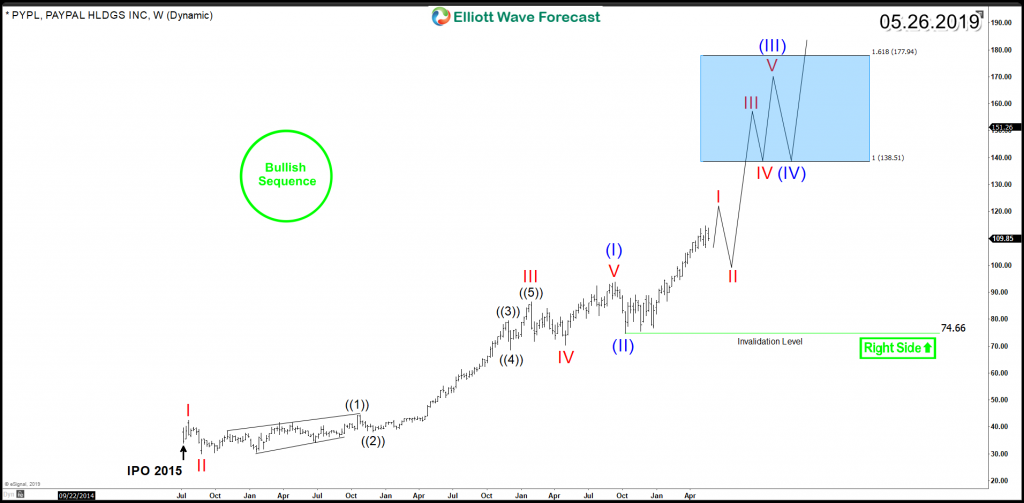
The initial rally from 2015 until 2018 peak $93.6, presented an Elliott Wave 5 waves impulsive structure which was followed by 3 waves pullback that ended at October 2018 low $74. Up from there, the stock resumed the move to the upside breaking to new all time highs and opening a new cycle higher aiming for a minimum target at 100% Fibonacci extension area $138.5 with a potential extension toward $177 if the whole structure from 2015 continue as an impulse.
Paypal PYPL Weekly Chart
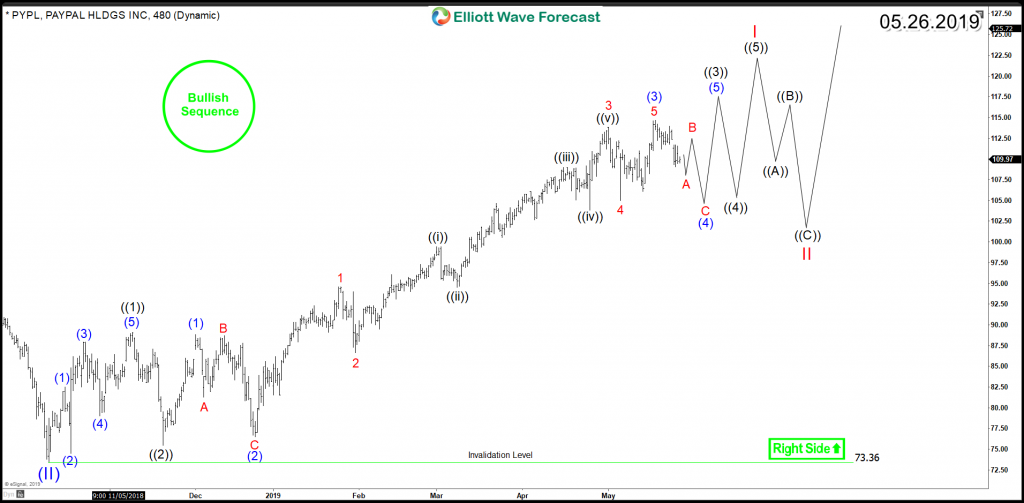
The break to the upside created a bullish sequence for the stock allowing pullbacks to remain supported in 3 , 7 or 11 swings against October 2018 low $74. Currently the stock is correcting lower in wave (4) the cycle from December 2018 low and can see a pullback toward $105 – $100 area before resuming higher or a bounce takes place.
Paypal PYPL 8H Chart
In conclusion, Paypal structure is unfolding as an impulsive structure in both leg from 2015 and 2018 low suggesting a supported move higher is still expected to be seen, therefore investor will be looking to continue buying the stock in any corrective pullbacks against 2018 low.
Explore a variety of investing ideas by trying out our services 14 days and learning how to trade our blue boxes using the 3, 7 or 11 swings sequence. You will get access to our 78 instruments updated in 4 different time frames, Live Trading & Analysis Session done by our Expert Analysts every day, 24-hour chat room support and much more.
Back


