Silver (XAGUSD) has ended correction to the cycle from 2020 low and turning higher. This would suggest that silver miners most likely have formed the bottom as well. Below is the chart of Pan American Silver (ticker: PAAS), one of the leading precious metal miners. The company is engaged in the production and sale of silver, gold, zinc, lead and copper.
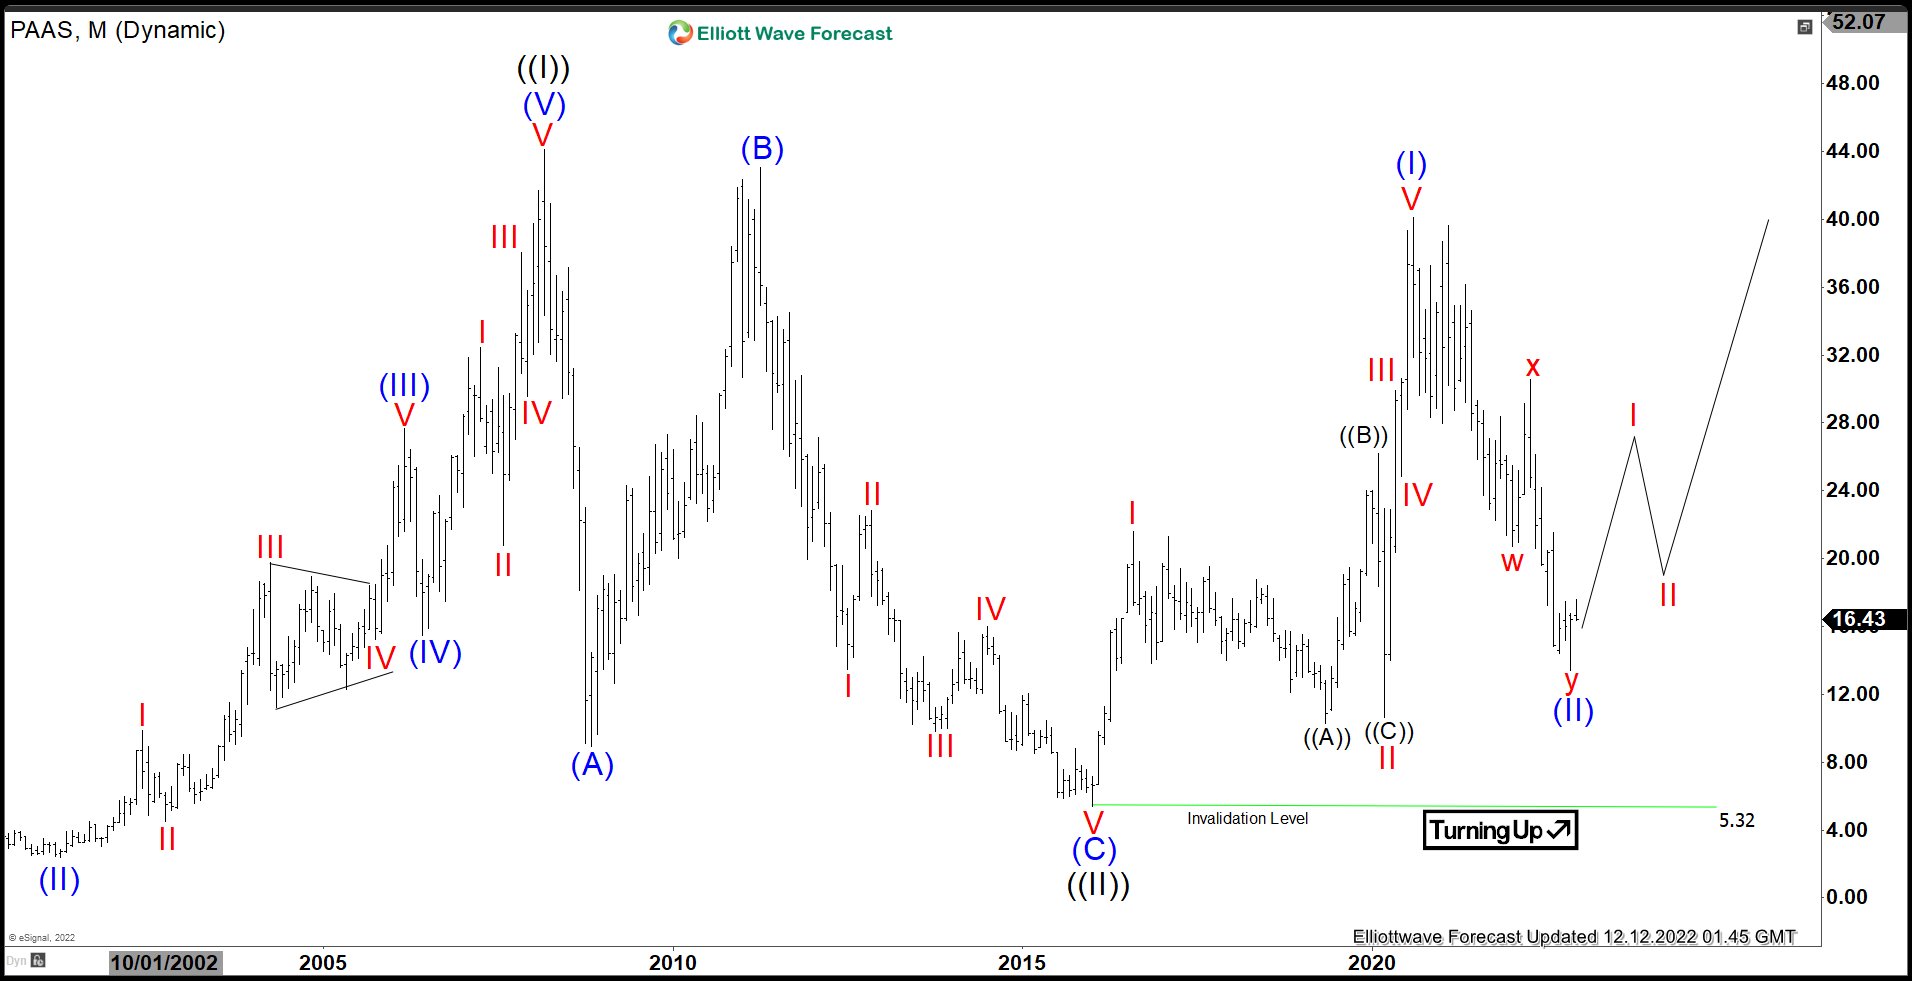
PAAS Monthly Elliott Wave Chart
PAAS rally to 44.1 on March 2008 ended wave ((I)). Wave ((II)) pullback ended at 5.32 with internal subdivision as a zigzag Elliott Wave structure. Down from wave ((I)), wave (A) ended at 8.93, rally in wave (B) ended at 43.06, and wave (C) lower ended at 5.32. This completed wave ((II) in higher degree. Up from there, wave (I) ended at 40.11 and wave (II)) is proposed complete at 13.40. As far as pivot at 5.32 low stays intact, expect the stock to continue higher.
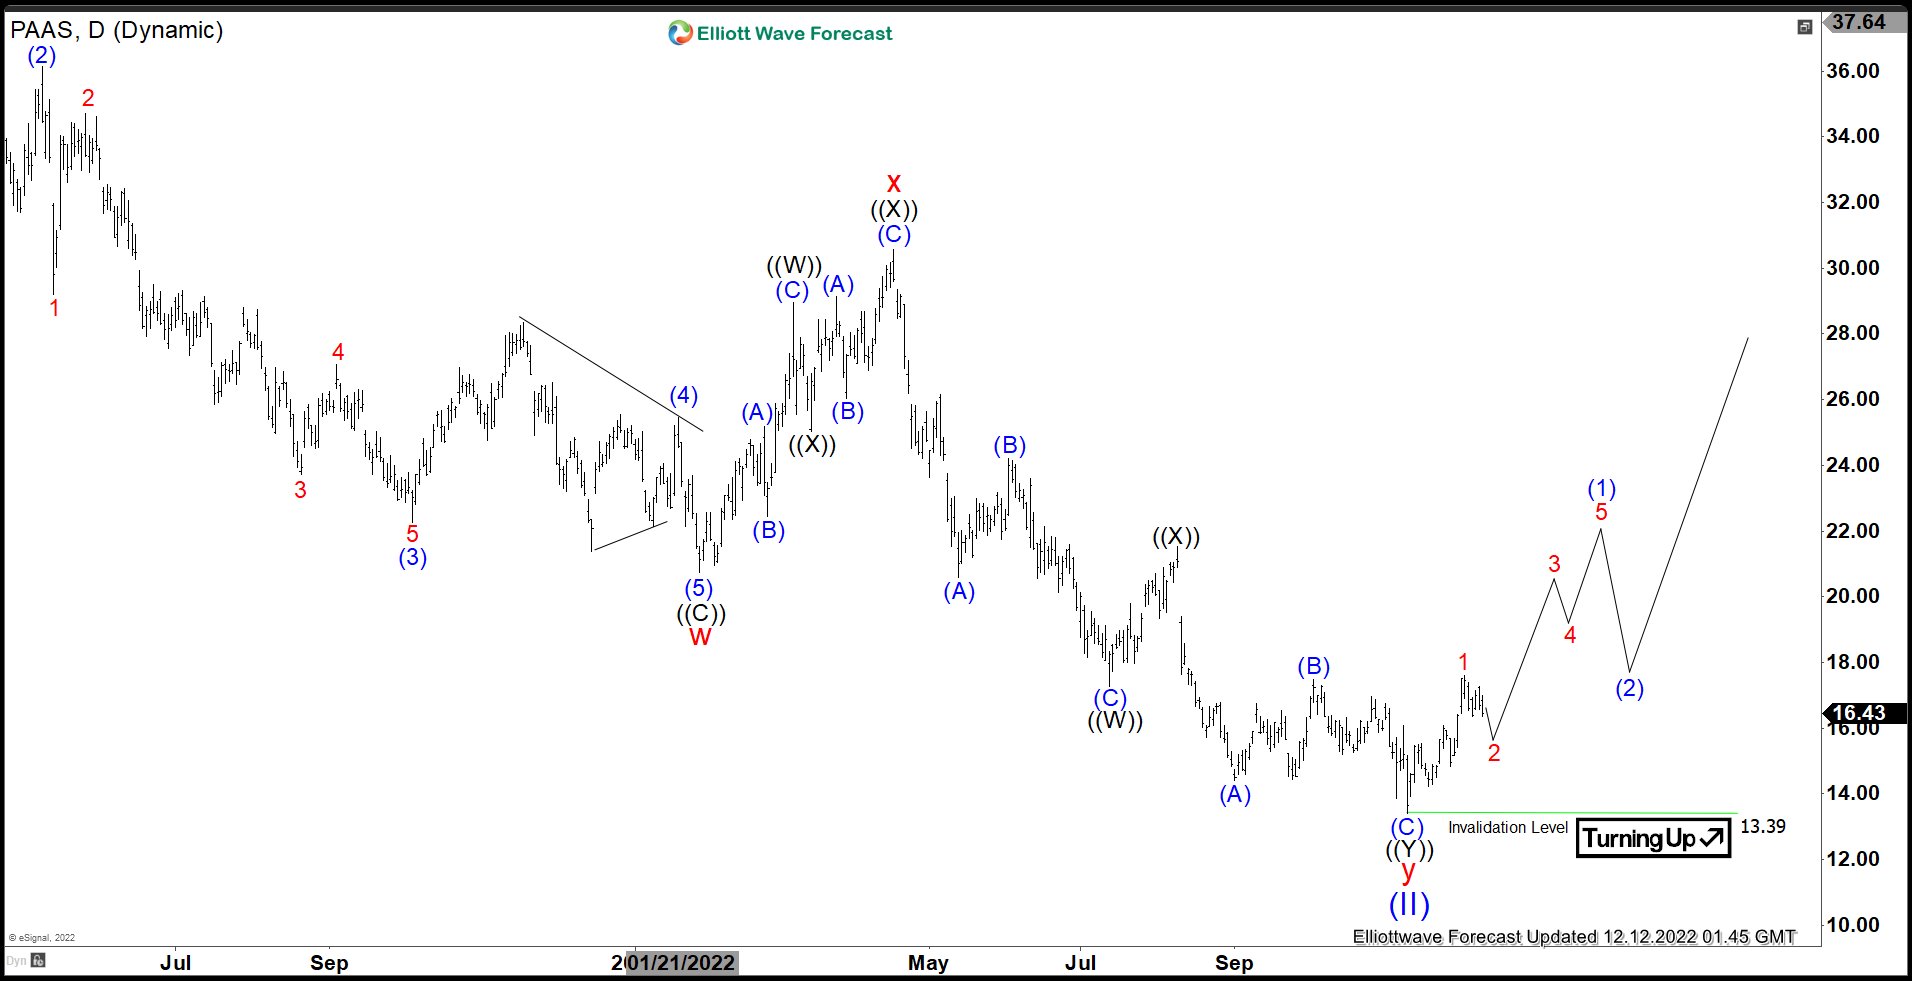
PAAS Daily Elliott Wave Chart
Daily Elliott Wave chart above shows wave (II) ended at 13.39 with internal subdivision as a double three. Down from wave (I) at 40.11, wave w ended at 20.73, and rally in wave x ended at 30.56. Final leg lower wave y ended at 13.39. This completed wave (II) in higher degree. Wave (III) higher is now in progress but it still needs to break above wave (I) at 40.11 to rule out a double correction. Near term, as far as pivot at 13.39 low stays intact, expect dips to find support in 3, 7, 11 swing for further upside.
To get regular technical updates on 72 instrument from stocks, Indices, forex, and commodities, feel free to try our service free –> 14 days FREE Trial.
Back


