

The Power of 3-7-11 and the Grand Super Cycle: How We Saw the Bullish Turn in April 2025 Back on April 9, 2025, while World Indices were dropping sharply and global sentiment had turned overwhelmingly bearish, we published an article that challenged the fear-driven narrative. We explained why selling was not the right approach and […]
-
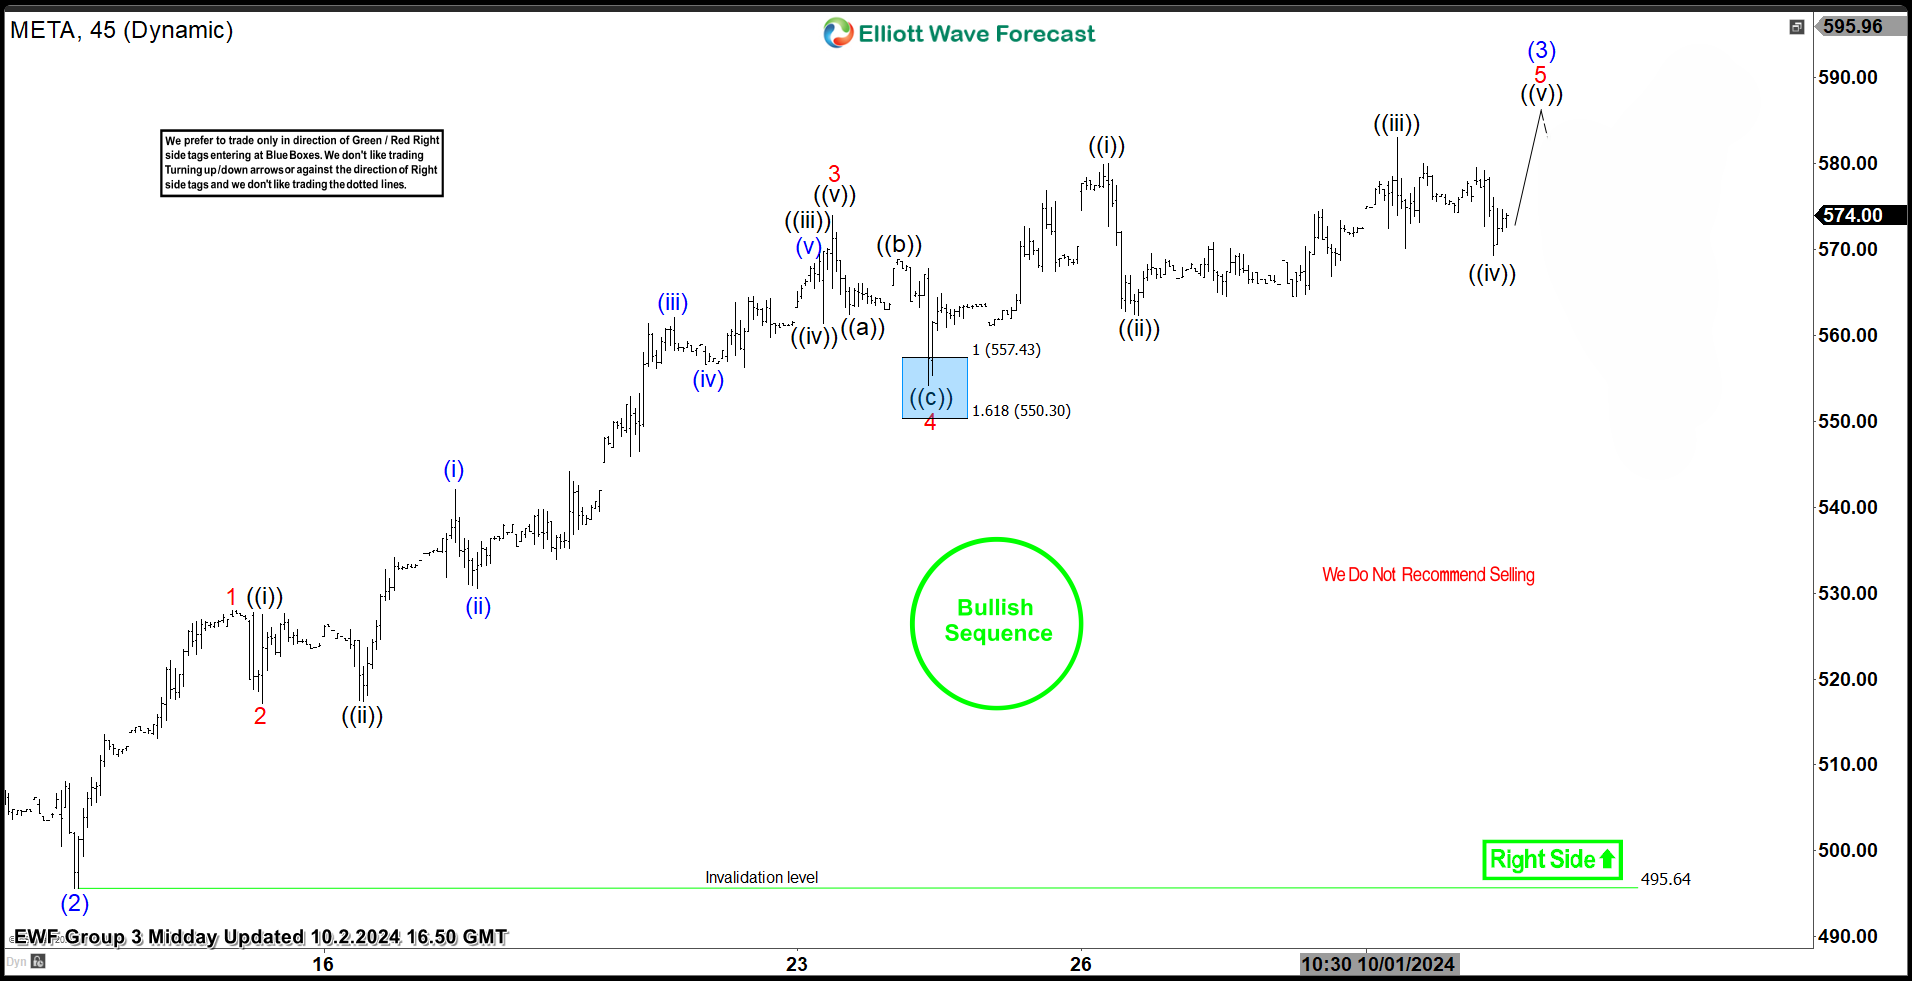
Elliott Wave Analysis: META hits new high from blue box
Read MoreHello traders, welcome to another ‘Blue Box’ blog post, where we review past trades taken by Elliottwave-Forecast members for educational purposes. In this post, we’ll discuss a recent trade setup on META. Meta Platforms, formerly Facebook, is a tech company focused on building the “metaverse.” It owns Facebook, Instagram, and WhatsApp, and develops virtual reality […]
-
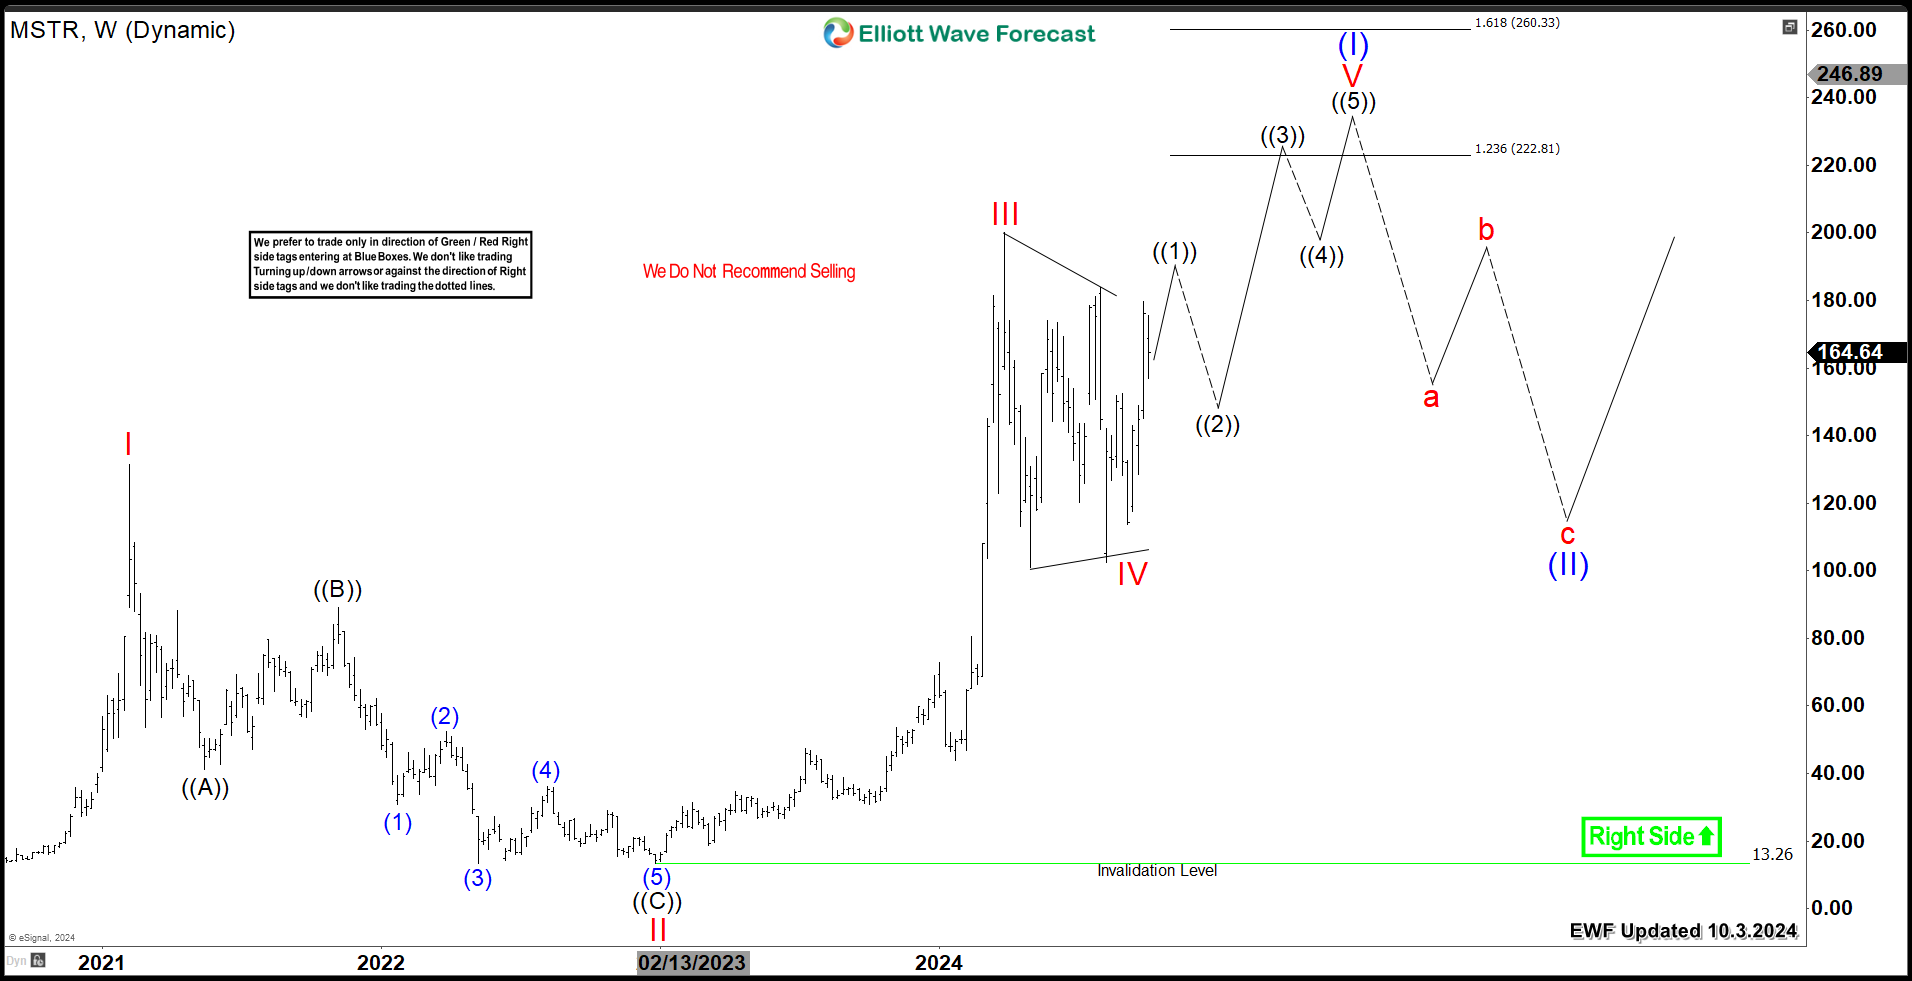
MicroStrategy (NASDAQ: MSTR) Weekly Upside Target
Read MoreMicroStrategy (NASDAQ: MSTR) is one of the top performing stocks in recent two years. In our previous article, we explained the impulsive structure taking place since 2022 low. In this article, we’ll take a look at the potential targets to the upside based on the Elliott Wave Theory. MSTR started is major bullish cycle in 2002. Since then, the stock […]
-
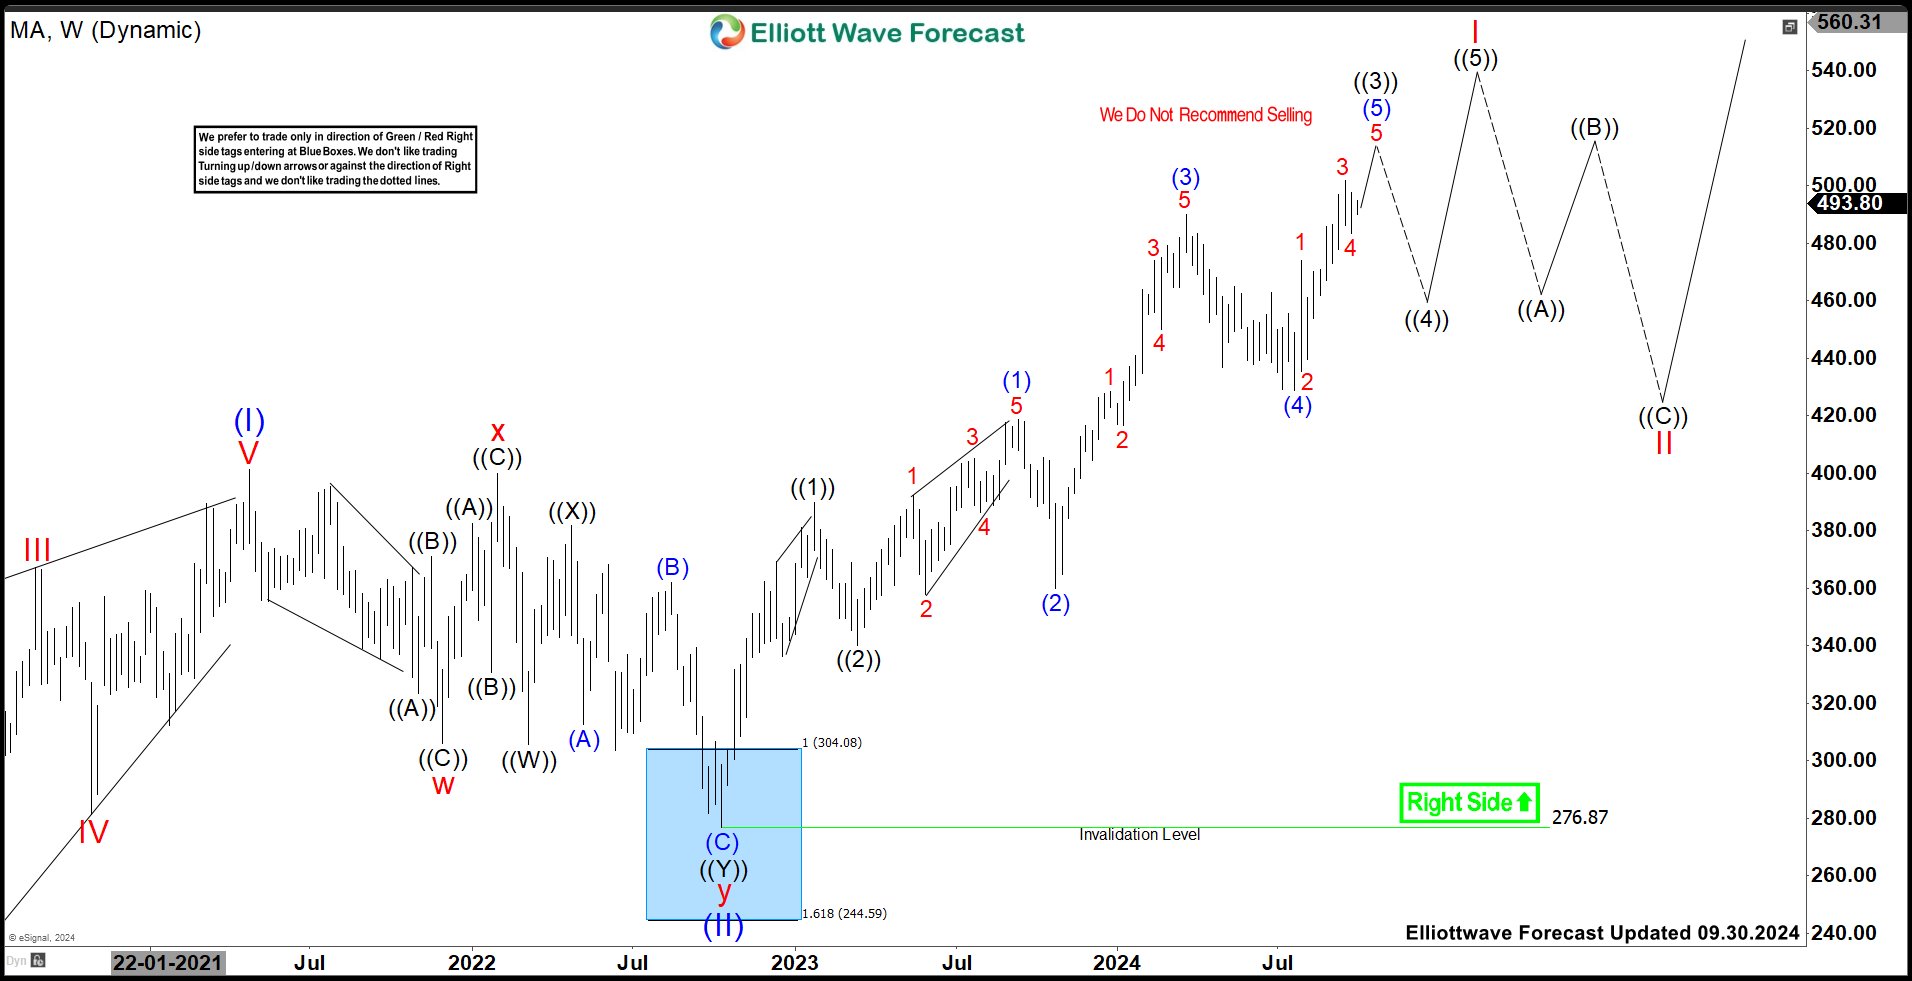
Mastercard (MA) Should Pullback Soon To Provide Next Opportunity
Read MoreMastercard Incorporated (MA), provides transaction processing & other payment-related products & services in the United states & internationally. The company offers payment related products to integrated products & value-added services for account holders, merchants, financial institutions, digital partners, businesses, governments & other organizations. It is headquartered in New York, comes under Financial Services sector & […]
-
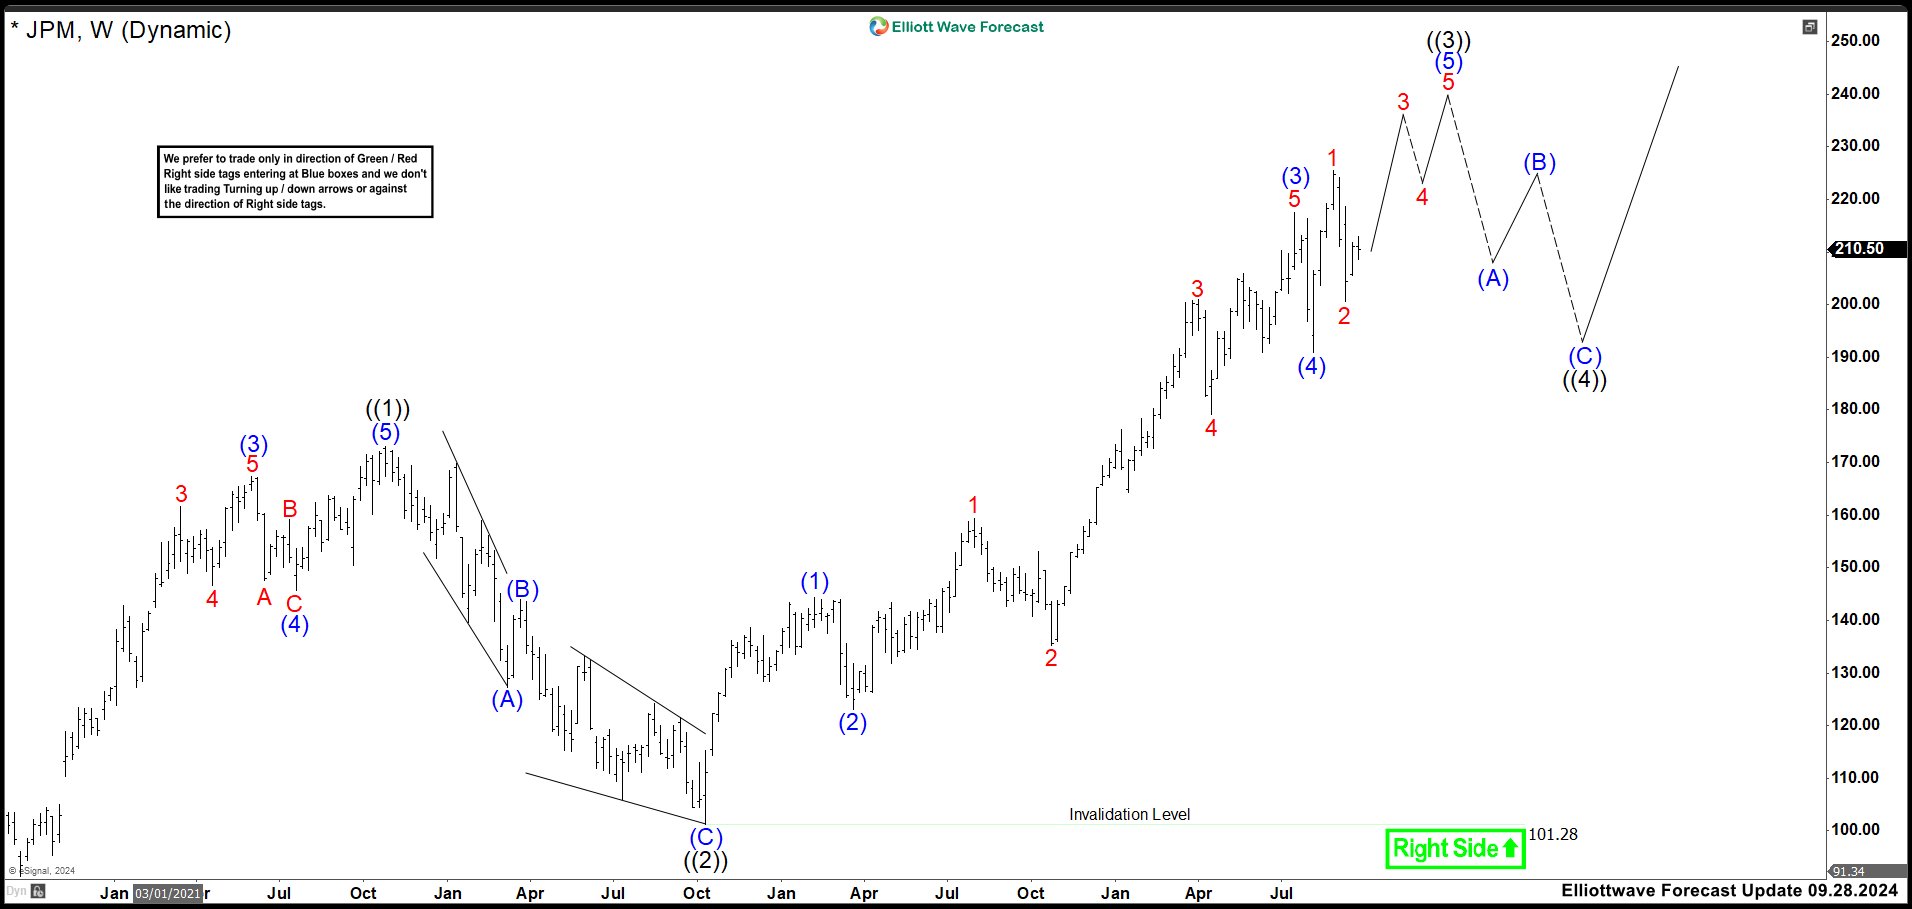
JPMorgan (JPM) Is Not Showing Weakness Near Term
Read MoreJPMorgan Chase & Co. (JPM) is an American multinational investment bank and financial services holding company headquartered in New York City and incorporated in Delaware. As of December 31, 2021, JPMorgan Chase is the largest bank in the United States, the world’s largest bank by market capitalization, and the fifth-largest bank in the world in […]
-
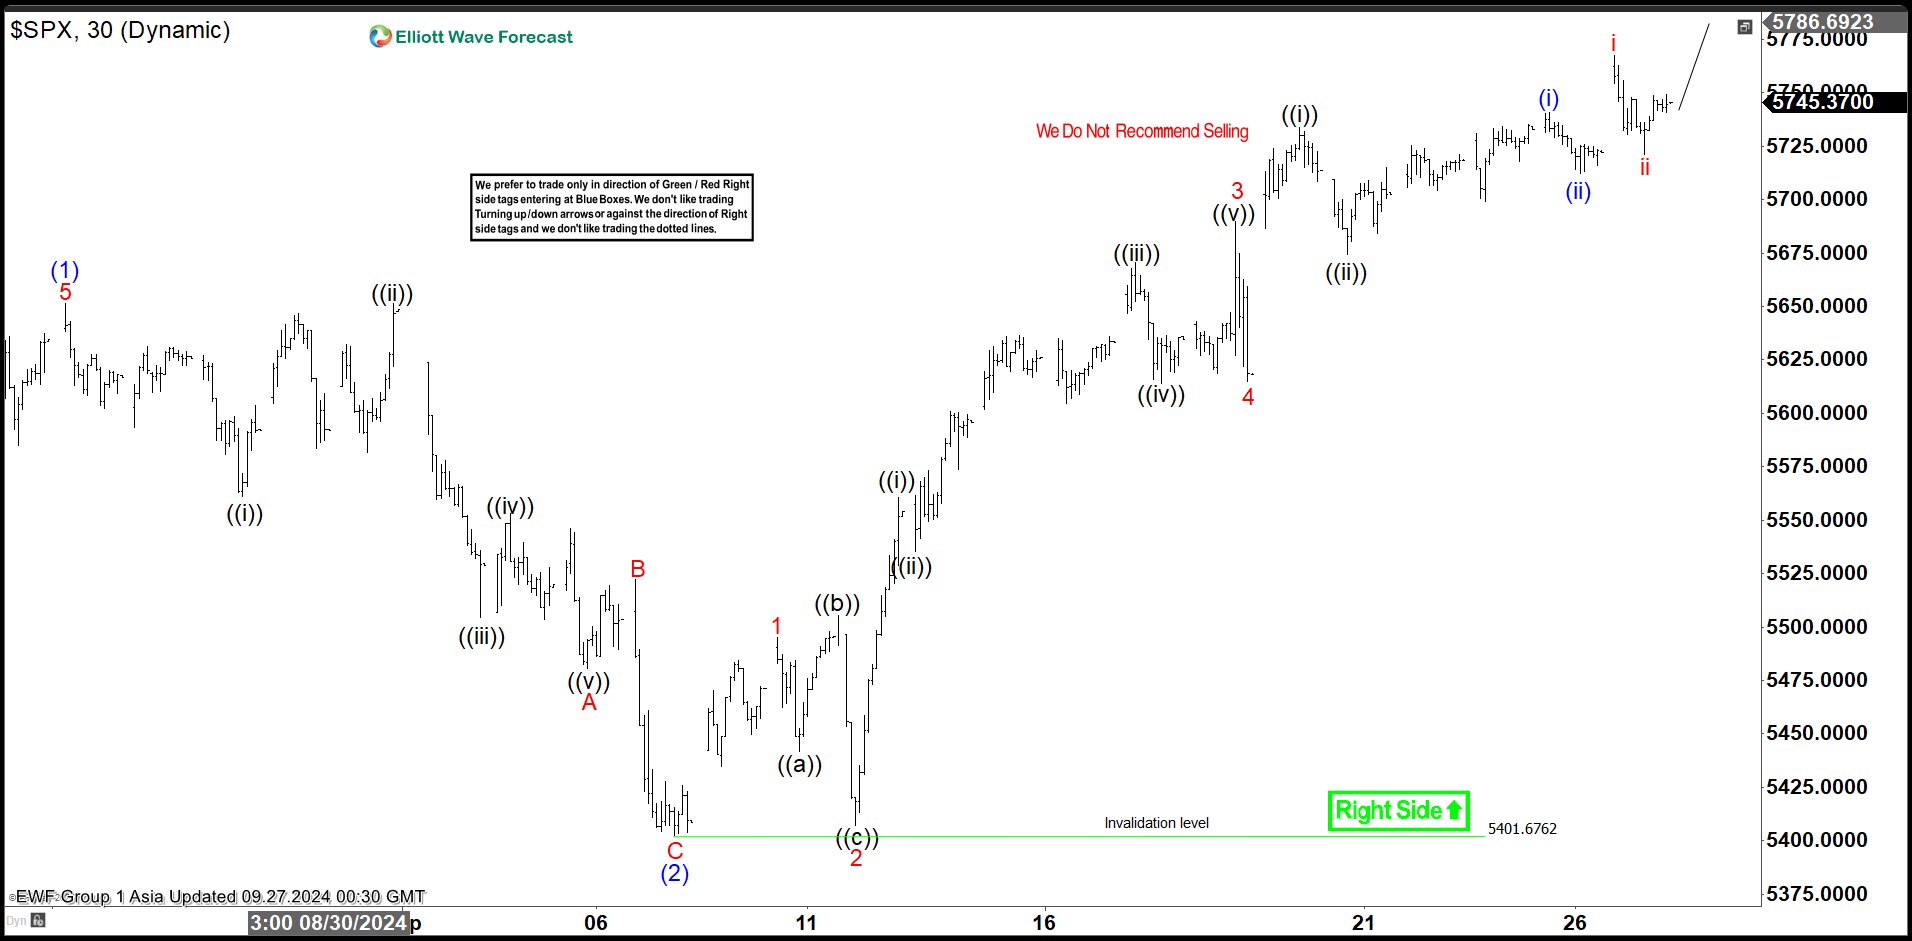
S&P 500 ($SPX) Elliott Wave Sequence Remains Bullish
Read MoreS&P 500 ($SPX) shows a bullish sequence from Aug 5, 2024 low favoring more upside. This article and video look at the Elliott Wave path.
-
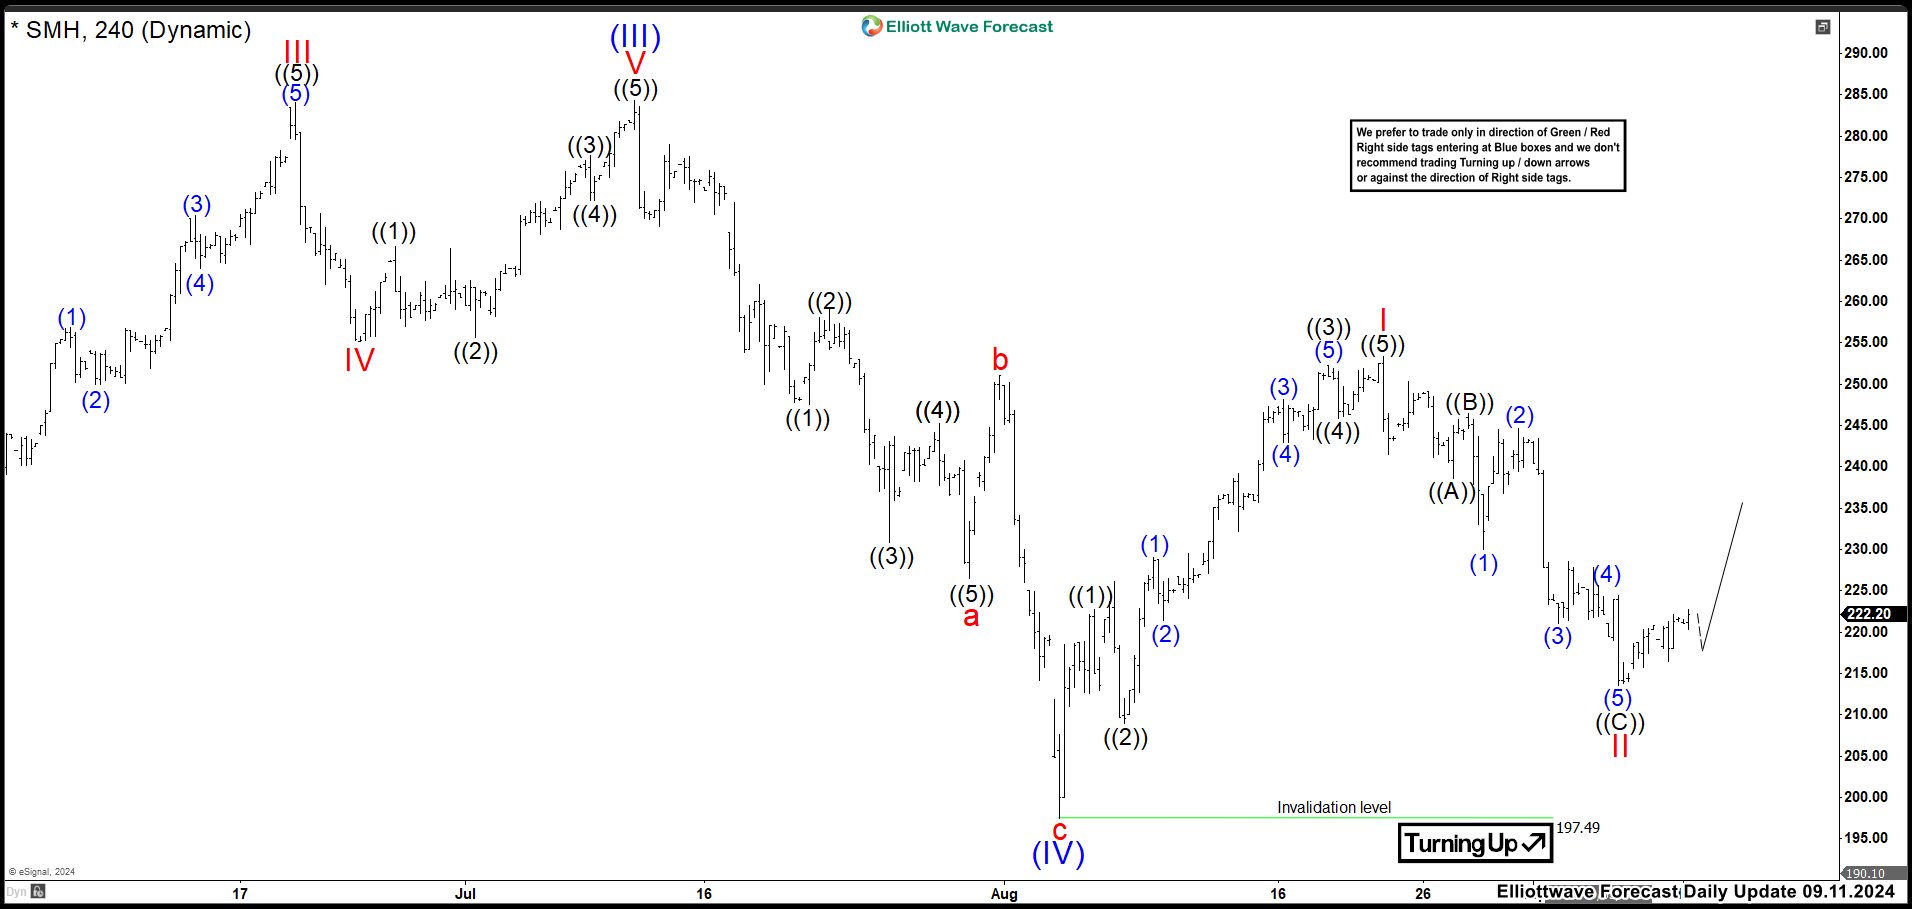
SMH Semiconductor ETF Should Continue Pushing to the Upside
Read MoreThe VanEck Semiconductor ETF (SMH) is an exchange-traded fund that tracks a market-cap weighted index composed of 25 of the largest U.S.-listed semiconductor companies. The top holdings of SMH include companies like NVIDIA, Taiwan Semiconductor Manufacturing, Broadcom Inc., Texas Instruments, QUALCOMM, ASML Holding N.V., Applied Materials, Inc., Lam Research Corporation, Micron Technology, Inc., and Advanced Micro Devices, Inc. SMH 4 Hour Chart May 23th In May, we showed how […]