

The Power of 3-7-11 and the Grand Super Cycle: How We Saw the Bullish Turn in April 2025 Back on April 9, 2025, while World Indices were dropping sharply and global sentiment had turned overwhelmingly bearish, we published an article that challenged the fear-driven narrative. We explained why selling was not the right approach and […]
-
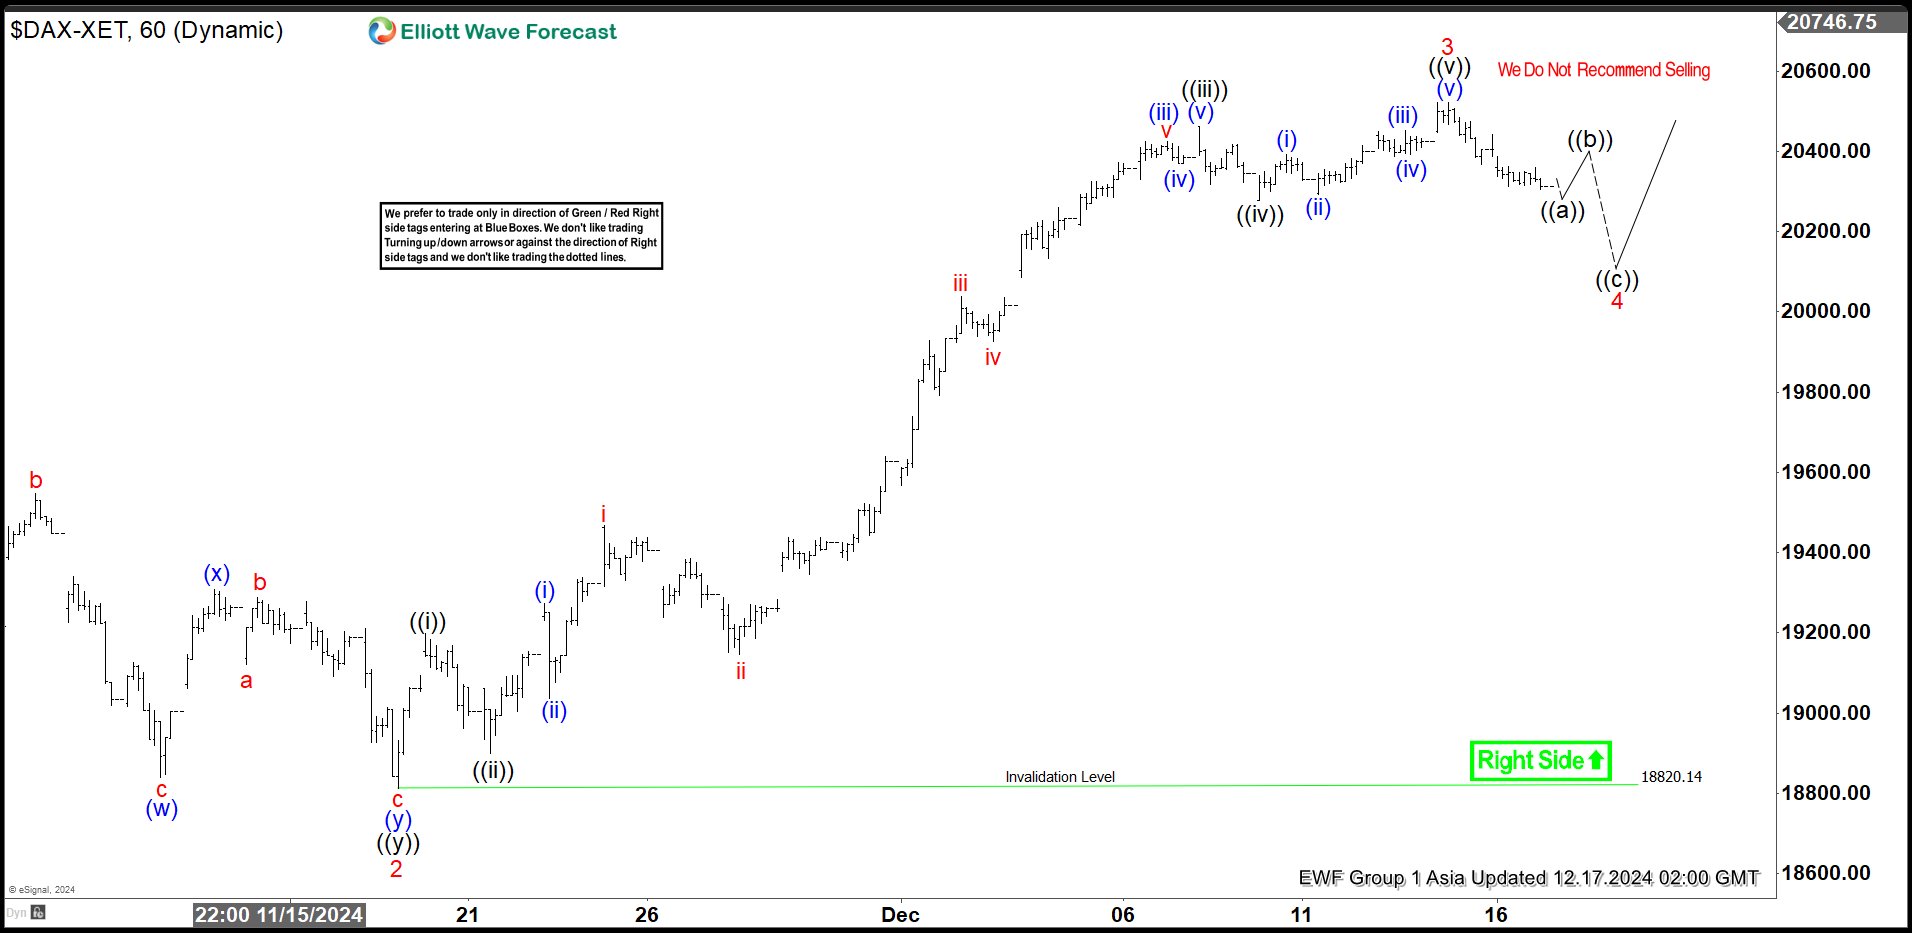
Elliott Wave View: DAX Pullback Should Find Buyers
Read MoreDAX is looking to correct cycle from 11.19.2024 low in 3, 7, or 11 swing before it resumes higher. This article and video look at the Elliott Wave path.
-
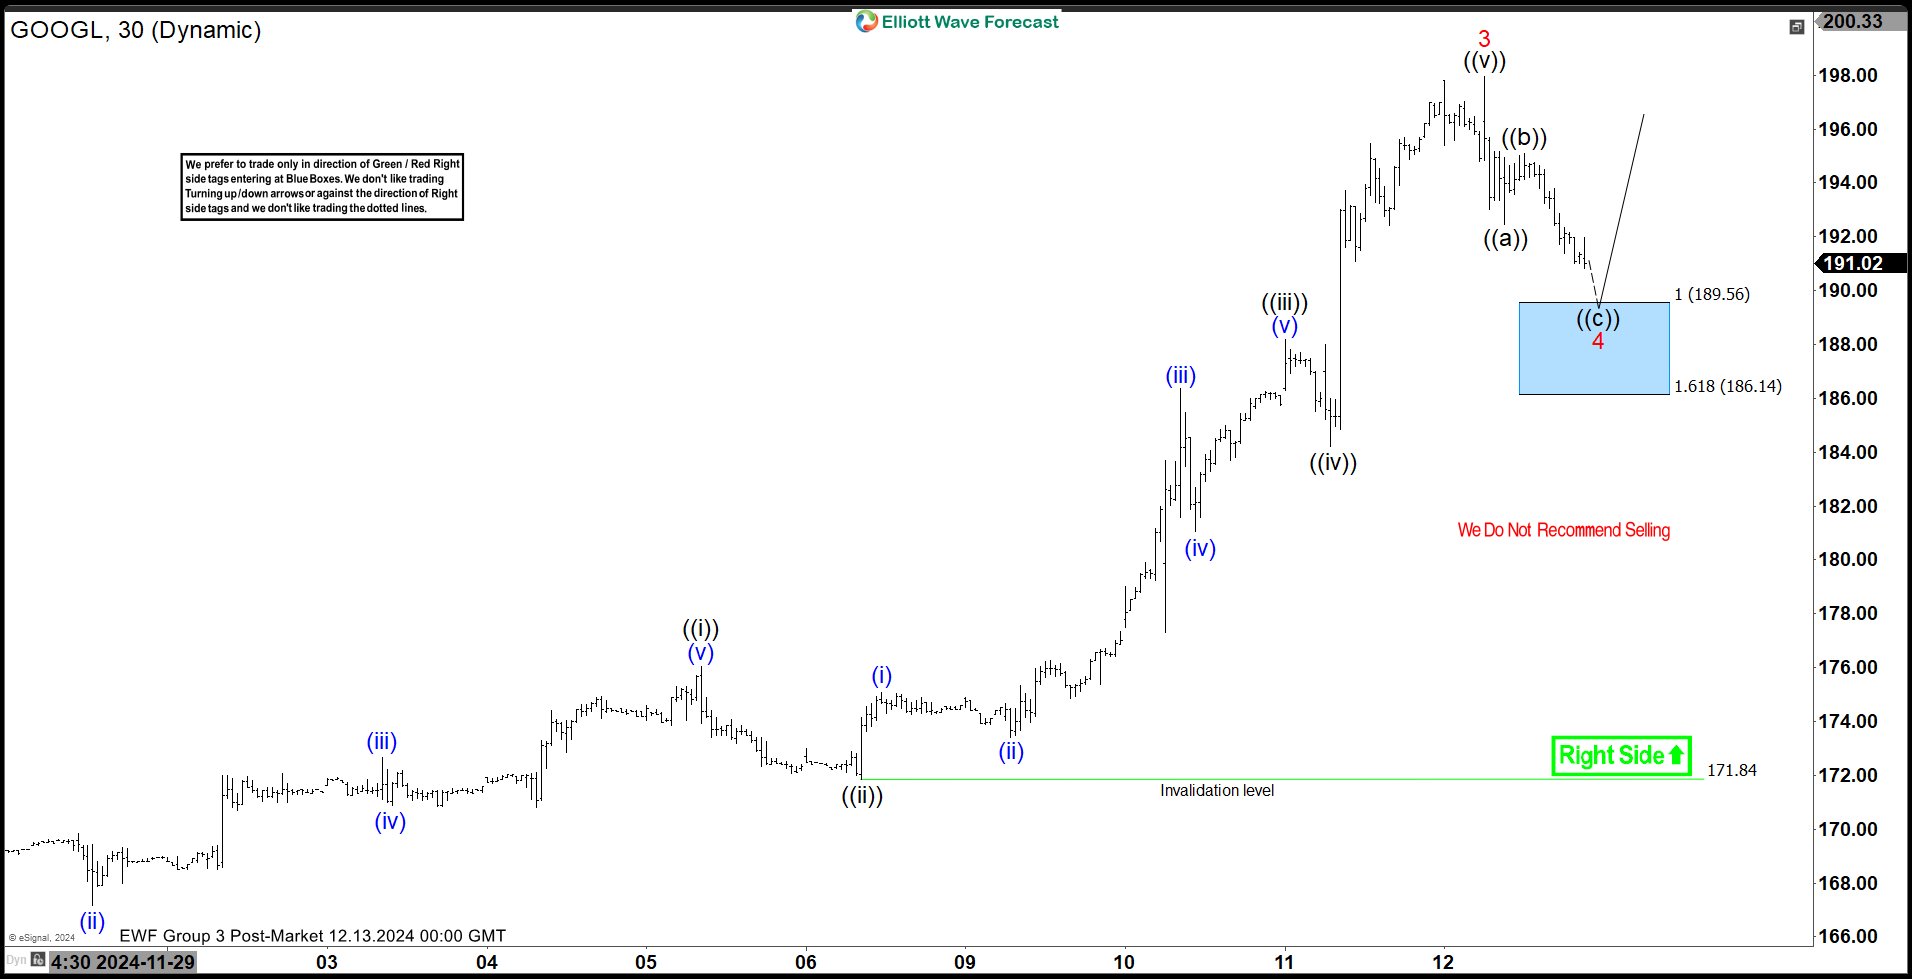
Alphabet Inc. $GOOGL Blue Box Area Offers A Buying Opportunity
Read MoreHello everyone! In today’s article, we’ll examine the recent performance of Alphabet Inc. ($GOOGL) through the lens of Elliott Wave Theory. We’ll review how the rally from the November 21, 2024, low unfolded as a 5-wave impulse and discuss our forecast for the next move. Let’s dive into the structure and expectations for this stock. 5 Wave Impulse Structure + […]
-
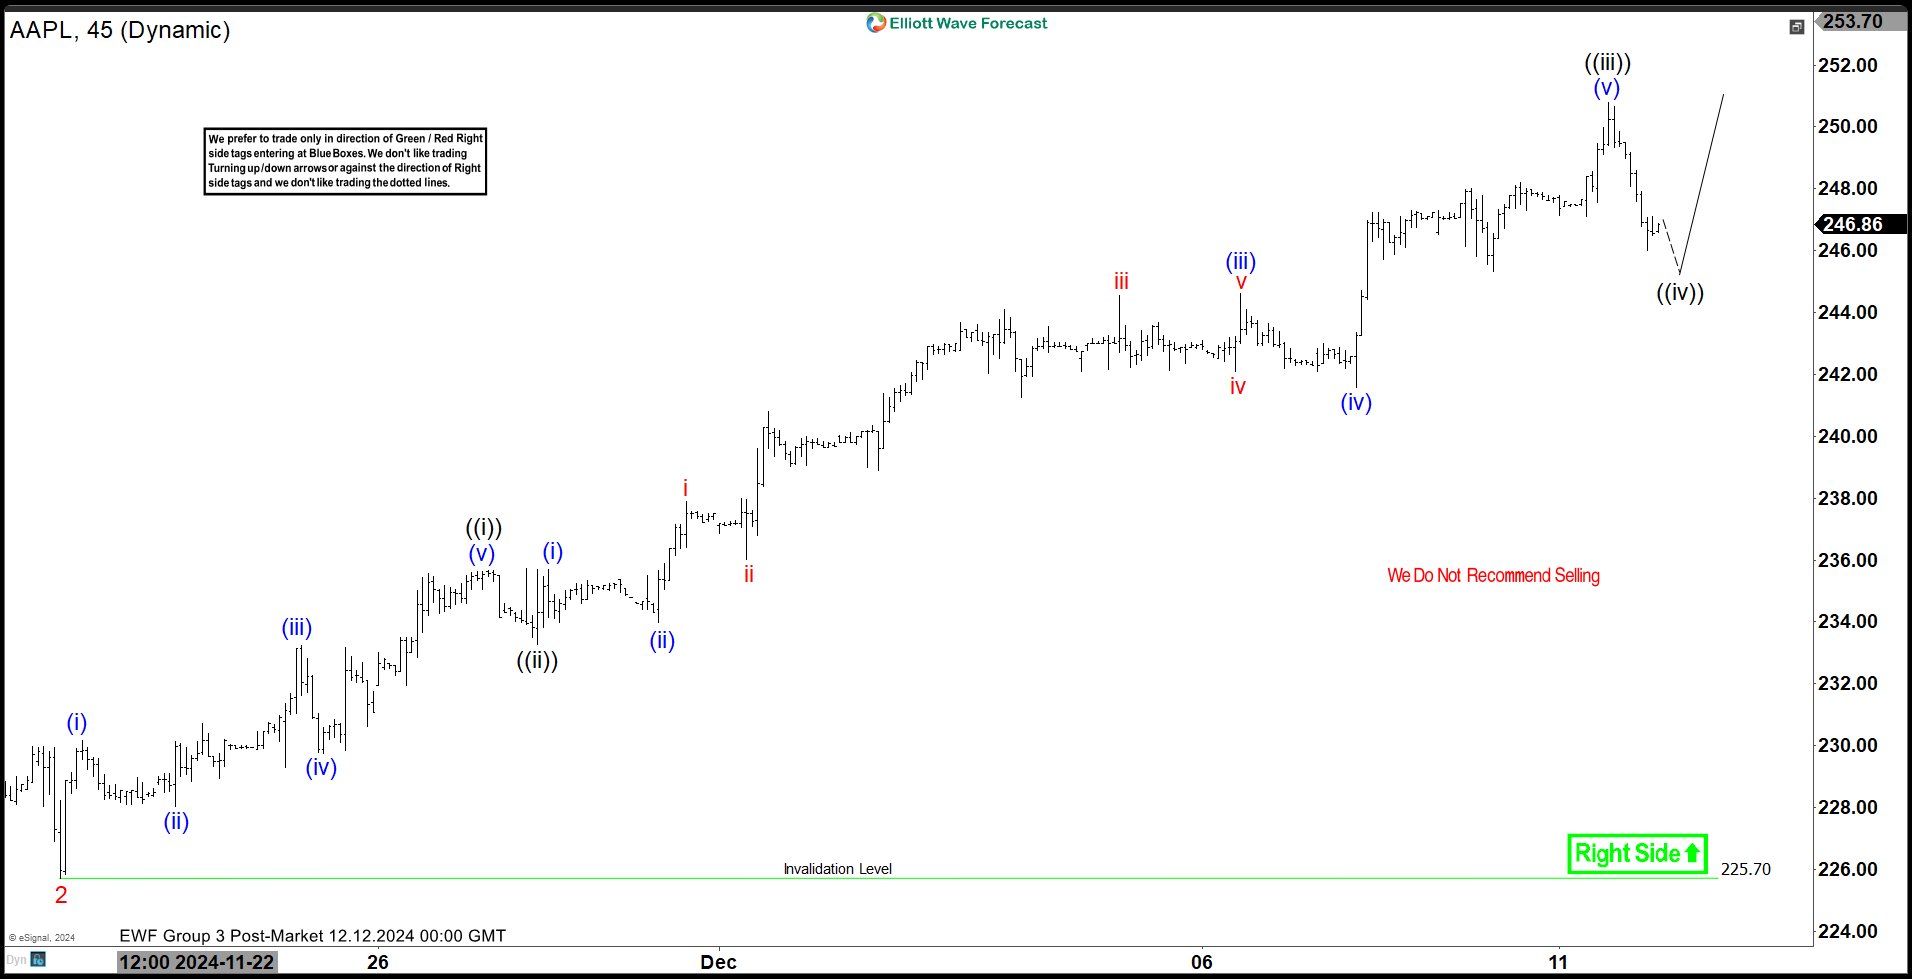
Elliott Wave View: APPLE (AAPL) Continue Rally In Bullish Sequence
Read MoreShort Term Elliott Wave view in APPLE (AAPL) suggests that rally from 8.05.2024 low is incomplete & should continue upside as the part of daily bullish sequence. It is showing 3 swing higher since August-2024 low & expect more upside against 11.04.2024 low. It ended (1) at $237.49 high as diagonal & (2) correction at […]
-
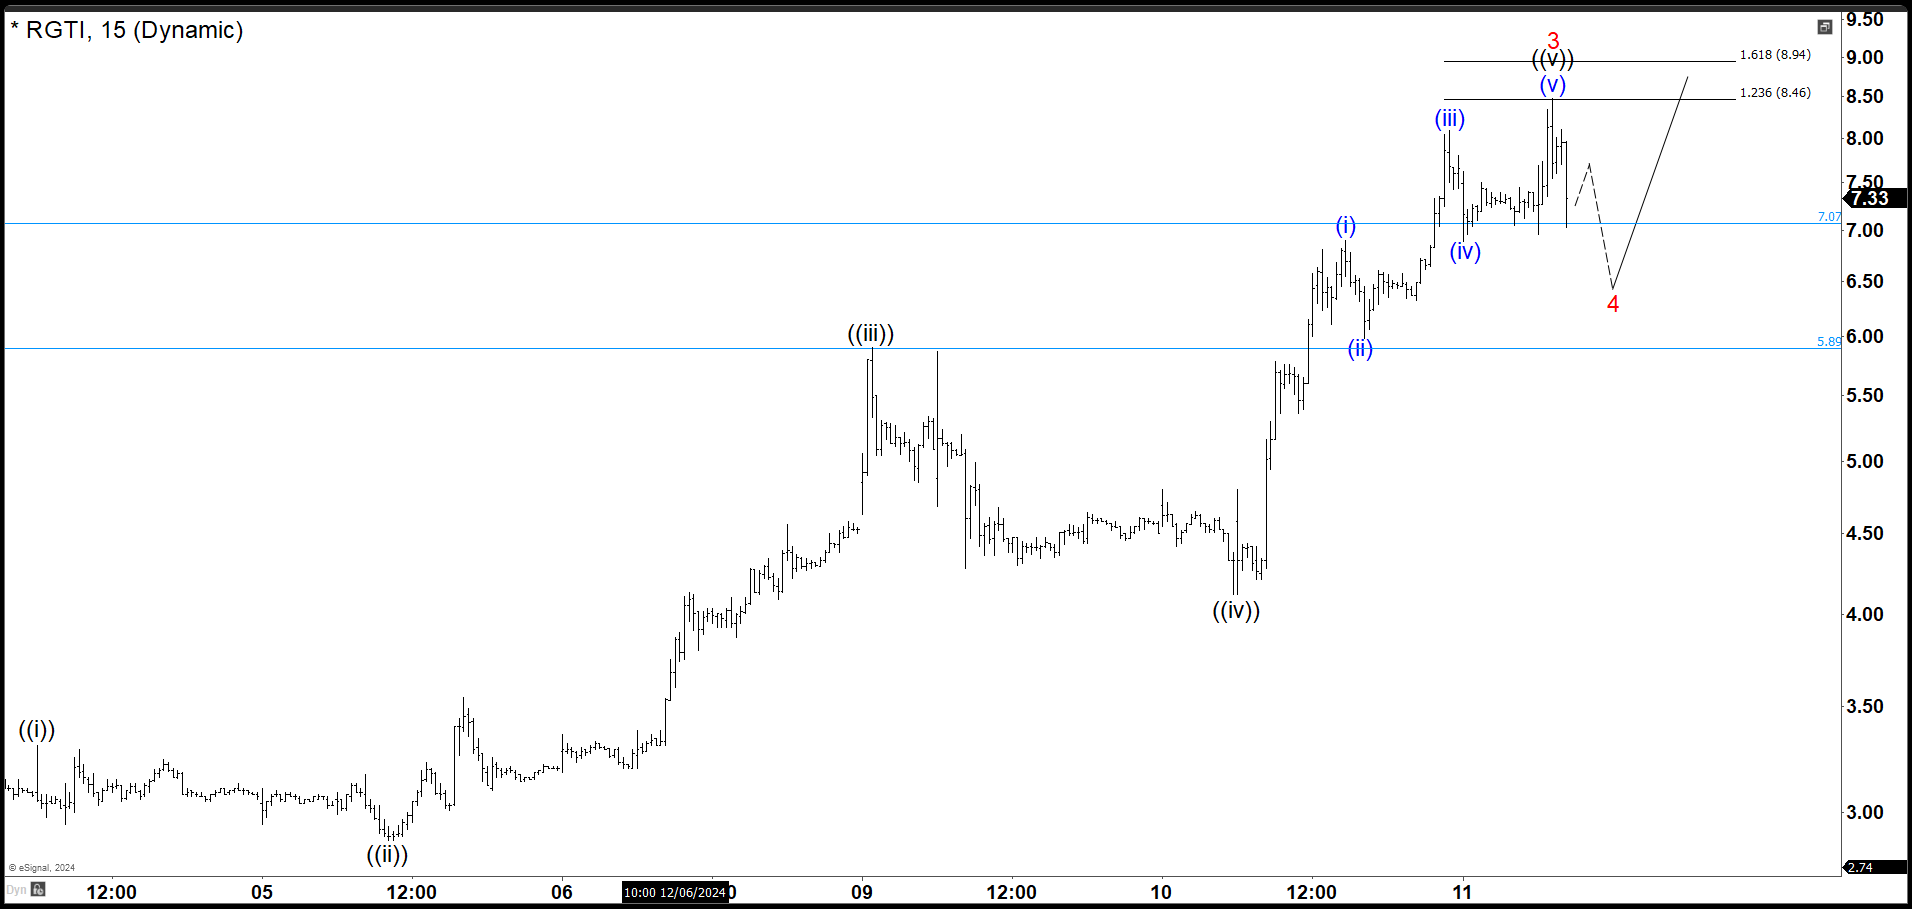
RGTI is Looking for Support in 5.89 – 7.07 Area
Read MoreRGTI has risen rapidly in value in recent days attracting the attention of investors. Here we have the 15-minute chart. Applying the Elliott Waves principle, the stock should find support in 5.89 – 7.07 area to complete a wave 4. This would generate a new rally on wave 5 that could reach around 8.94 – […]
-
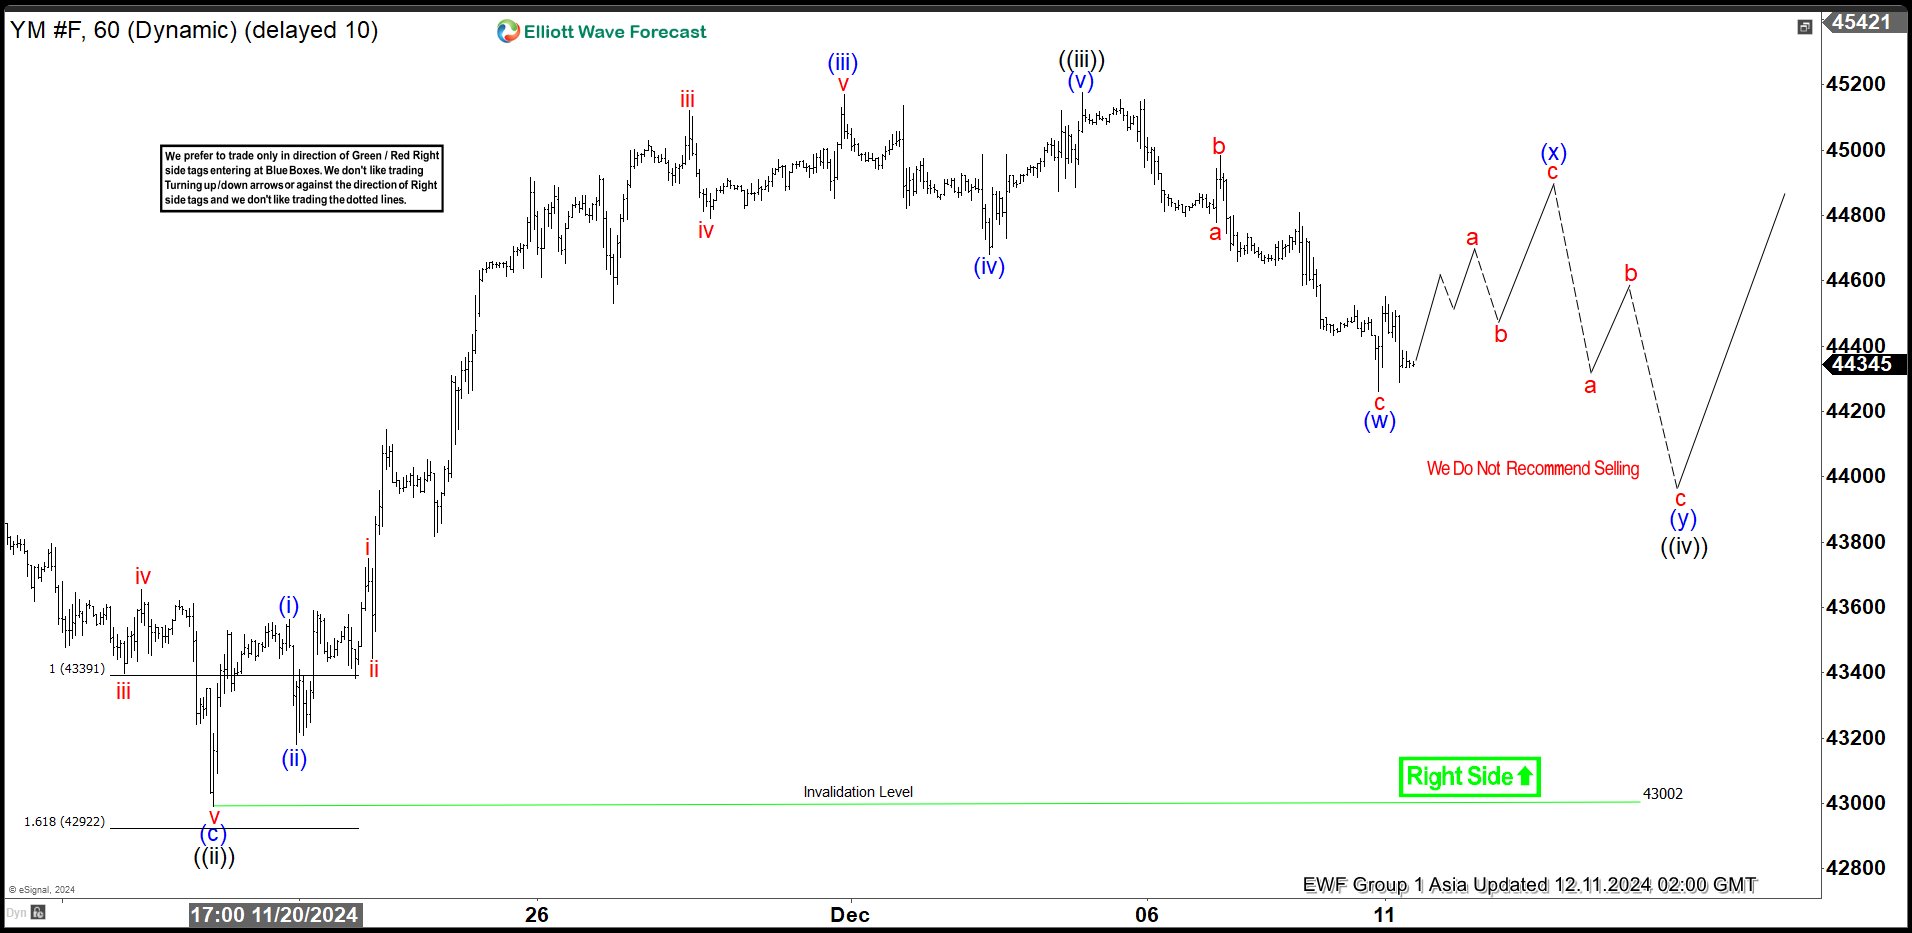
Elliott Wave View: Dow Futures (YM) Looking for Further Upside
Read MoreDow Futures (YM) pullback is looking to find support in 3, 7, 11 swing. This article and video look at the Elliott Wave path.
-
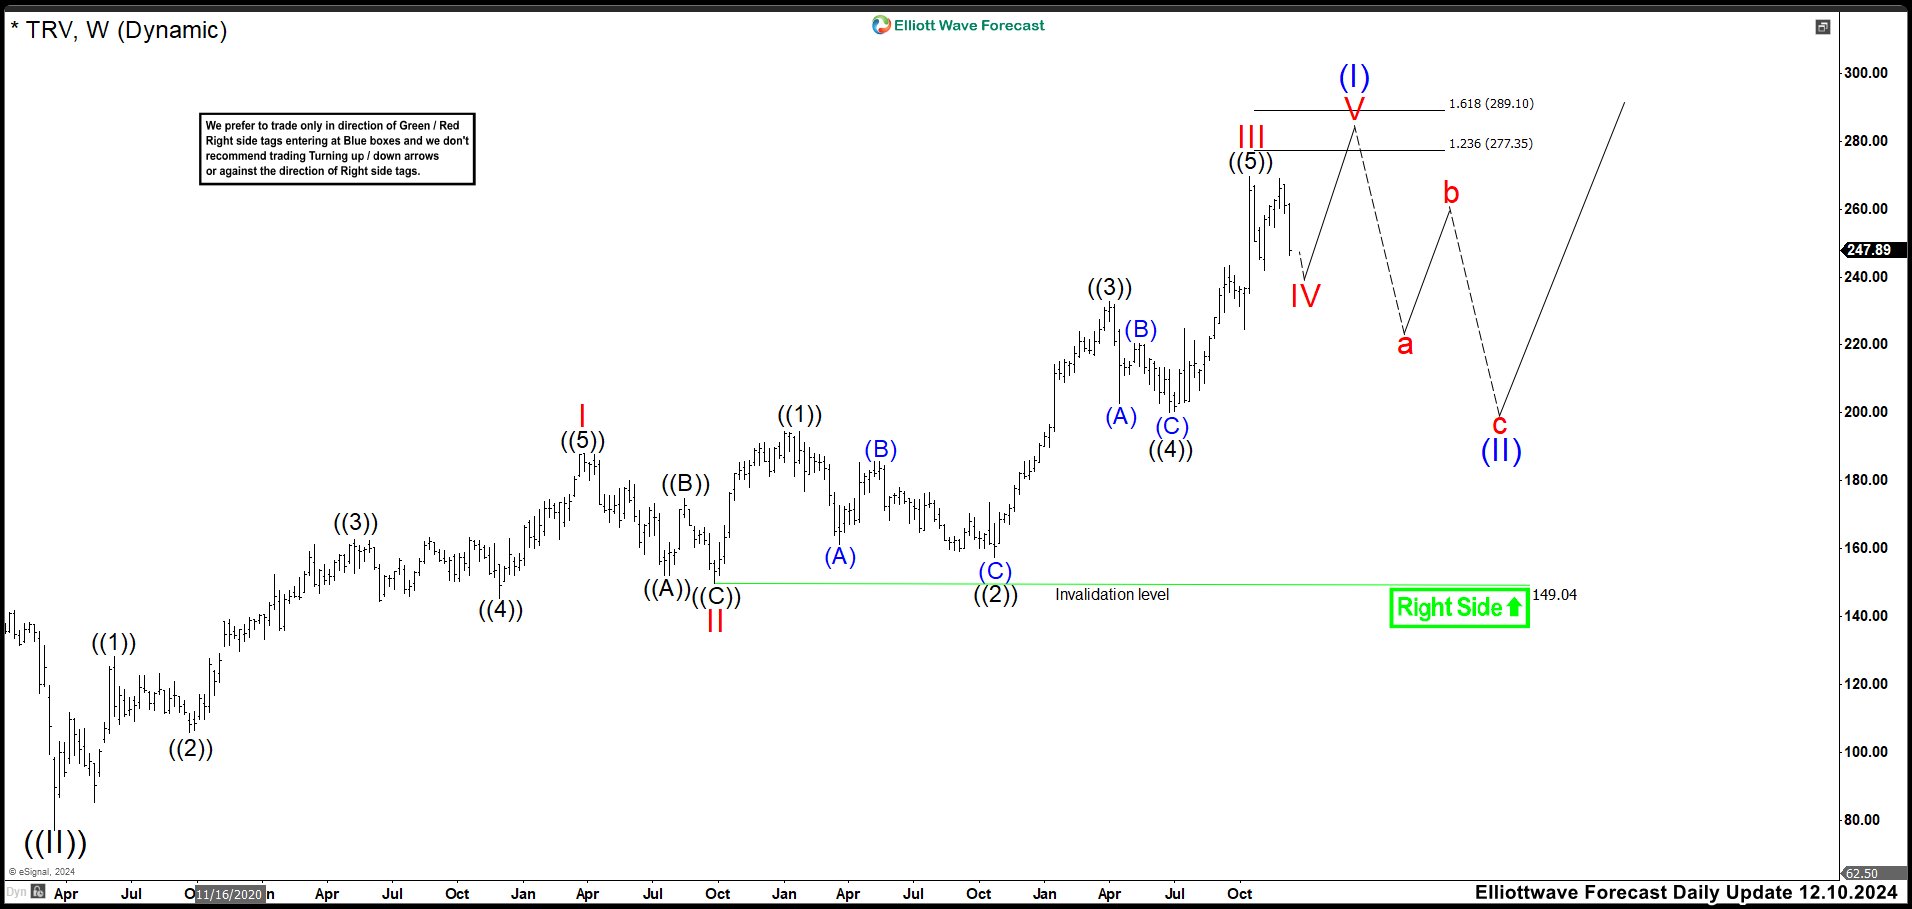
The Travelers TRV is Looking for more Upside to End an Impulse
Read MoreThe Travelers Companies, Inc., TRV, is an American insurance company. It is the second-largest writer of U.S. commercial property casualty insurance, and the sixth-largest writer of U.S. personal insurance through independent agents. Weekly TRV Chart July 2024 In July, we saw a rally as expected, but missing the blue box by 5 dollars. Also, we adjusted […]