

The Power of 3-7-11 and the Grand Super Cycle: How We Saw the Bullish Turn in April 2025 Back on April 9, 2025, while World Indices were dropping sharply and global sentiment had turned overwhelmingly bearish, we published an article that challenged the fear-driven narrative. We explained why selling was not the right approach and […]
-
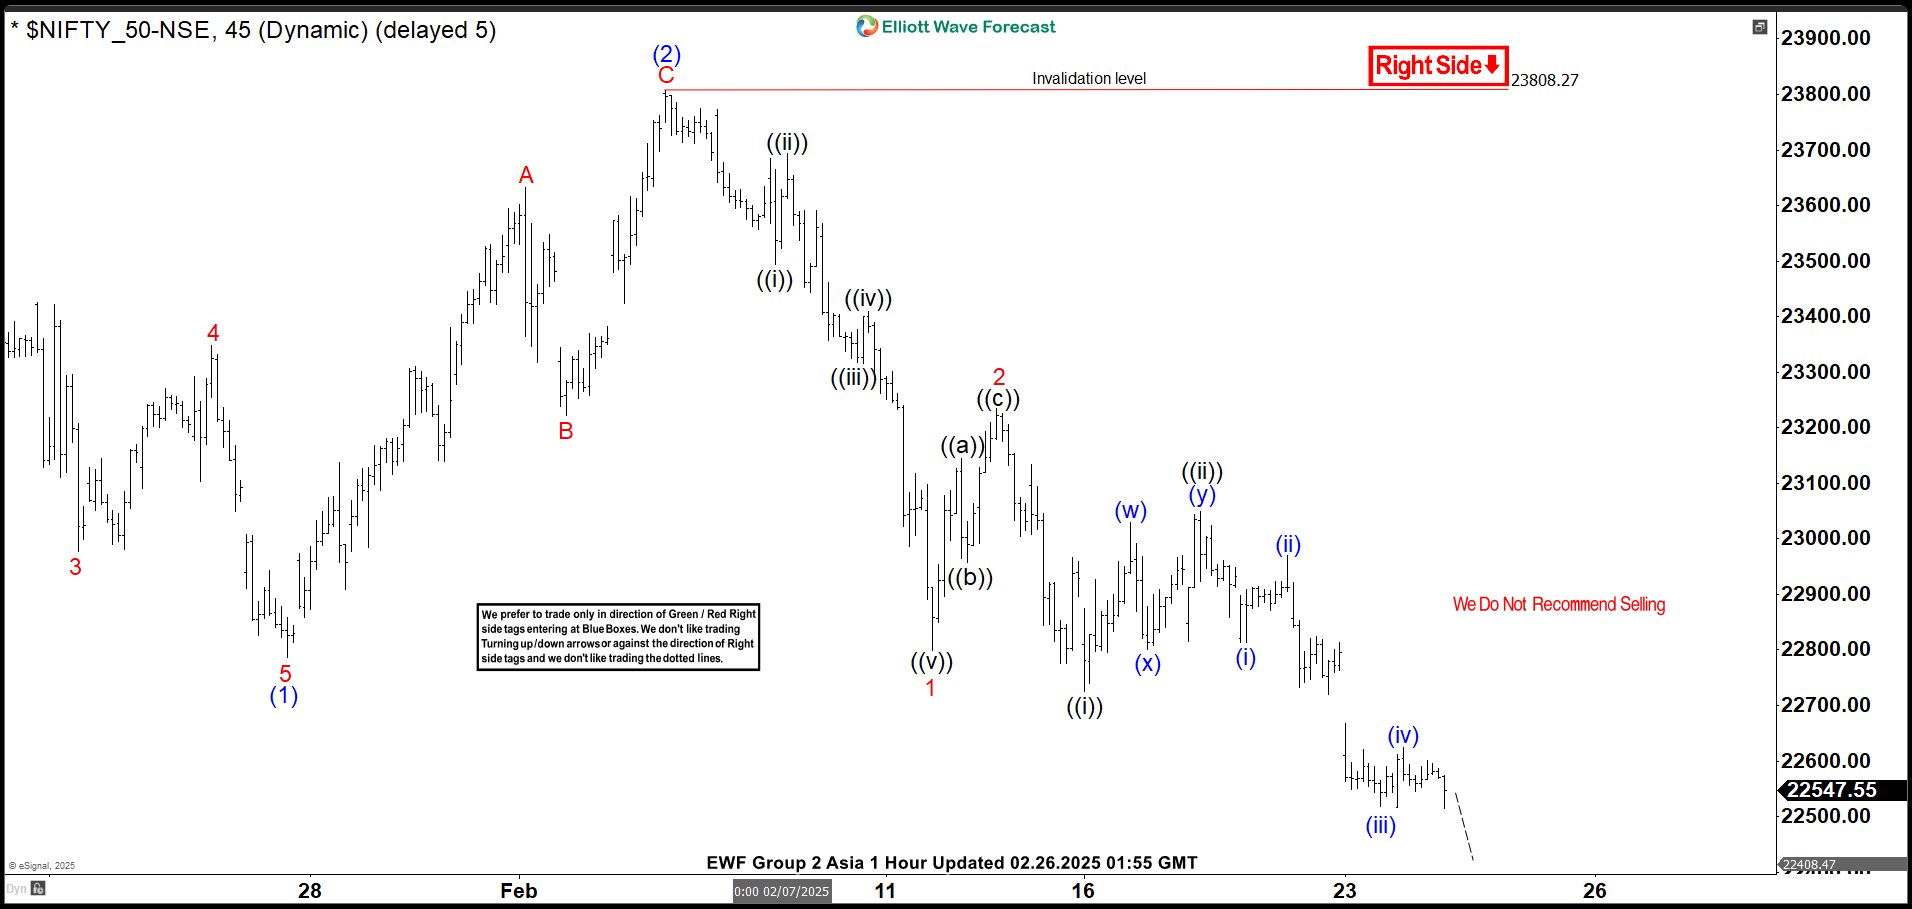
Elliott Wave View: Bearish Sequence in Nifty Favors Downside
Read MoreBearish sequence in Nifty from 9.27.2024 high favors further downside. This article and video look at the Elliott Wave path of the Index.
-

NASDAQ Elliott Wave Forecast – Identifying The Next Buying Opportunity
Read MoreThe NASDAQ (NQ_F) remains bullish from the all-time low despite the pullback from December 2024. The pullback could present a perfect opportunity for buyers in the coming days. This blog post will address key price areas for the buyers to anticipate the next opportunity. NASDAQ (NQ) is in an all-time bullish trend. Within this all-time […]
-

NextEra Energy (NEE) Should Bounce Towards $75.77
Read MoreNextEra Energy, Inc., (NEE) through its subsidiaries generates, transmits, distributes & sells electric power to retail & wholesale customers in North America. The company generates electricity, through wind, solar, nuclear, natural gas & other clean energy. It comes under Utility sector & trades as “NEE” ticker at NYSE. As shown in the last article, NEE […]
-

Elliott Wave View: Amazon (AMZN) in Support Zone
Read MoreAmazon (AMZN) has reached the extreme area from 5 February 2025 high and soo can see support. This article and video look at the Elliott Wave path.
-

BYD Company Limited (1211.HK) Breaking in Wave 3
Read MoreBYD Company Limited (ticker: 1211.HK in Hong Kong Stock Exchange) breaks in wave 3. This article looks at the Elliott Wave path.
-

PepsiCo Finds Support in the Blue Box – Extended Rally Ahead?
Read MoreHello traders. Welcome to a new blog post discussing about the blue box. In today’s post, the spotlight will be on the PepsiCo ($PEP) stock price. The stock found support at the extreme last week. What next for traders? PepsiCo is a global food and beverage company with the headquarters in New York. It was […]