

The Power of 3-7-11 and the Grand Super Cycle: How We Saw the Bullish Turn in April 2025 Back on April 9, 2025, while World Indices were dropping sharply and global sentiment had turned overwhelmingly bearish, we published an article that challenged the fear-driven narrative. We explained why selling was not the right approach and […]
-
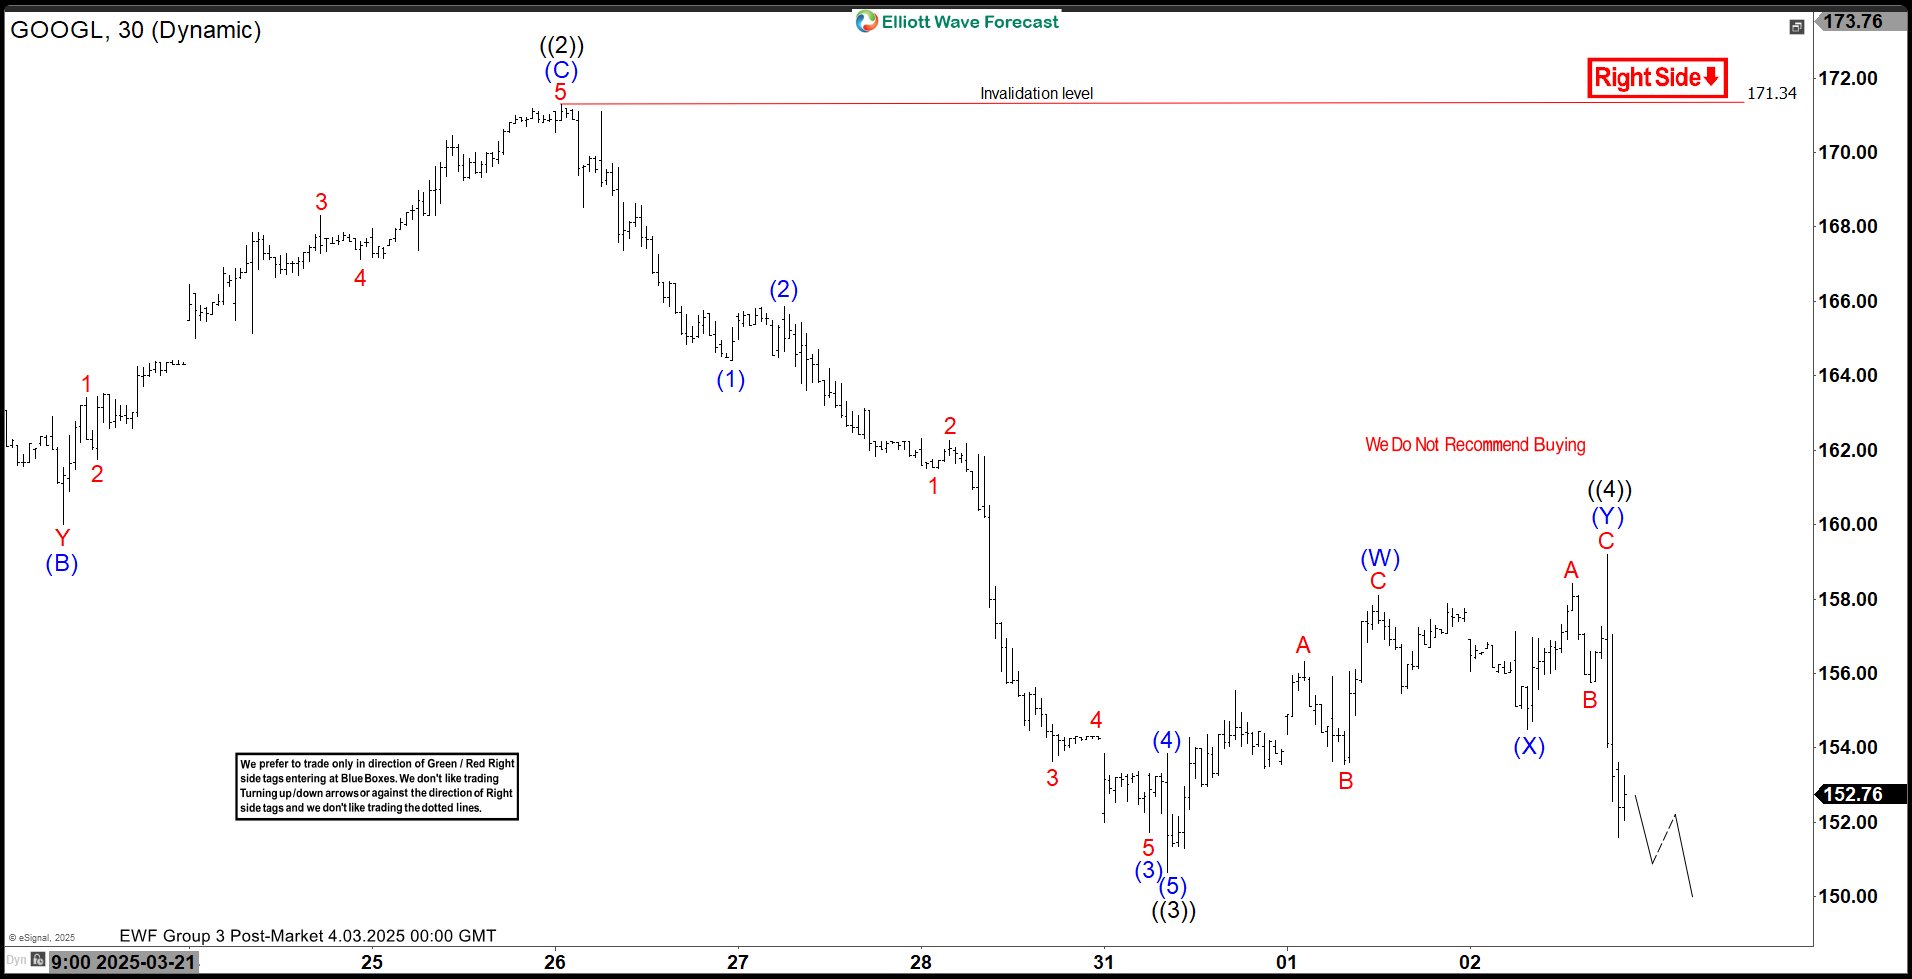
Elliott Wave Analysis: Alphabet ($GOOGL) Nearing Completion of 5-Wave Decline
Read MoreAlphabet (GOOGL) is ending 5 waves decline from 2.4.2025 high before 3 waves rally. This article and video look at the Elliott Wave path.
-
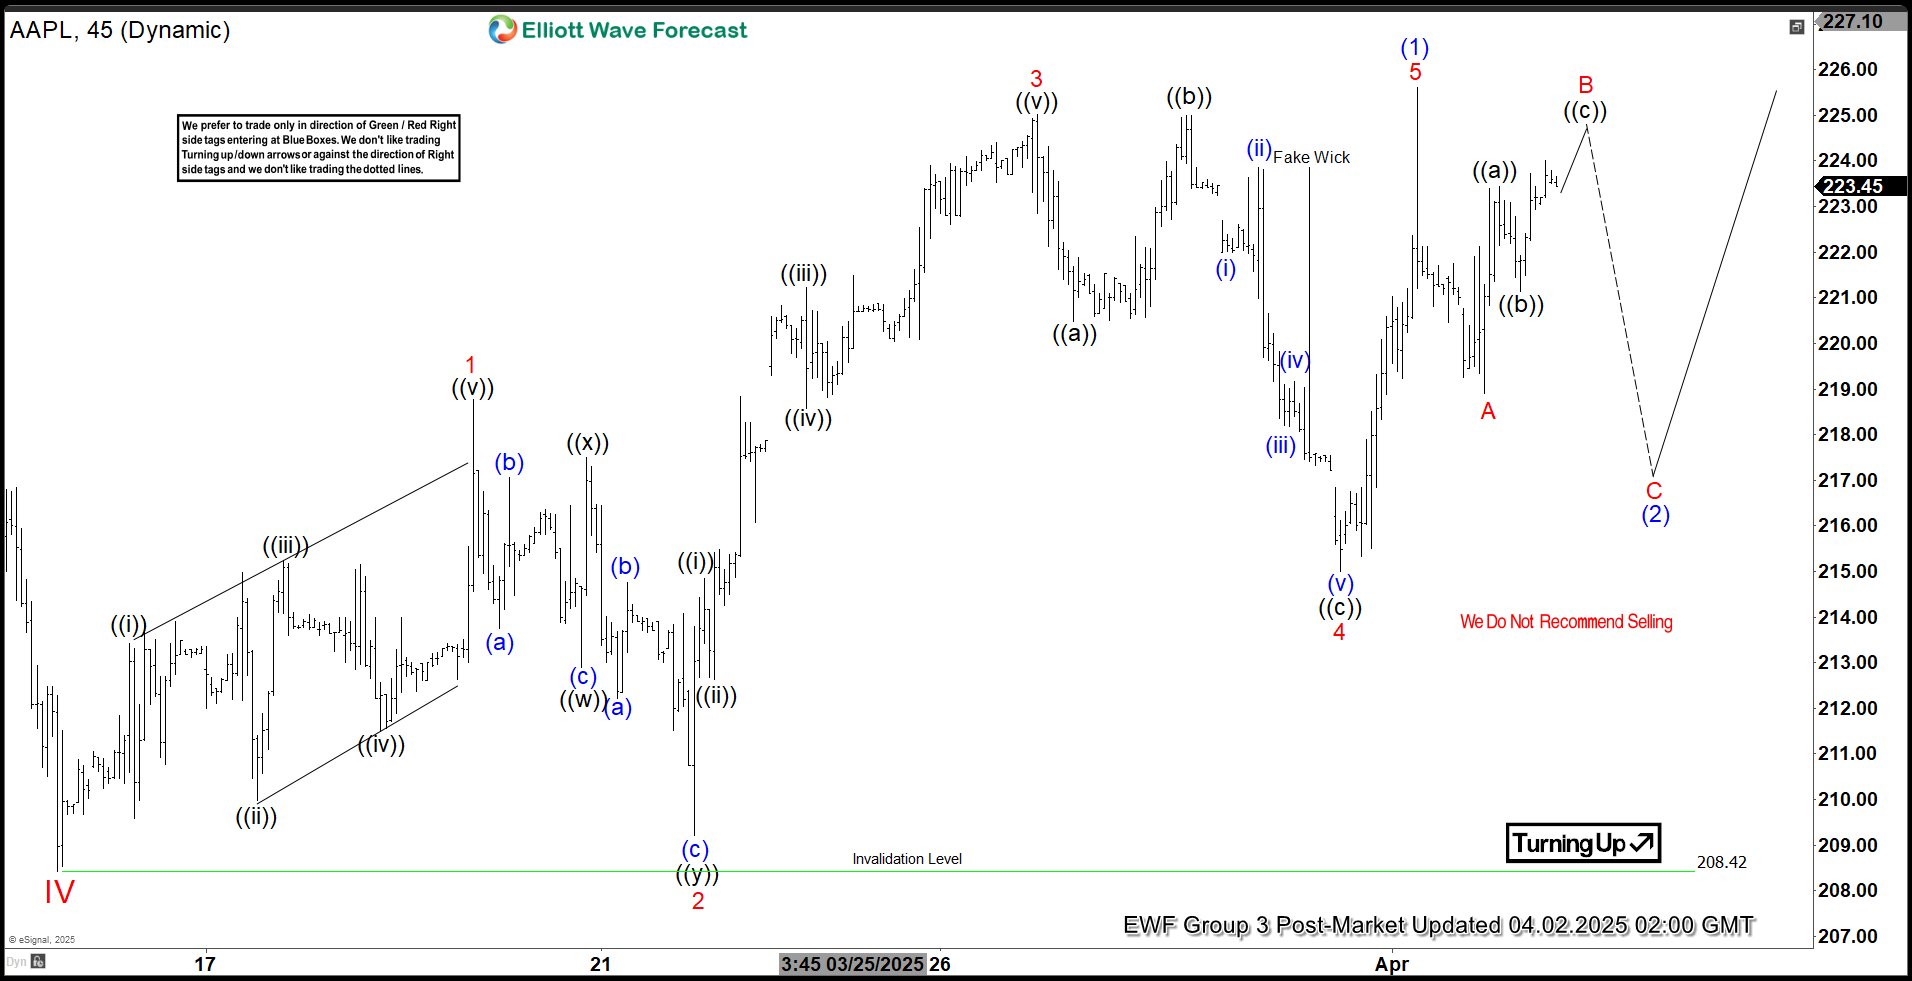
Apple (AAPL) Gains Momentum with 5 Swing Rally, Upside Likely
Read MoreApple (AAPL) Posts 5-Swing Rally from March 14, 2025 Low, Hinting at Further Gains; Article and Video Explore Elliott Wave Path
-
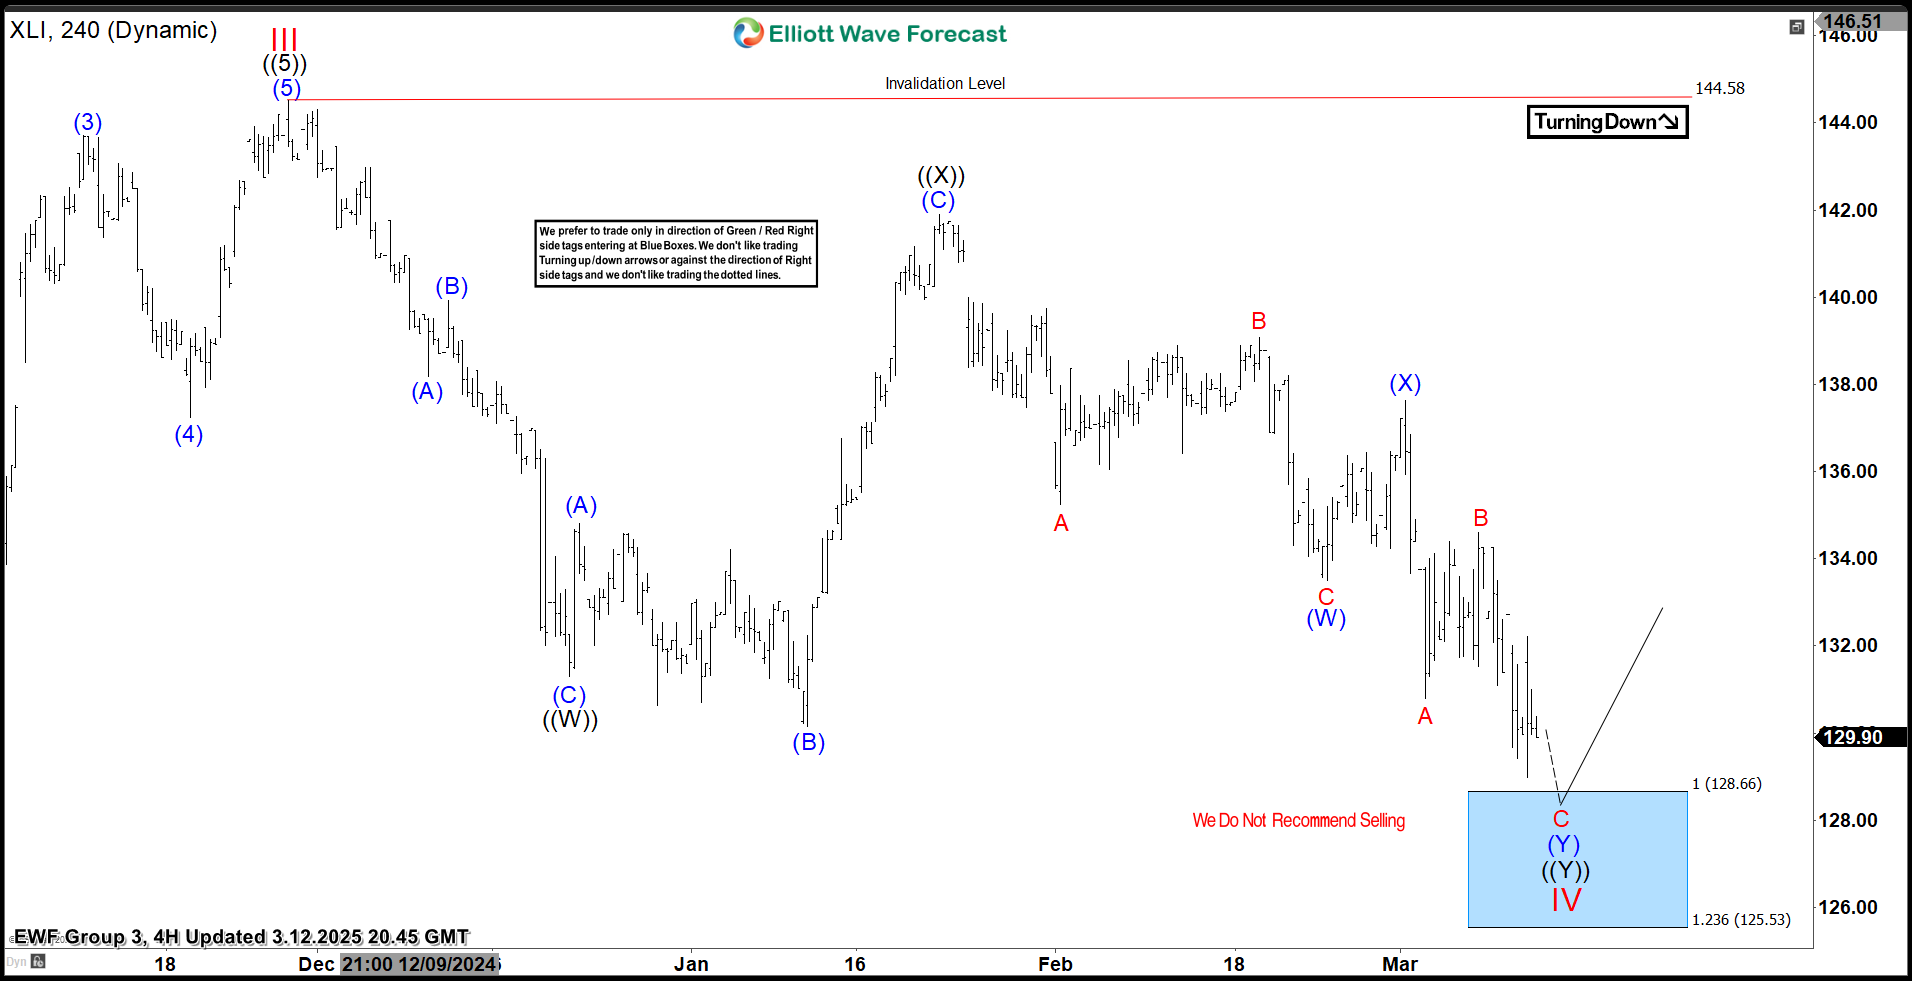
SPDR Industrial ETF $XLI Blue Box Area Offers A Buying Opportunity
Read MoreHello everyone! In today’s article, we’ll examine the recent performance of SPDR Industrial ETF ($XLI) through the lens of Elliott Wave Theory. We’ll review how the decline from the November 27, 2024 high unfolded as a 7-swing correction and discuss our forecast for the next move. Let’s dive into the structure and expectations for this stock. 7 Swing WXY […]
-
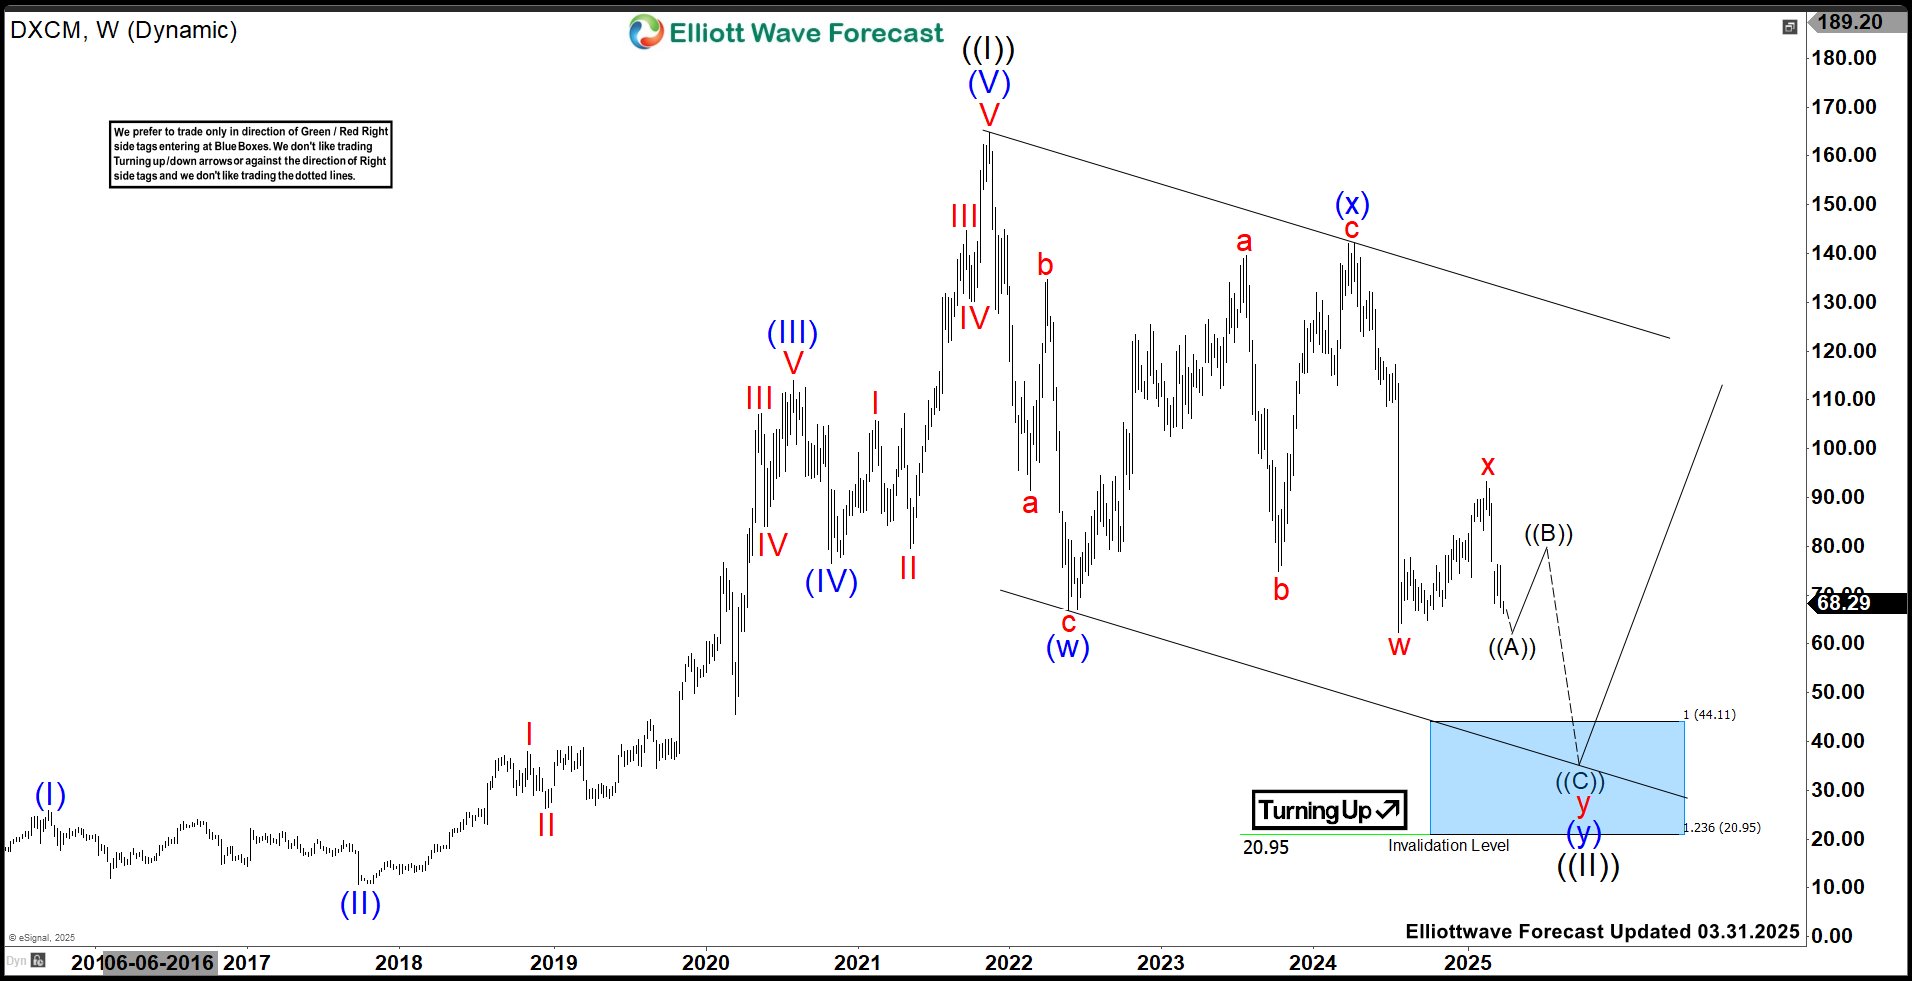
DexCom Inc (DXCM): Forecasting Trends & Key Levels In Double Correction
Read MoreDexCom Inc., (DXCM) prominent player in the healthcare sector, specializes in continuous glucose monitoring systems, helping improve diabetes management. Listed on Nasdaq under the ticker “DXCM,” the company operates on a global scale. This stock reflects a notable trading pattern, with anticipated market movements providing insights for investors. From a technical perspective, DXCM has been […]
-
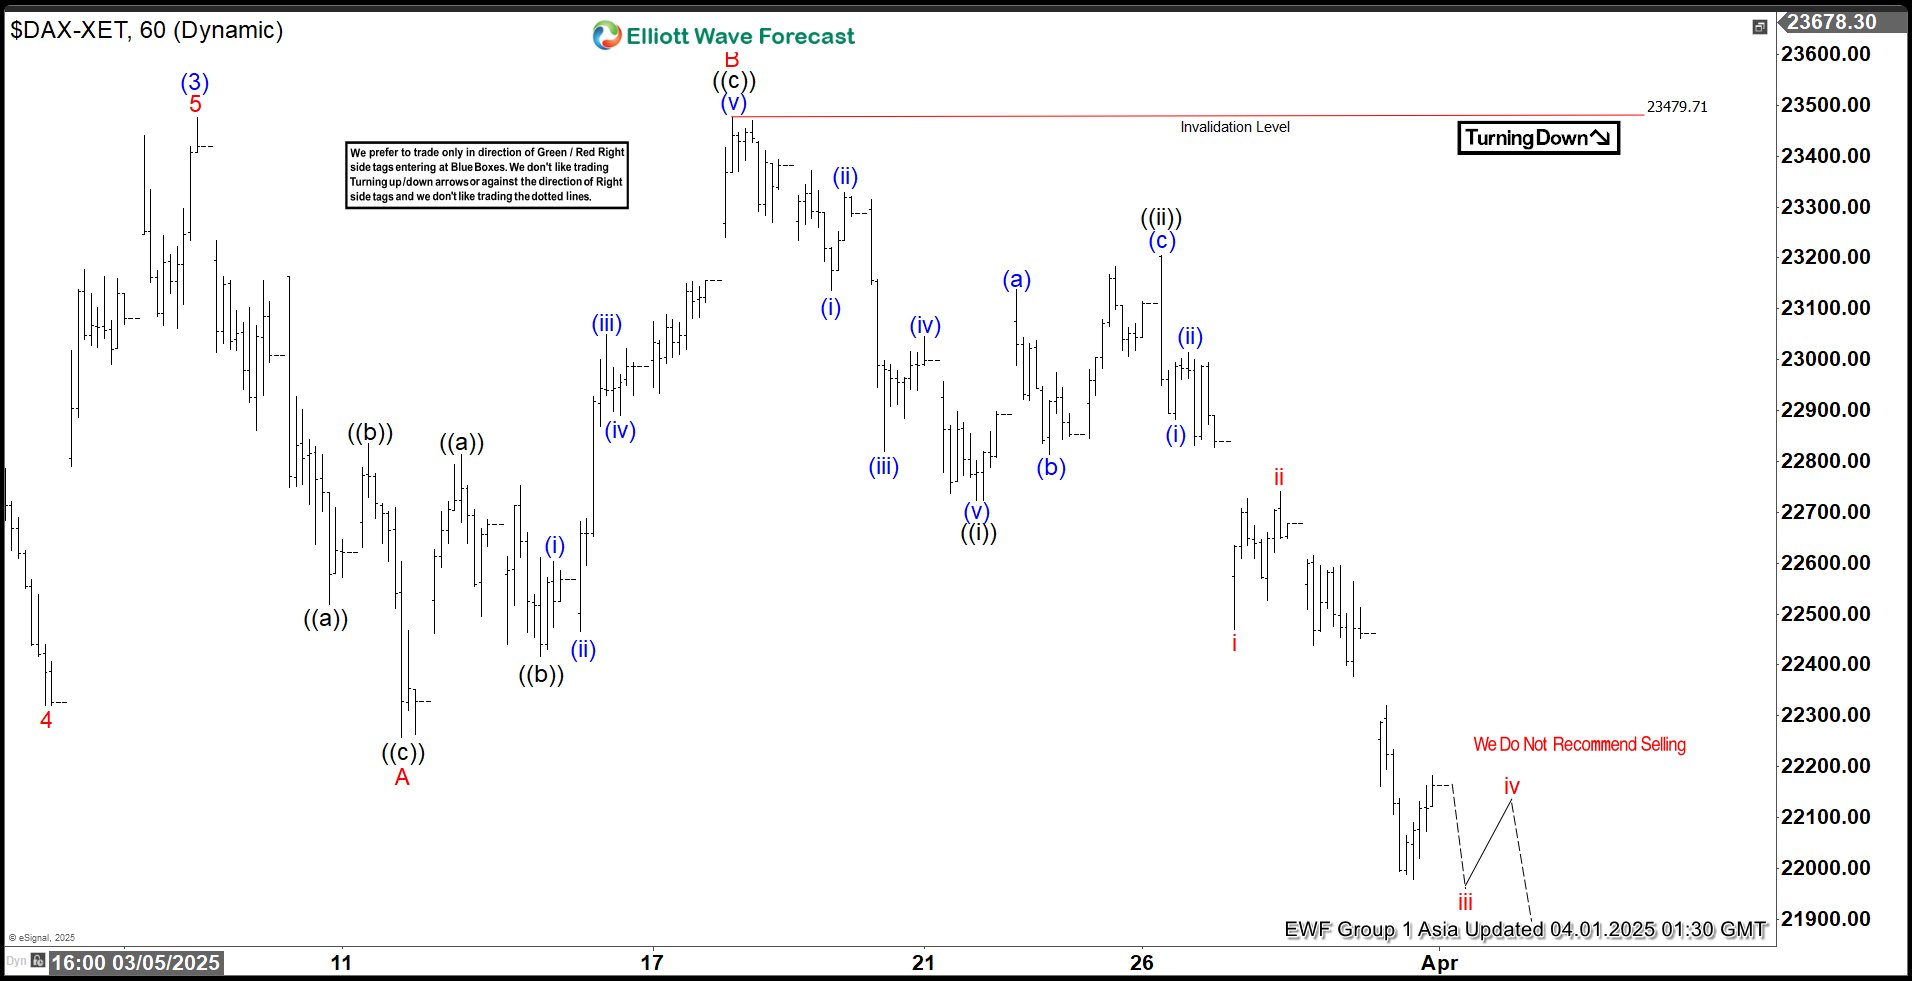
The DAX is declining in an impulsive structure, according to Elliott Wave perspective
Read MoreDAX decline from March 18, 2025 high is progressing as a 5-wave impulse, suggesting further downside. This article & video explore Elliott Wave trajectory.
-
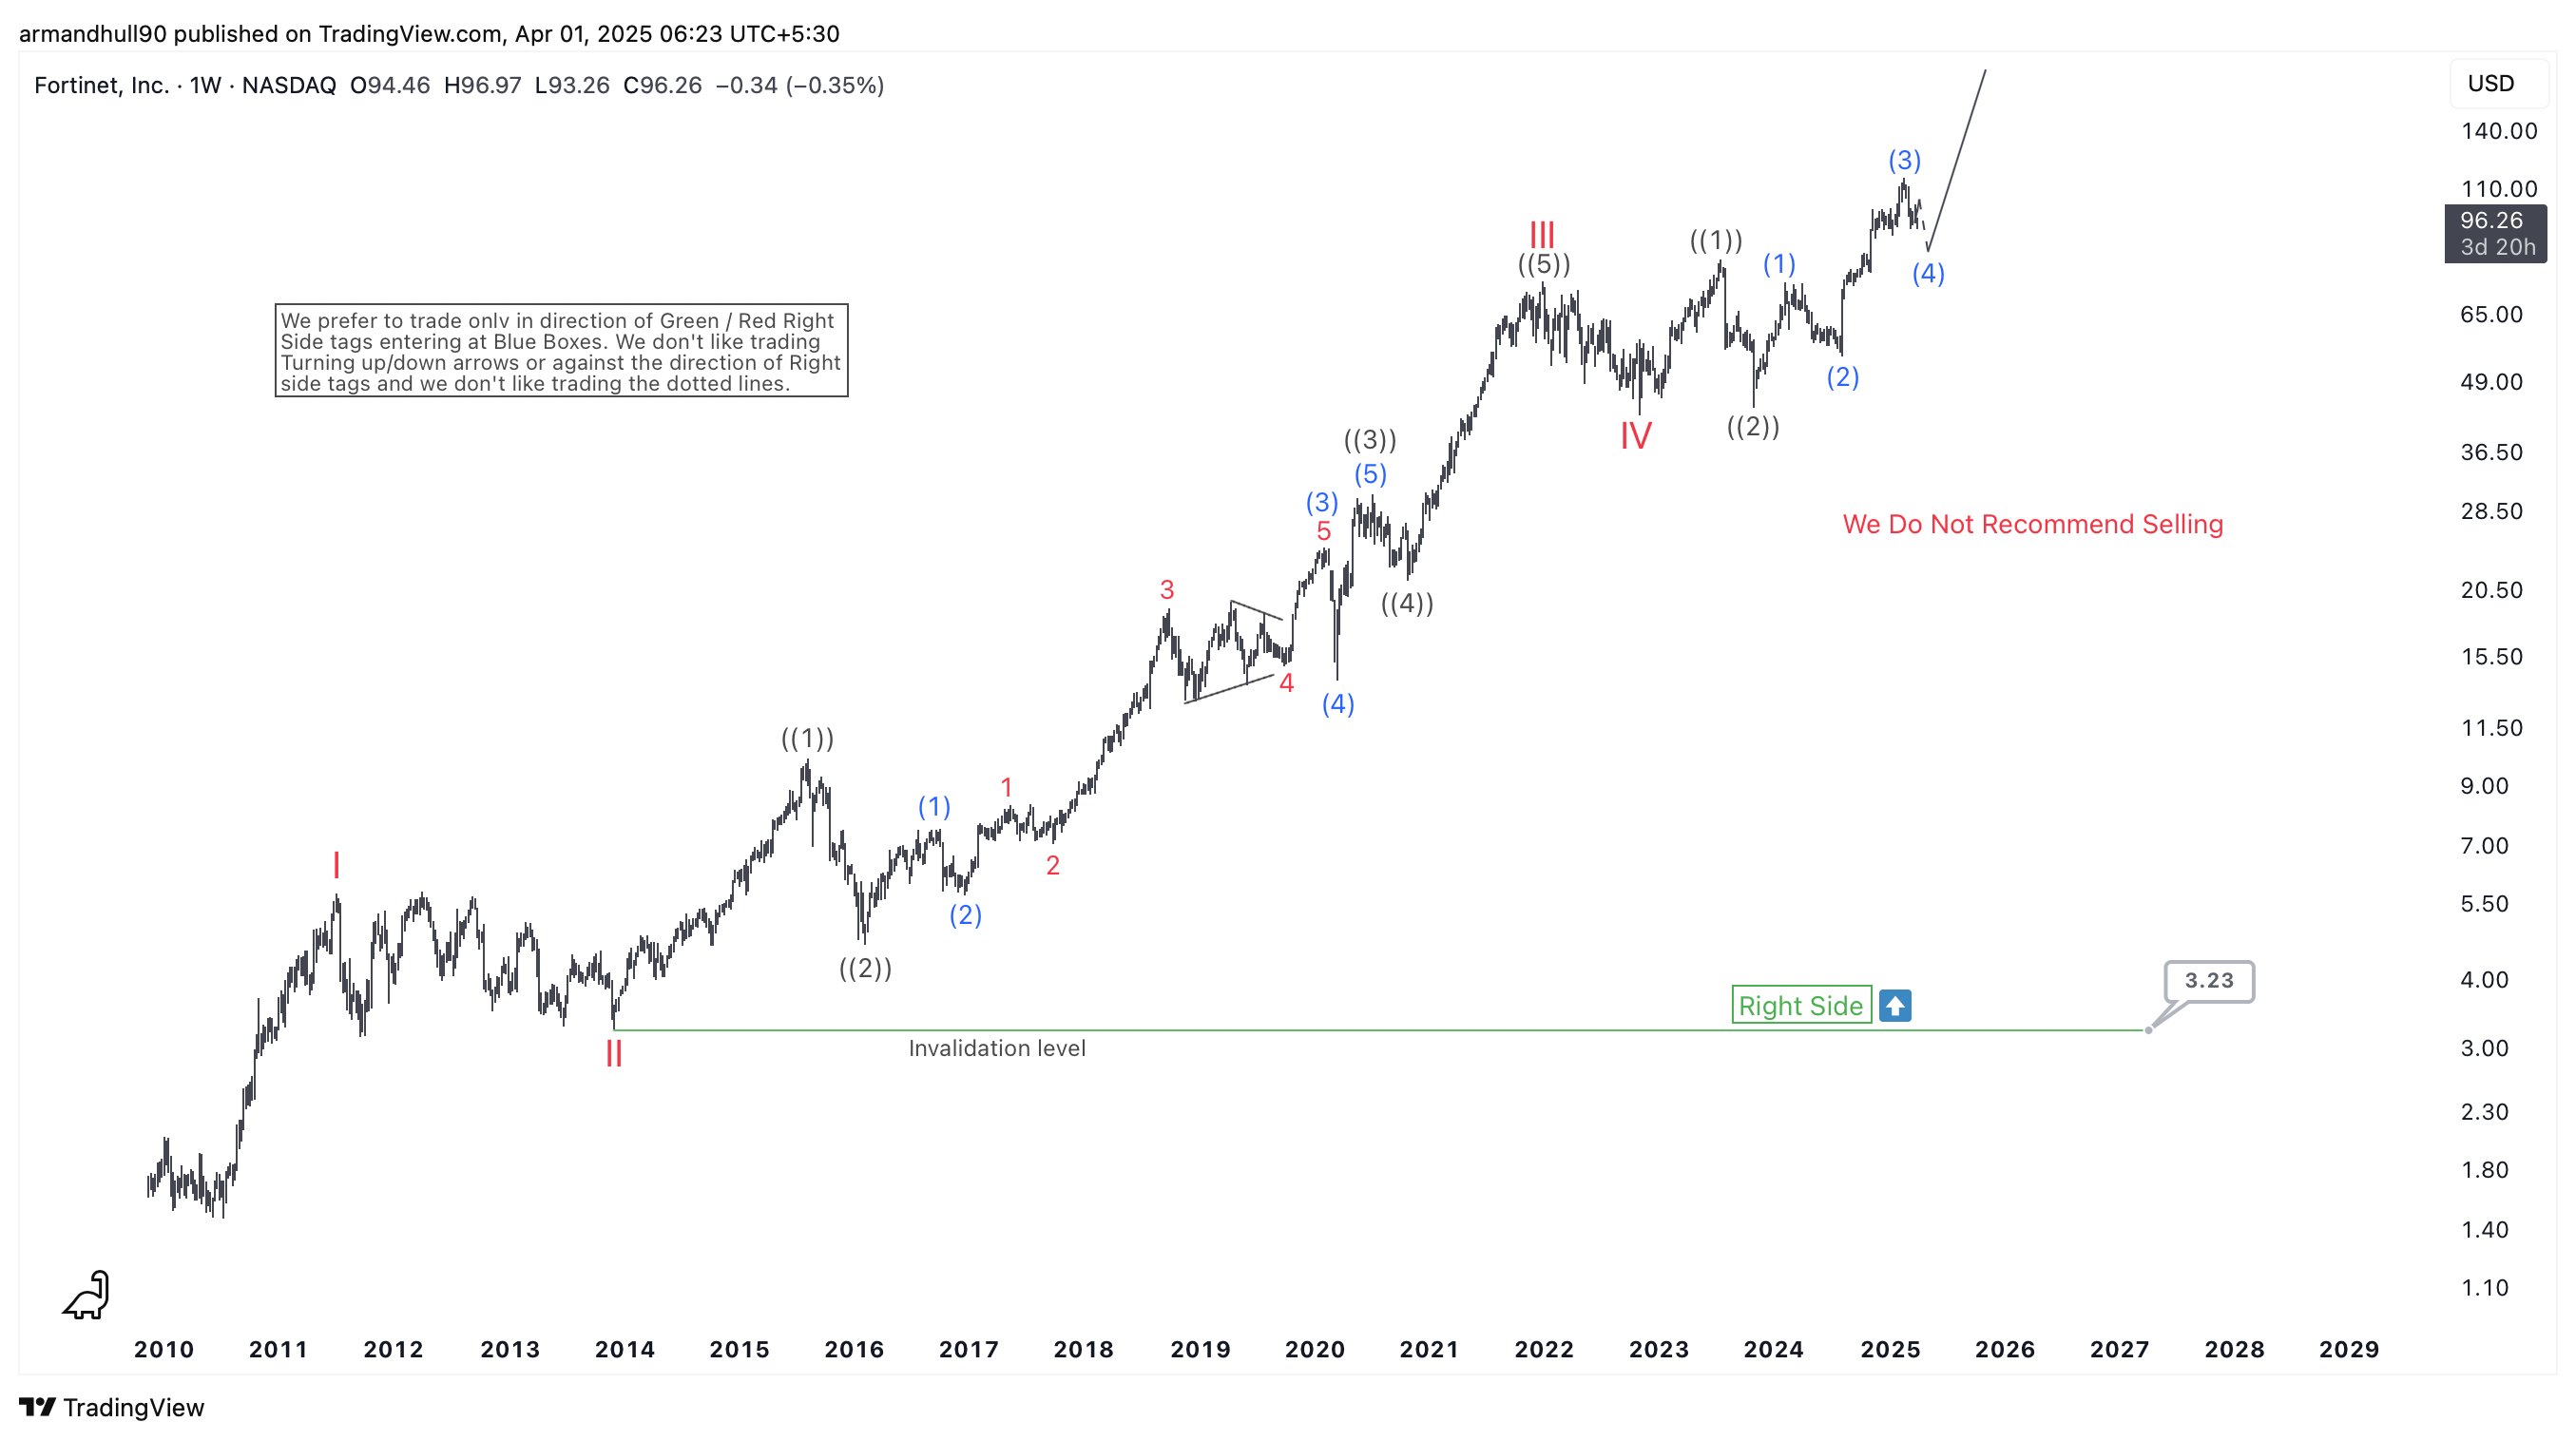
Fortinet Inc. (FTNT) Elliott Wave Forecast: Bullish Trend Continues
Read MoreUnderstanding Fortinet’s Long-Term Growth Potential Through Elliott Wave Analysis Fortinet Inc. (FTNT) remains in a long-term bullish cycle, with Elliott Wave analysis signaling further upside. The stock recently completed a significant correction and appears ready for the next move higher. Weekly Elliott Wave Analysis: The weekly chart of FTNT highlights a clear five-wave impulsive advance, […]