

The Power of 3-7-11 and the Grand Super Cycle: How We Saw the Bullish Turn in April 2025 Back on April 9, 2025, while World Indices were dropping sharply and global sentiment had turned overwhelmingly bearish, we published an article that challenged the fear-driven narrative. We explained why selling was not the right approach and […]
-
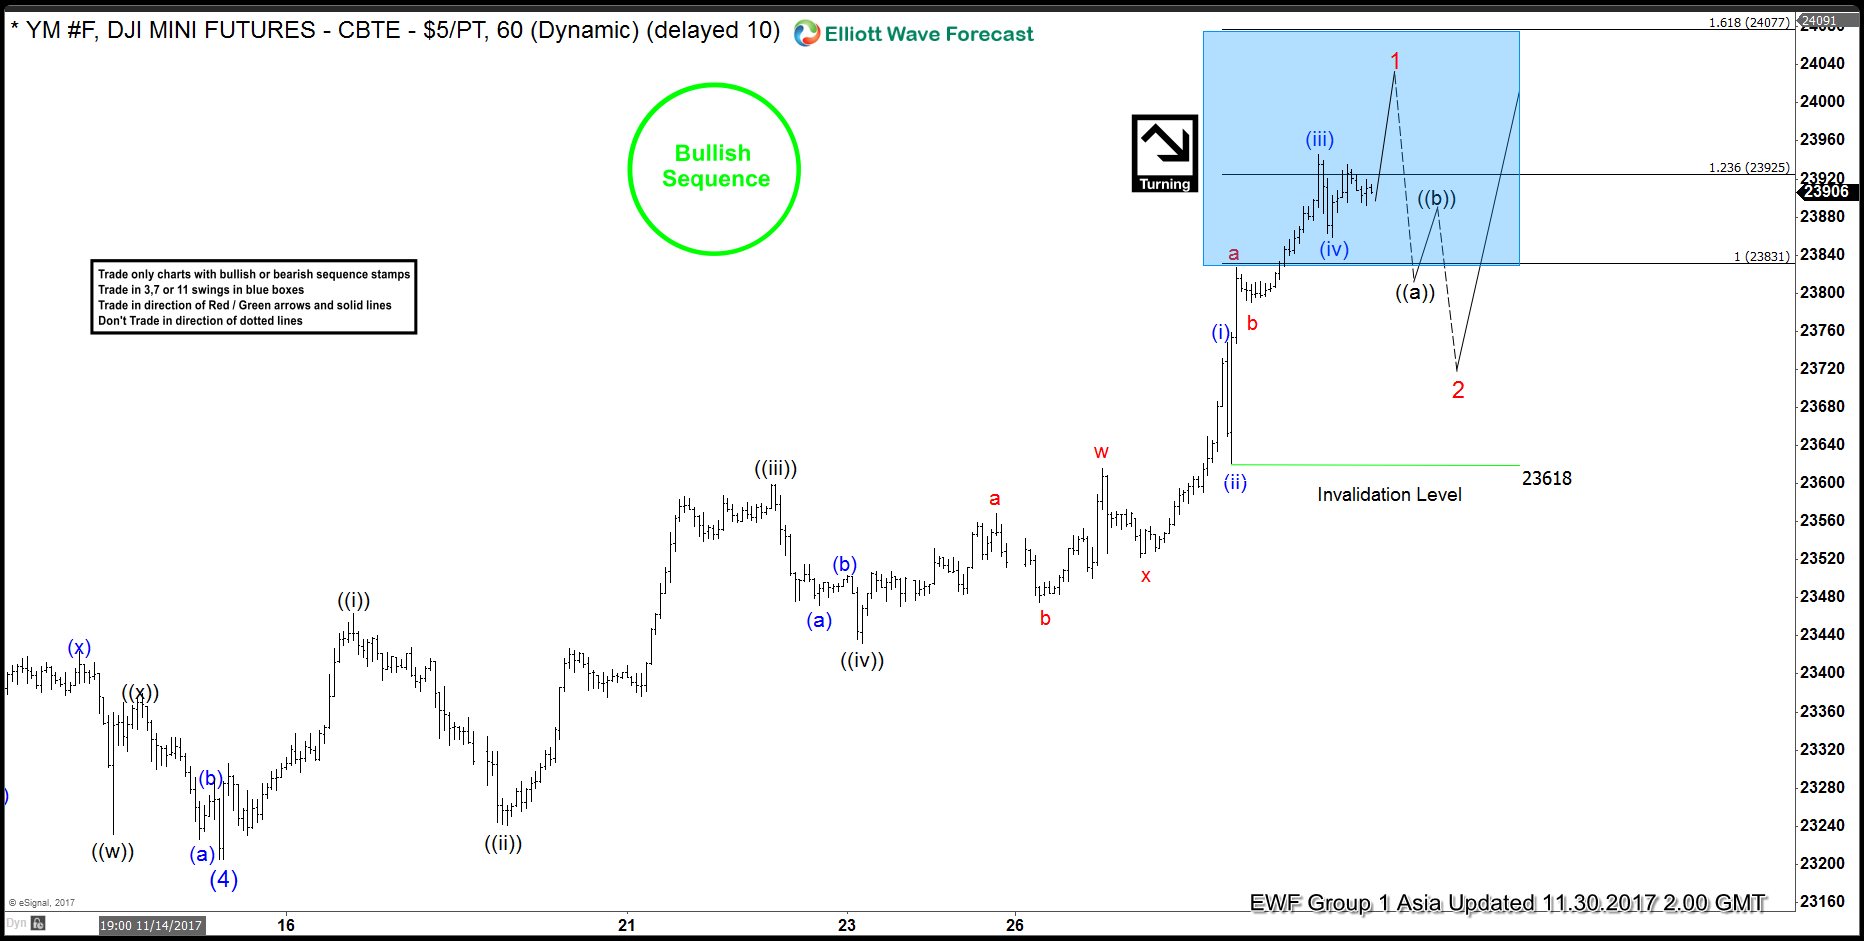
Dow Future Elliott Wave Analysis 11-30-2017
Read MoreDow Future Short term Elliott Wave view suggests that Intermediate wave (4) ended at 23204. The rally from there is proposed to be unfolding as a leading diagonal Elliott wave structure. Minute wave ((i)) ended at 23464, Minute wave ((ii)) ended at 23241, Minute wave ((iii)) ended at 23599 and Minute wave ((iv)) ended at 23572. Cycle from 11/15 low (23204) is mature […]
-
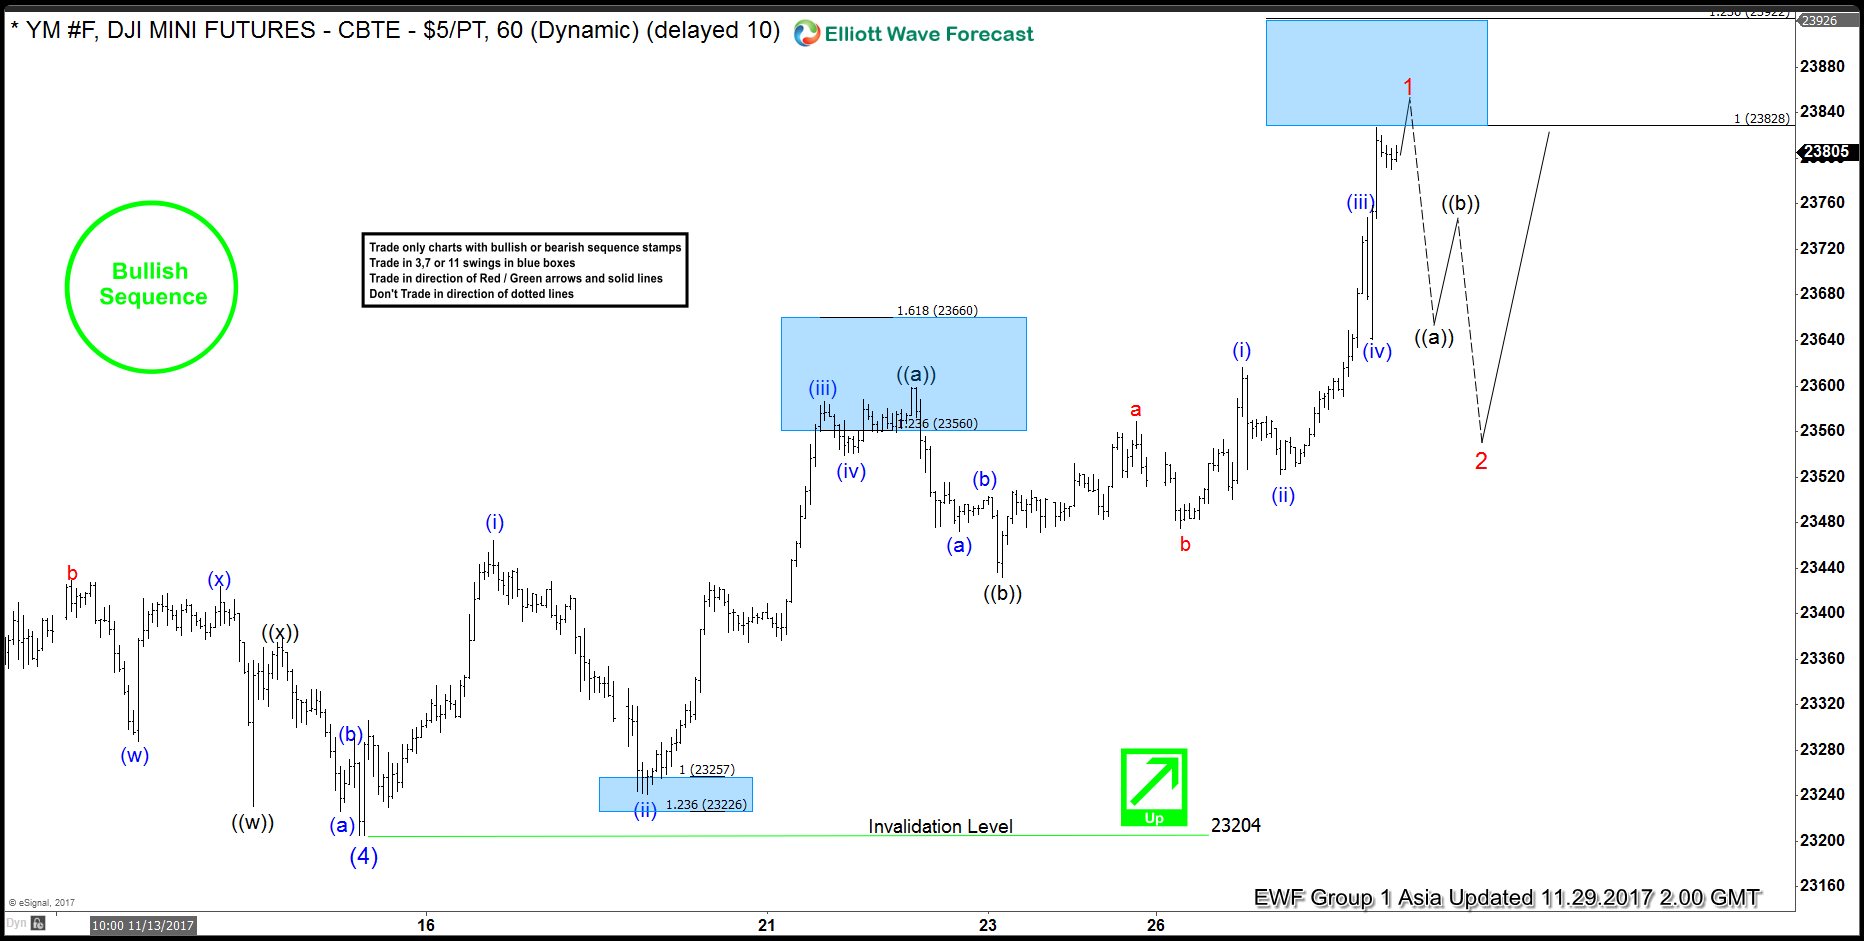
Dow Future Elliott Wave Analysis 11.29.2017
Read MoreDow Future Short term Elliott Wave view suggests that Intermediate wave (4) ended at 23204. The rally from there is proposed to be unfolding as a double three Elliott wave structure. Minute wave ((a)) of 1 ended at 23599 and Minute wave ((b)) of 1 ended at 23432. Near term focus is on 23828 – 23922 to complete Minute wave […]
-
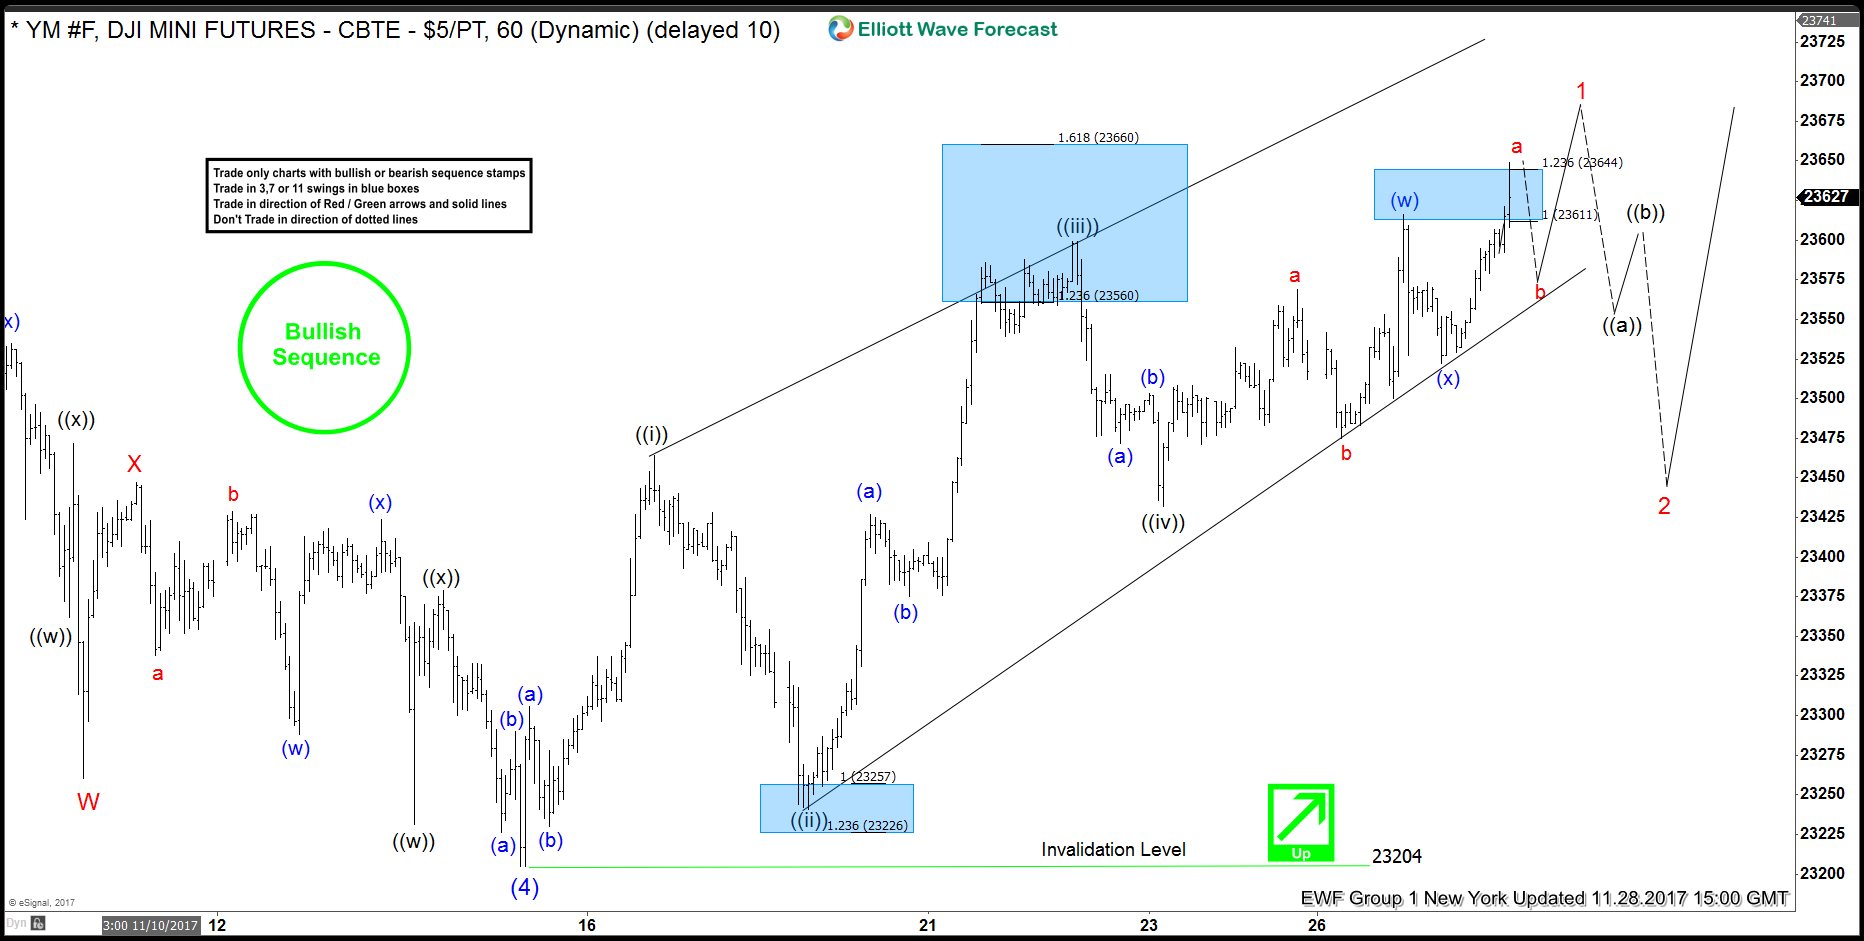
YM_F Dow Short Term Elliott Wave view
Read MoreYM_F Dow Short term Elliott Wave view suggests that Intermediate wave (4) ended at 23204. A rally from there is unfolding as a leading diagonal Elliott wave structure. Minute wave ((i)) ended at 23464, Minute wave ((ii)) ended at 23241, Minute wave ((iii)) ended at 23599, Minute wave ((iv)) ended at 23432, and Minute wave ((v)) remain in progress as a double three […]
-
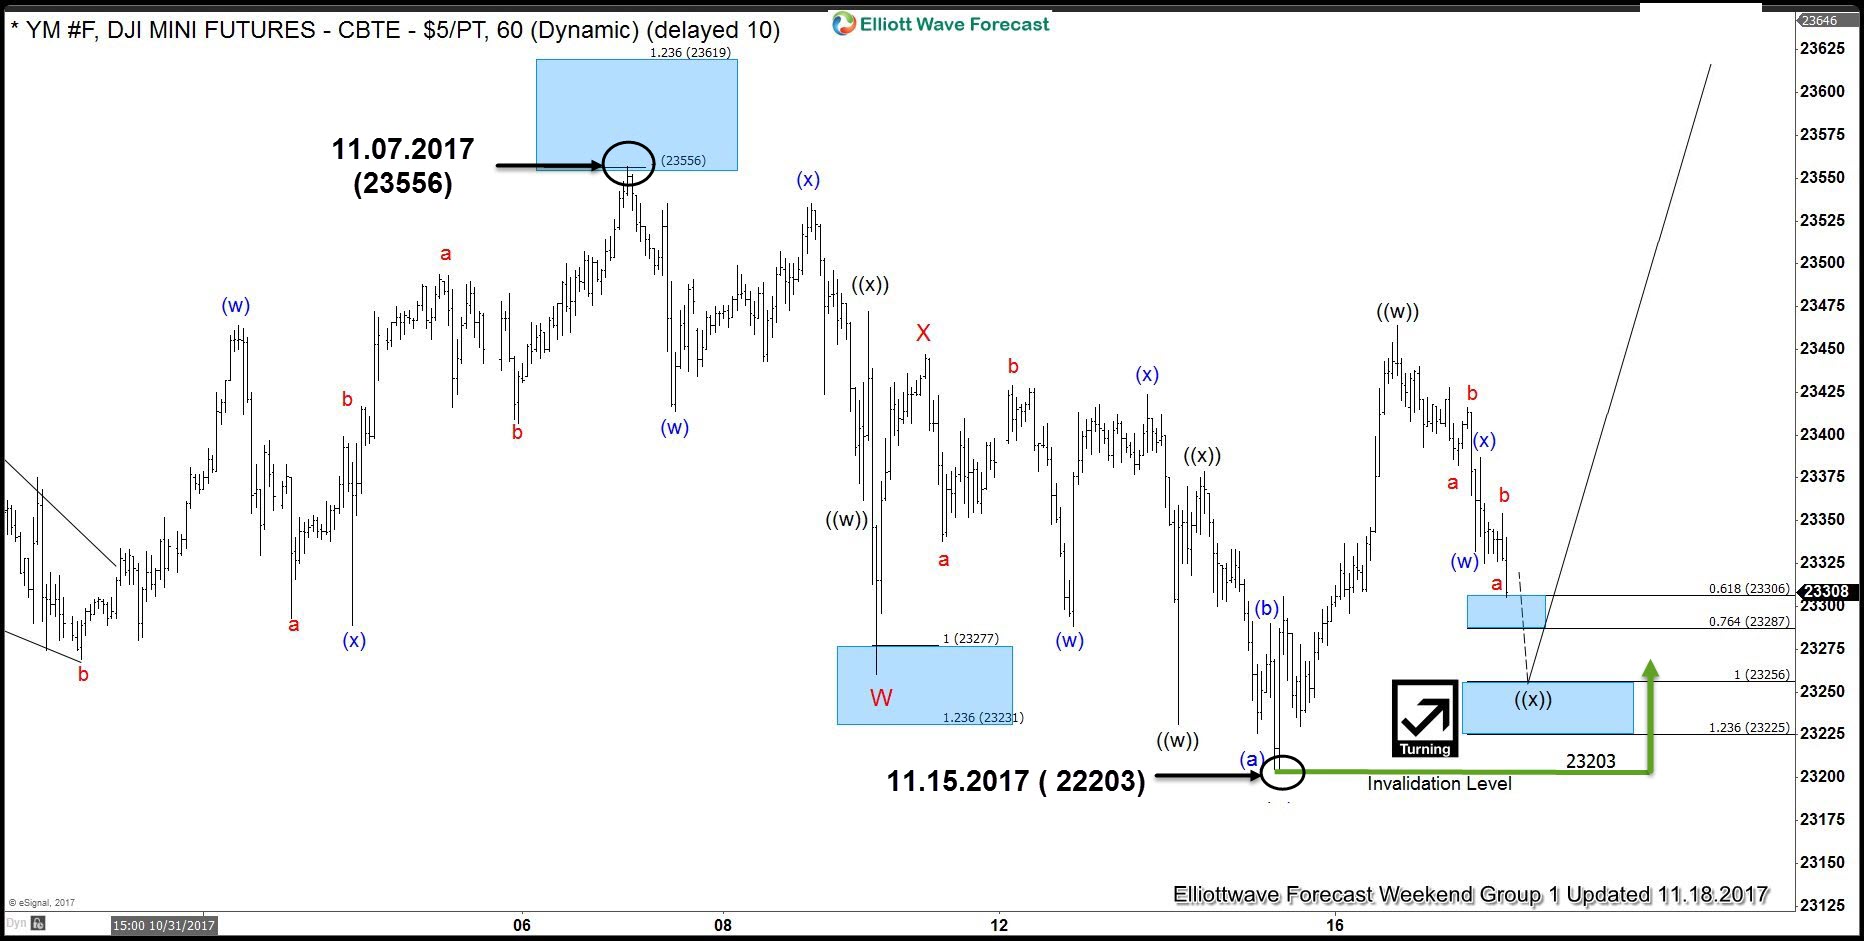
Dow Jones (YM #F) Made New All Time High
Read MoreIn this technical blog we’re going to take a quick look at the past Elliott Wave charts of YM #F (Dow Jones DJI Mini Futures) published in members area of www.elliottwave-forecast.com. We’re going to take a look at the price structure and explain Elliott Wave forecast. As our members know , we were pointing out that […]
-
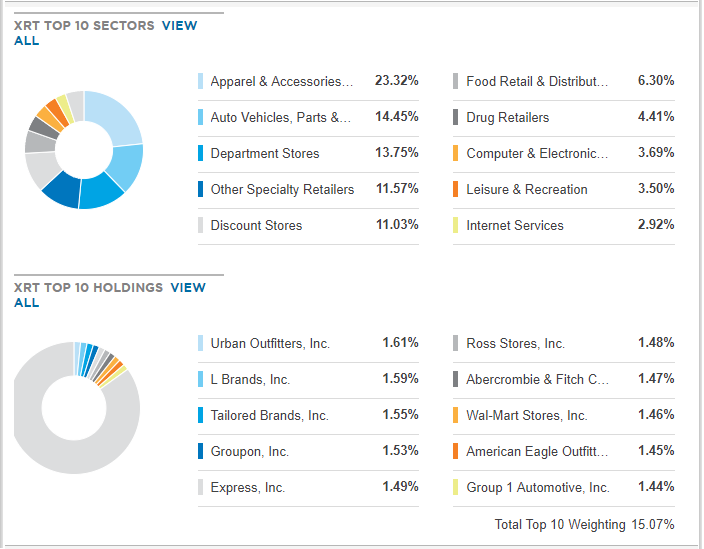
Retail Industry Index Providing The Next Long
Read MoreThe S&P Retail Industry Index comprises stocks in the S&P Total Market Index that are classified in the GICS retail sub-industry. For this article we’ll be using The SPDR S&P Retail ETF (XRT) which tracks an equal-weighted index of stocks in the US retail industry and correspond generally to the total return performance of the S&P Retail Select Industry Index. The performance […]
-
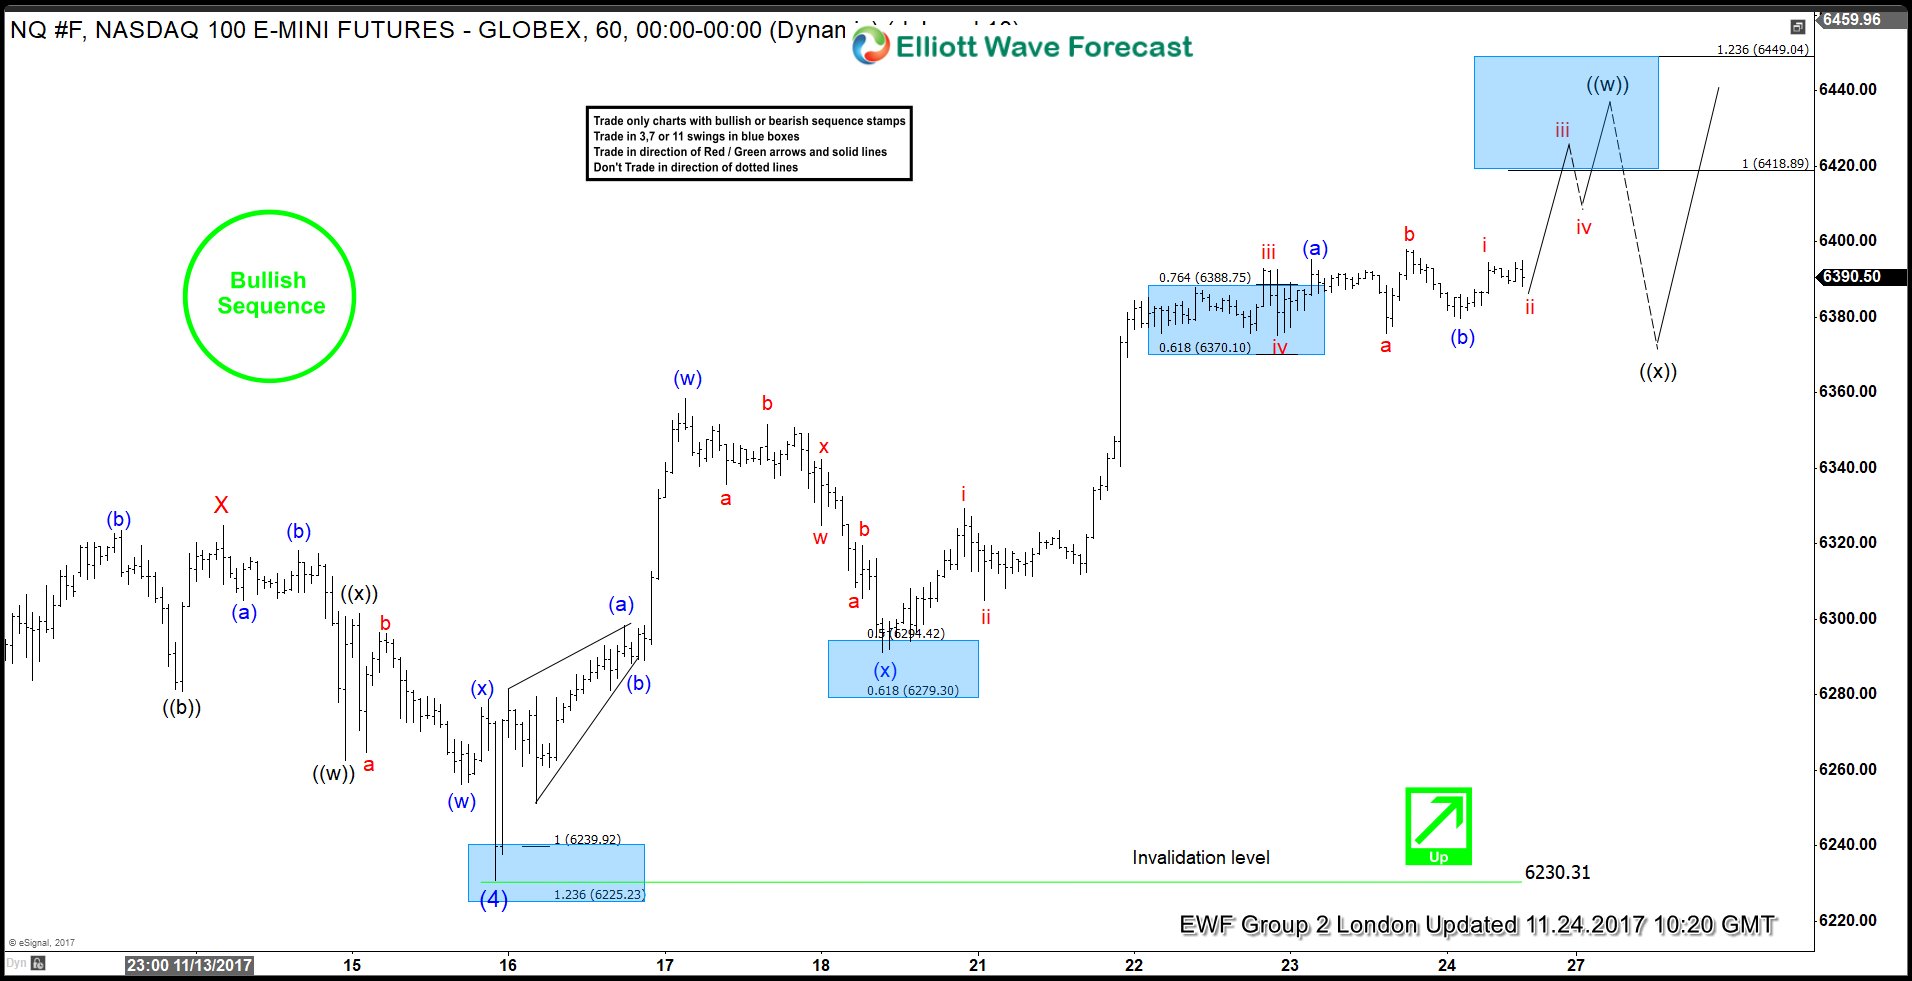
NASDAQ Elliott Wave view: 11.24.2017
Read MoreNASDAQ Short term Elliott Wave view suggests that the decline to 6230.31 on November 15 ended the intermediate wave (4) dip. A rally from there is unfolding as a double three Elliott wave structure and the index is already into new highs suggesting that next extension higher has started. As the structure of the 11/15 low 6230.31 low looks to be overlapping, […]