

The Power of 3-7-11 and the Grand Super Cycle: How We Saw the Bullish Turn in April 2025 Back on April 9, 2025, while World Indices were dropping sharply and global sentiment had turned overwhelmingly bearish, we published an article that challenged the fear-driven narrative. We explained why selling was not the right approach and […]
-
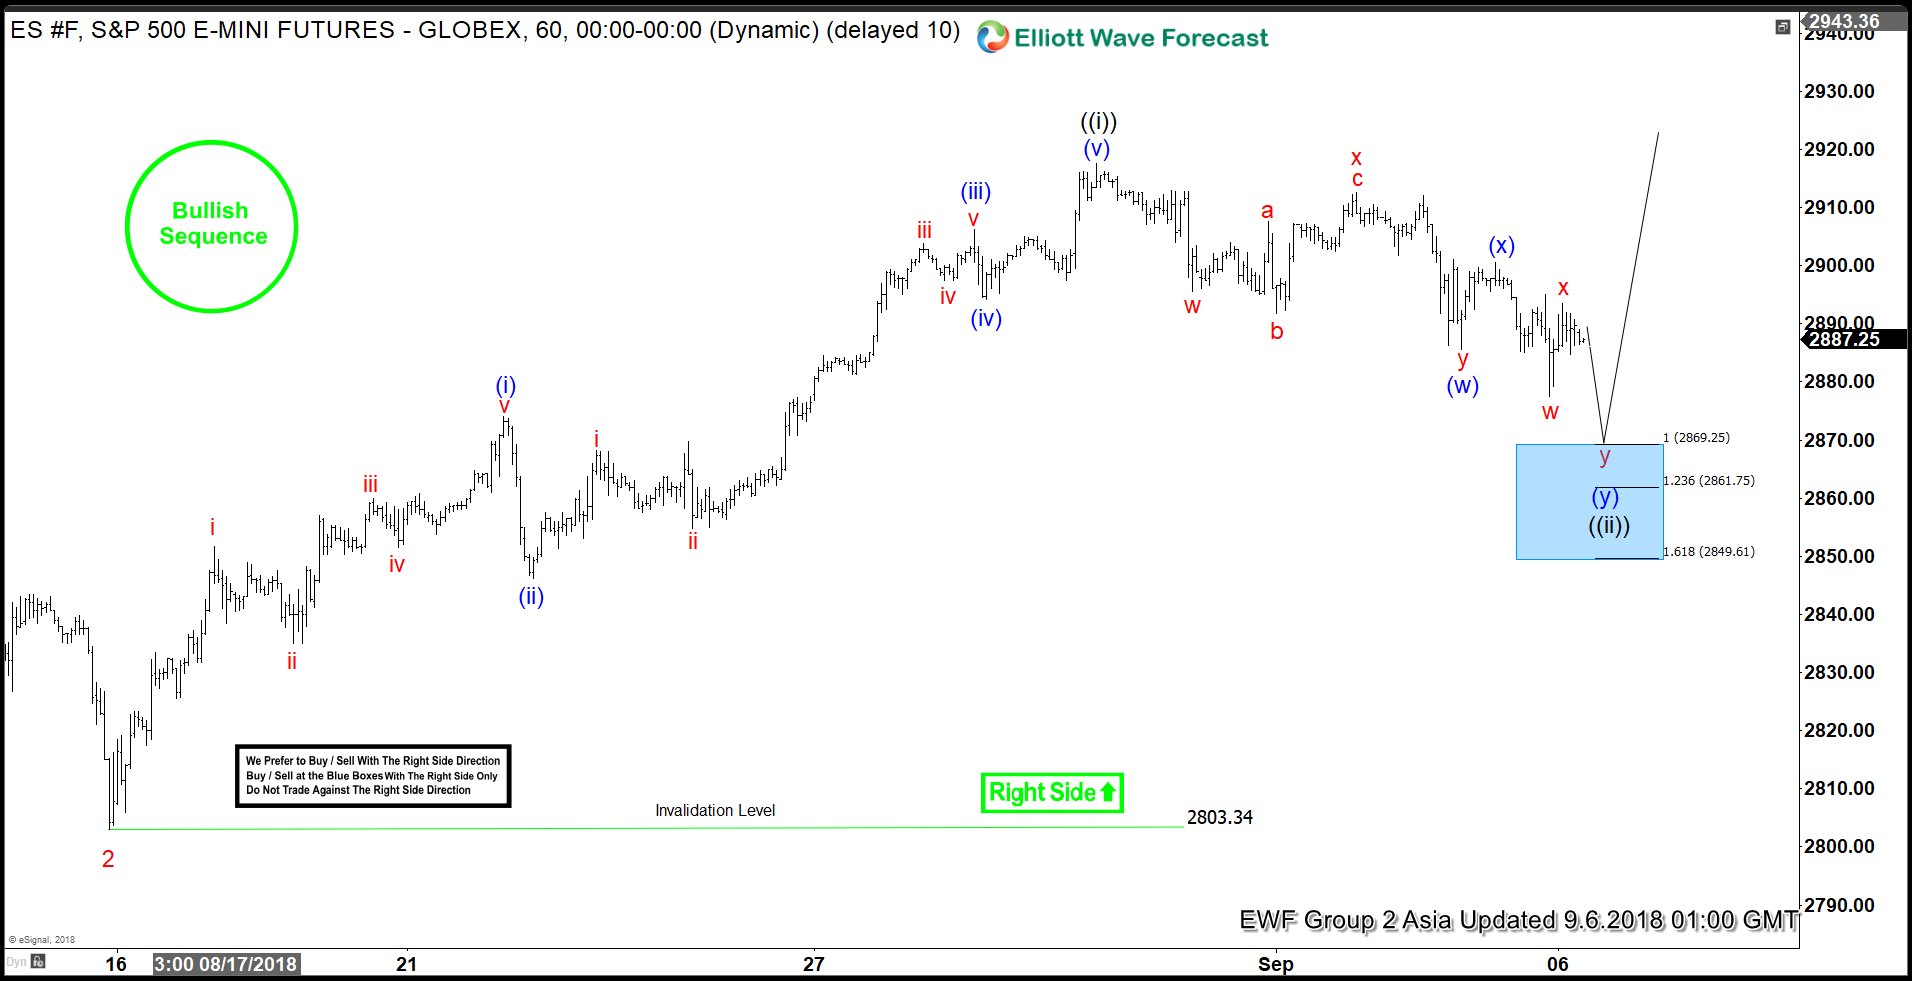
S&P500 E-Mini Futures Entering Buying Areas Soon?
Read MoreS&P500 E-Mini Futures ticker symbol: $ES_F Elliott wave view suggests that the pullback to $2803.34 low ended Minor wave 2. Up from there, the rally higher to $2917.50 high ended Minute wave ((i)). The internals of that rally higher unfolded as impulse structure with the sub-division of 5 waves structure in it’s each leg higher […]
-
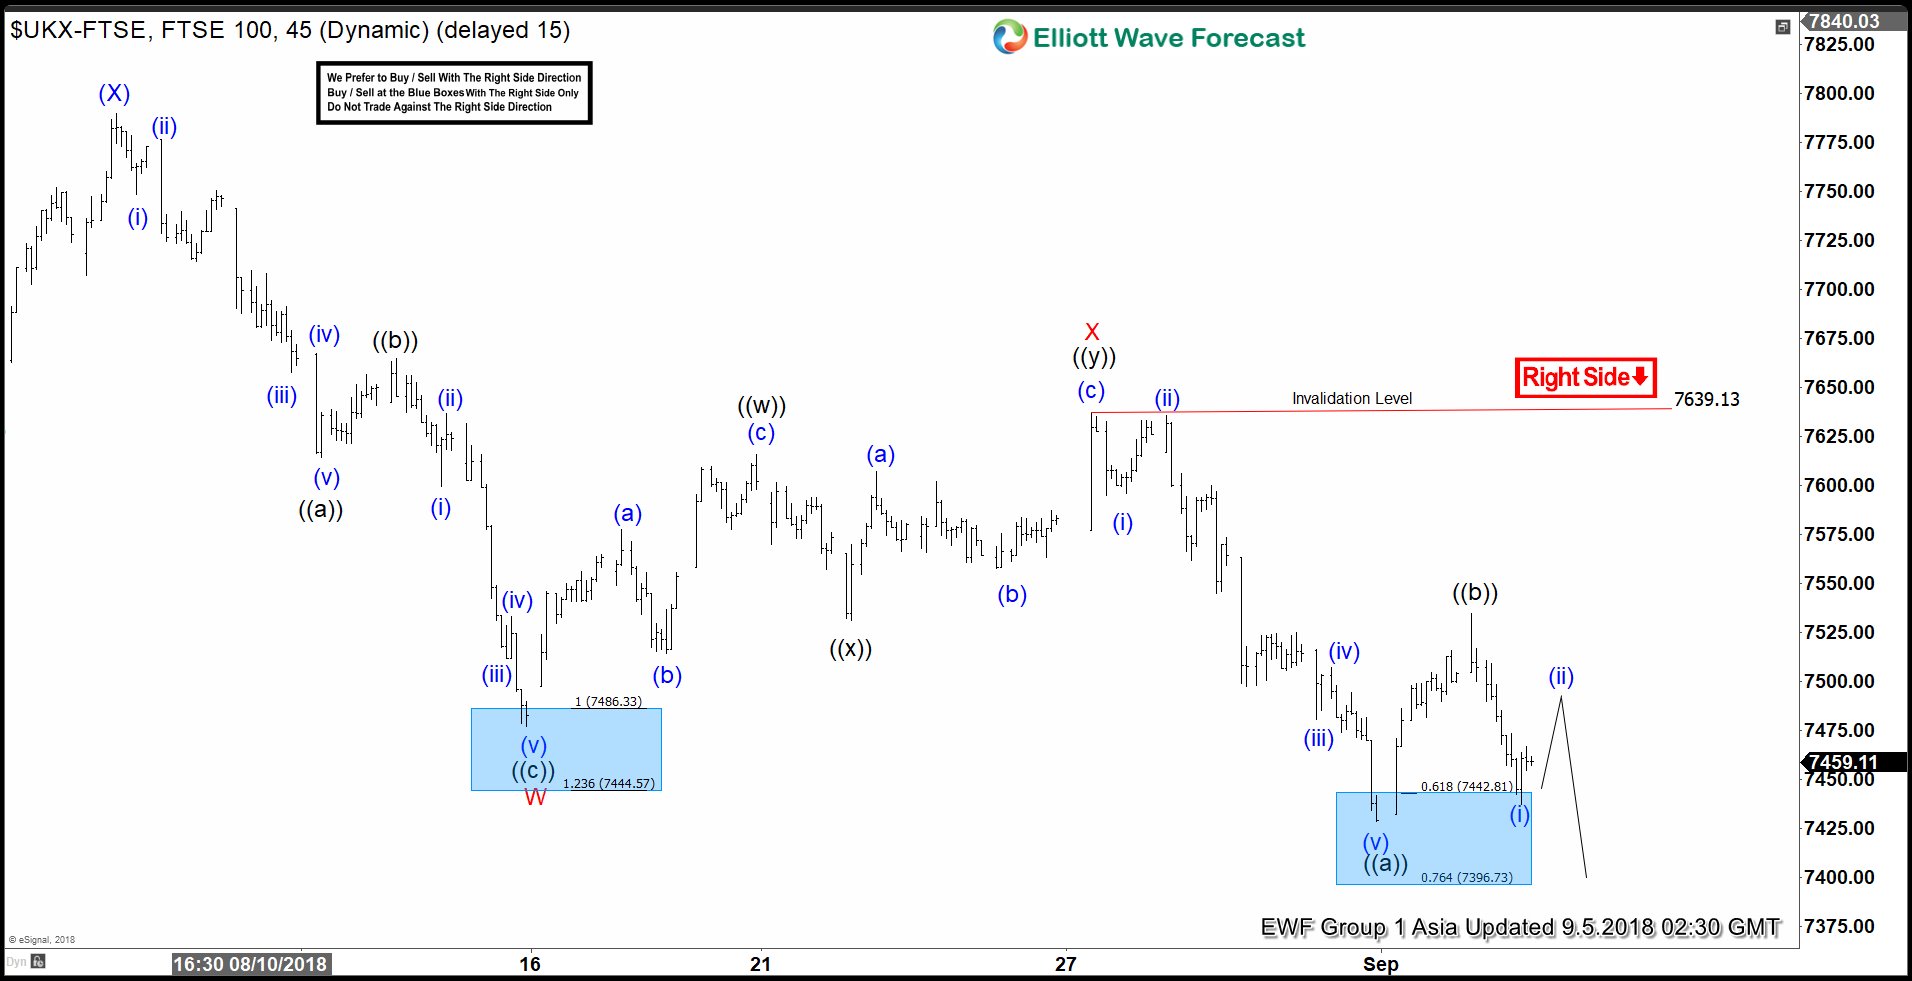
FTSE Elliott Wave Analysis: Started 7th Swing Lower
Read MoreFTSE short-term Elliott Wave view suggests that the rally to 7790.17 high ended intermediate wave (X) bounce. Down from there, intermediate wave (Y) remains in progress with instrument showing a lower low sequence. The internals of that leg lower is taking place as double correction lower due to overlapping price action happening from 7790.17 high […]
-
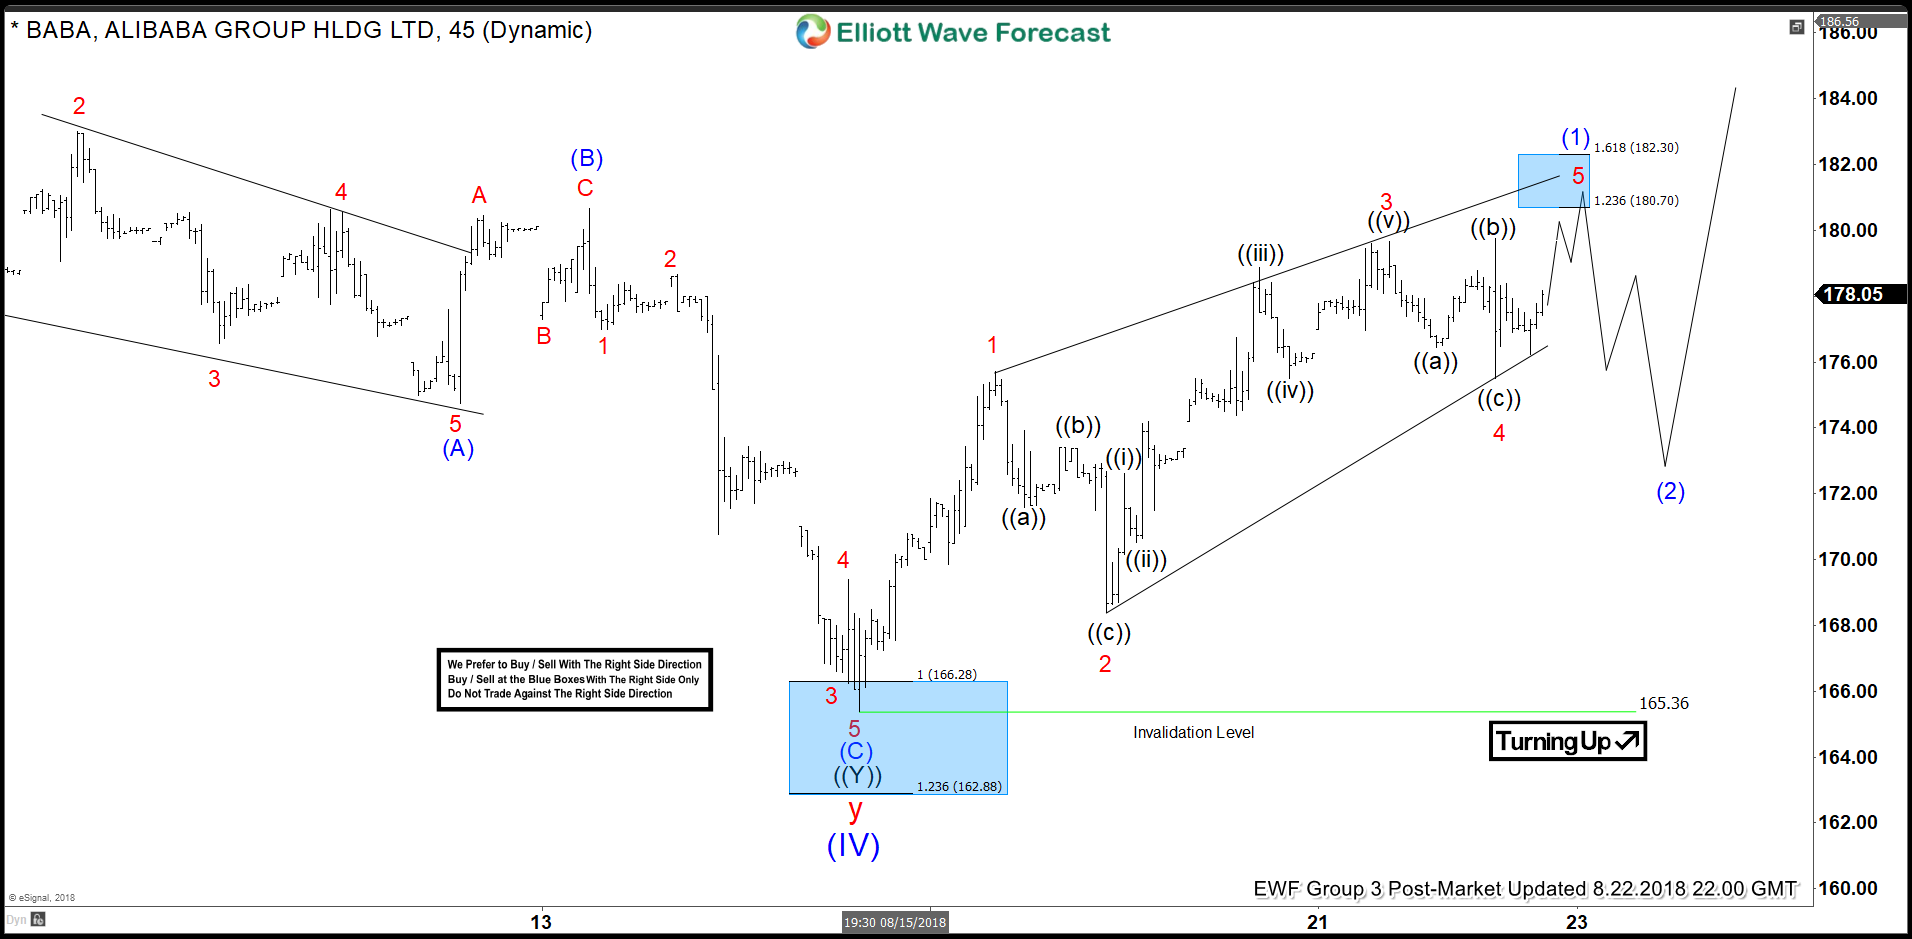
BABA Elliott Wave View: Found Buyers in Blue Box and Rallied
Read MoreIn this blog, we will have a look at some recent short-term Elliott Wave charts of BABA which we presented to our members in the past. Below, you see the 1-hour updated chart presented to our clients on the 08/19/18 indicating that BABA ended the cycle from 06/05 low in blue wave (IV). BABA ended the long-term […]
-
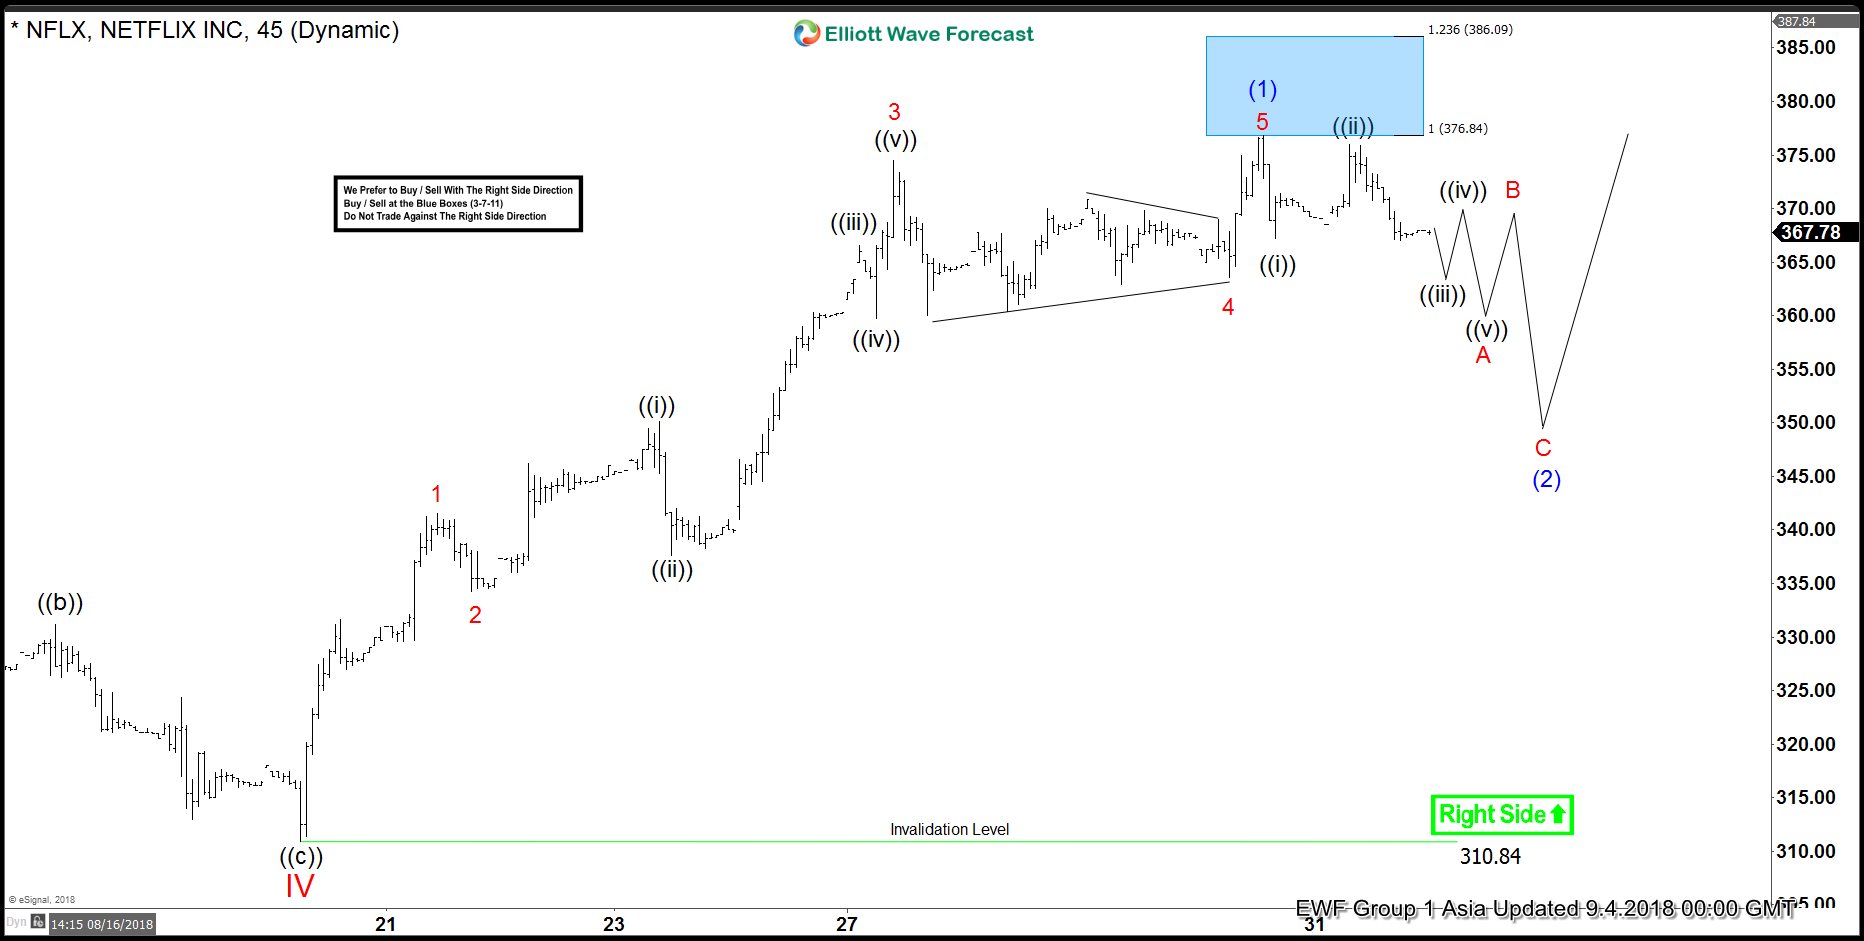
Netflix Elliott Wave View: Pullbacks Should Remain Supported
Read MoreNetflix ticker symbol: $NFLX short-term Elliott wave view suggests that the decline to $310.84 low ended cycle degree wave “IV” pullback. Up from there, cycle degree wave “V” can have started but a break above $423.21 6/21/2018 high remains to be seen for final confirmation. Above from $310.84 low, the rally higher $376.81 high ended […]
-
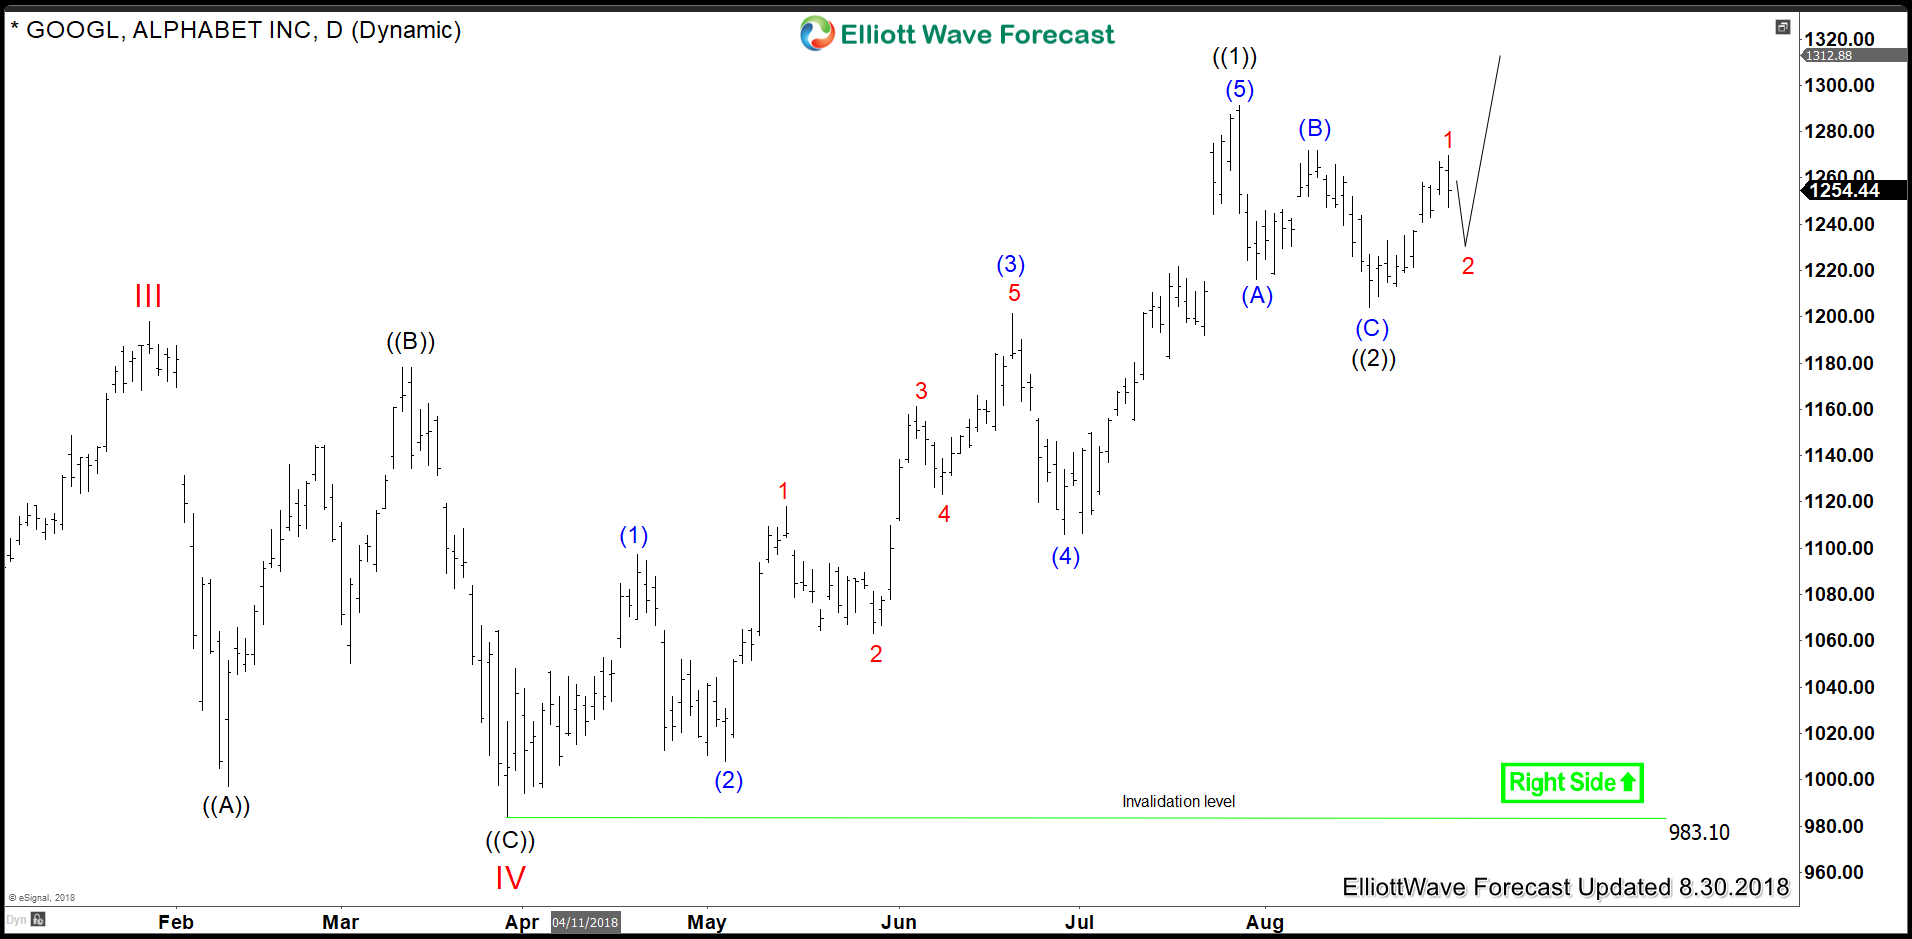
Google (NASDAQ: GOOGL) Elliott Wave View: Further Upside Expected
Read MoreGoogle (NASDAQ: GOOGL) super bullish cycle since 2009 low is still in progress and in this article we’ll be taking a look at the daily chart using the Elliott Wave Theory. Google rallied in an impulsive 5 waves structure since March 2018 low $983 and managed to make new all time highs which technically can be […]
-
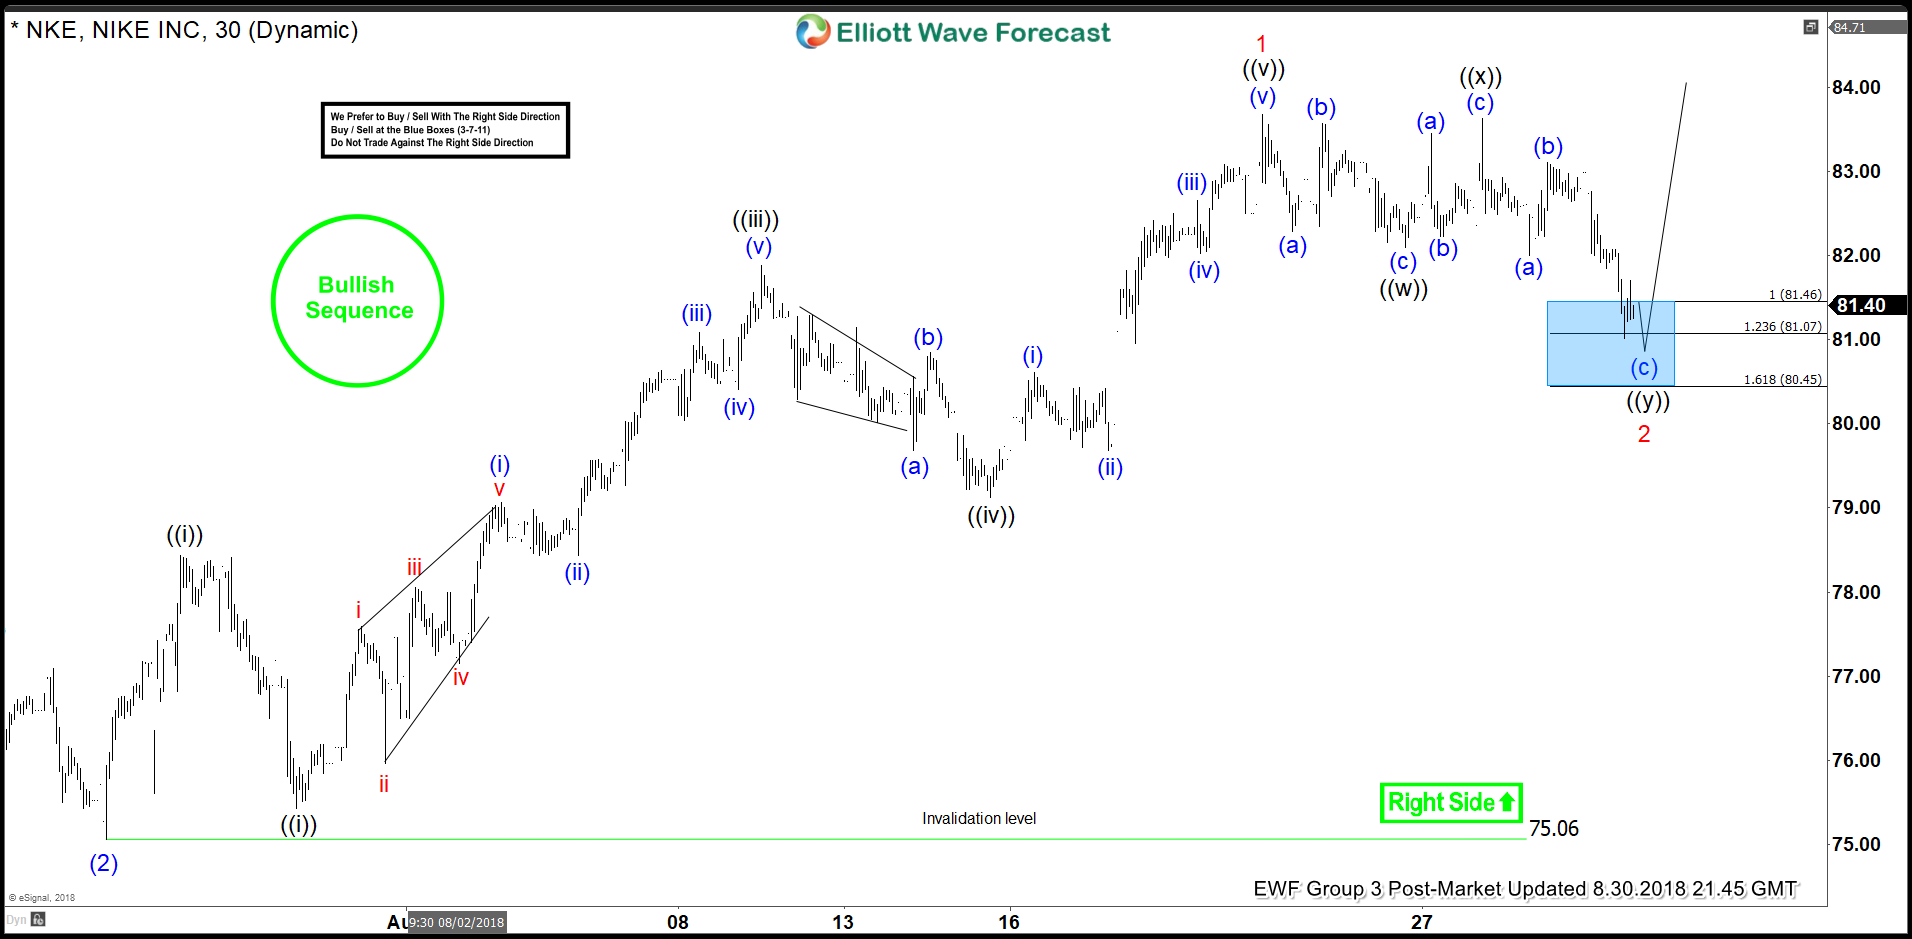
Nike Providing Buying Opportunity Soon?
Read MoreNike ticker symbol: $NKE short-term Elliott wave view suggests that the decline to $75.06 low ended intermediate wave (2). Above from there, the stock has rallied to new all-time highs confirming the next extension higher in intermediate wave (3) higher. The internals of intermediate wave (3) is unfolding as Elliott wave impulse structure with the […]