

The Power of 3-7-11 and the Grand Super Cycle: How We Saw the Bullish Turn in April 2025 Back on April 9, 2025, while World Indices were dropping sharply and global sentiment had turned overwhelmingly bearish, we published an article that challenged the fear-driven narrative. We explained why selling was not the right approach and […]
-
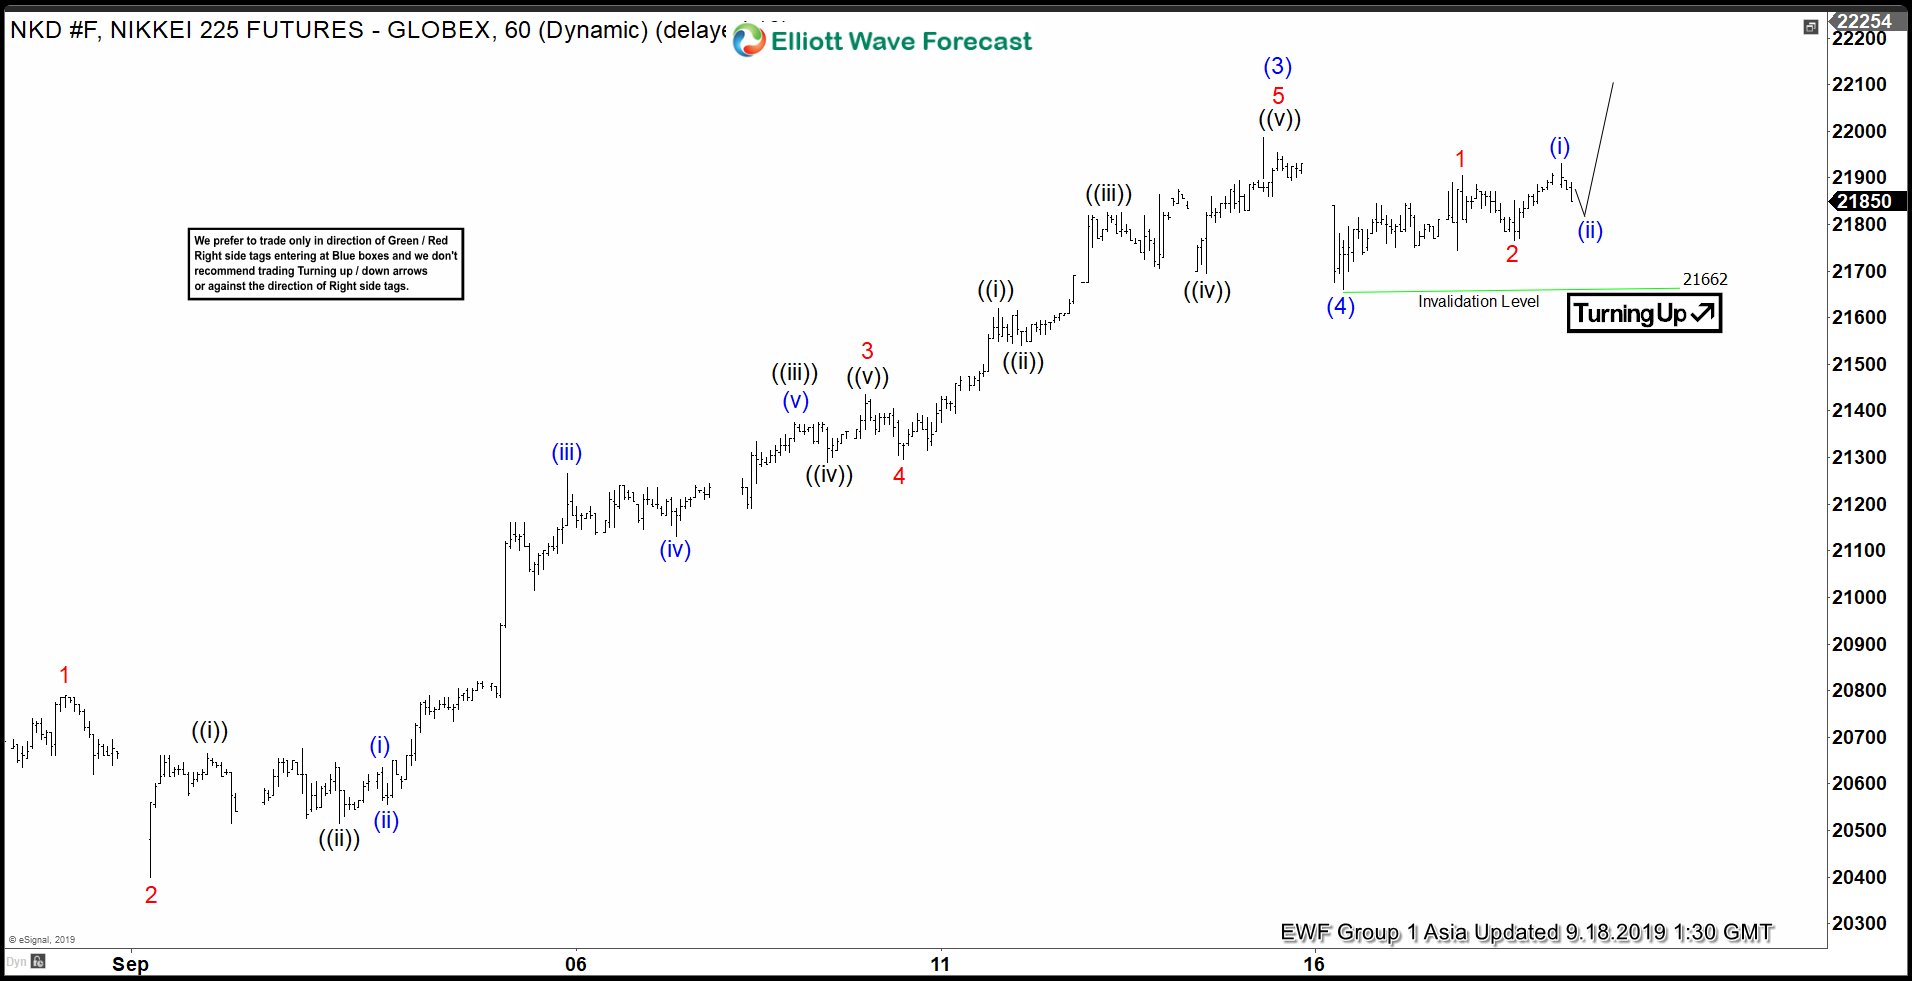
Elliott Wave View: Impulsive Rally in Nikkei
Read MoreElliott Wave view suggests the rally in Nikkei from August 26, 2019 low is unfolding as an impulse Elliott Wave structure. In the 1 hour chart below, the rally to 21890 on September 13, 2019 ended wave (3) and wave (4) pullback ended at 21662. Internal of wave (3) unfolded as an impulse in lesser […]
-

General Motors Will Provide Buying Opportunity Despite The Strike
Read MoreGeneral Motor’s contract with the United Auto Workers expired late Saturday, leaving the union and company leadership to work out the next four-year contract. The situation has been all over the news which can be misleading for traders. We at Elliottwave Forecast do not follow fundamentals news but what we follow is a system which […]
-
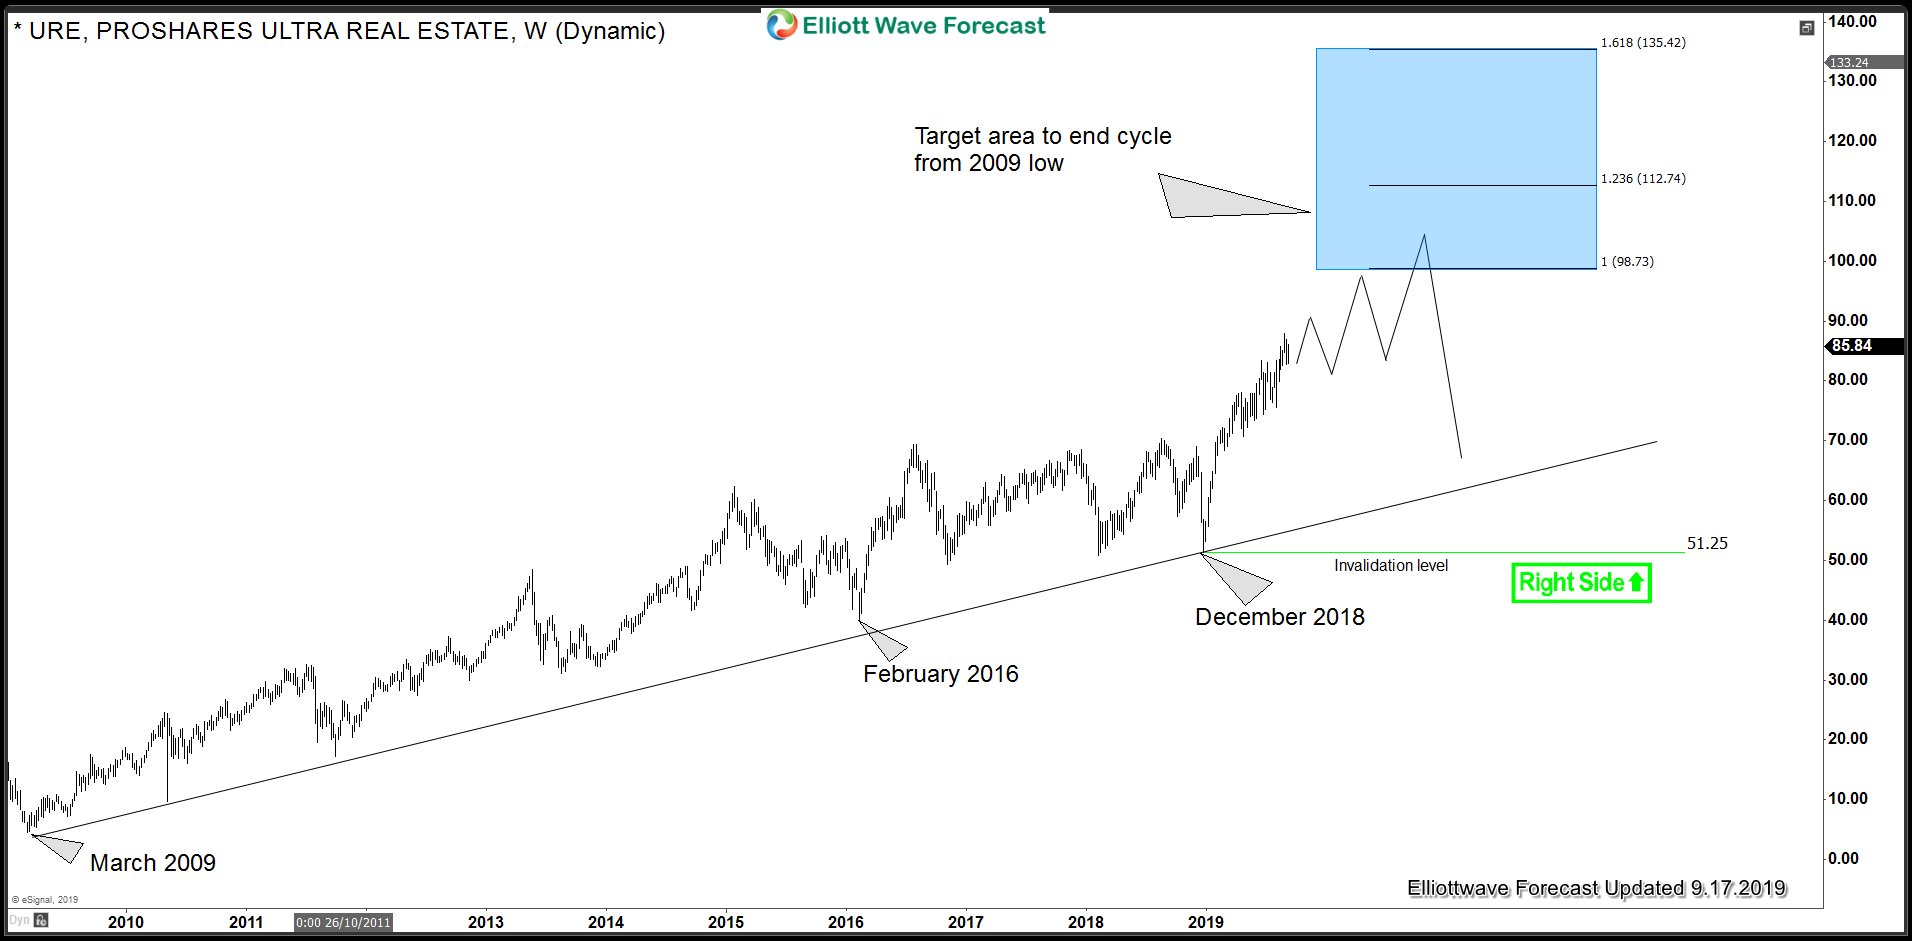
DJUSRE Break Above 2007 High and ProShares Ultra Real Estate ETF
Read MoreDJUSRE (Dow Jones Real Estate Index) recently broke above 2007 peak and it would be a good time to revisit the article we published back in 2017 about Real Estate Index and highlighted the target area above 2007 peak. We will also cover Proshares Ultra Real Estate ETF today and look at it’s sequence from […]
-
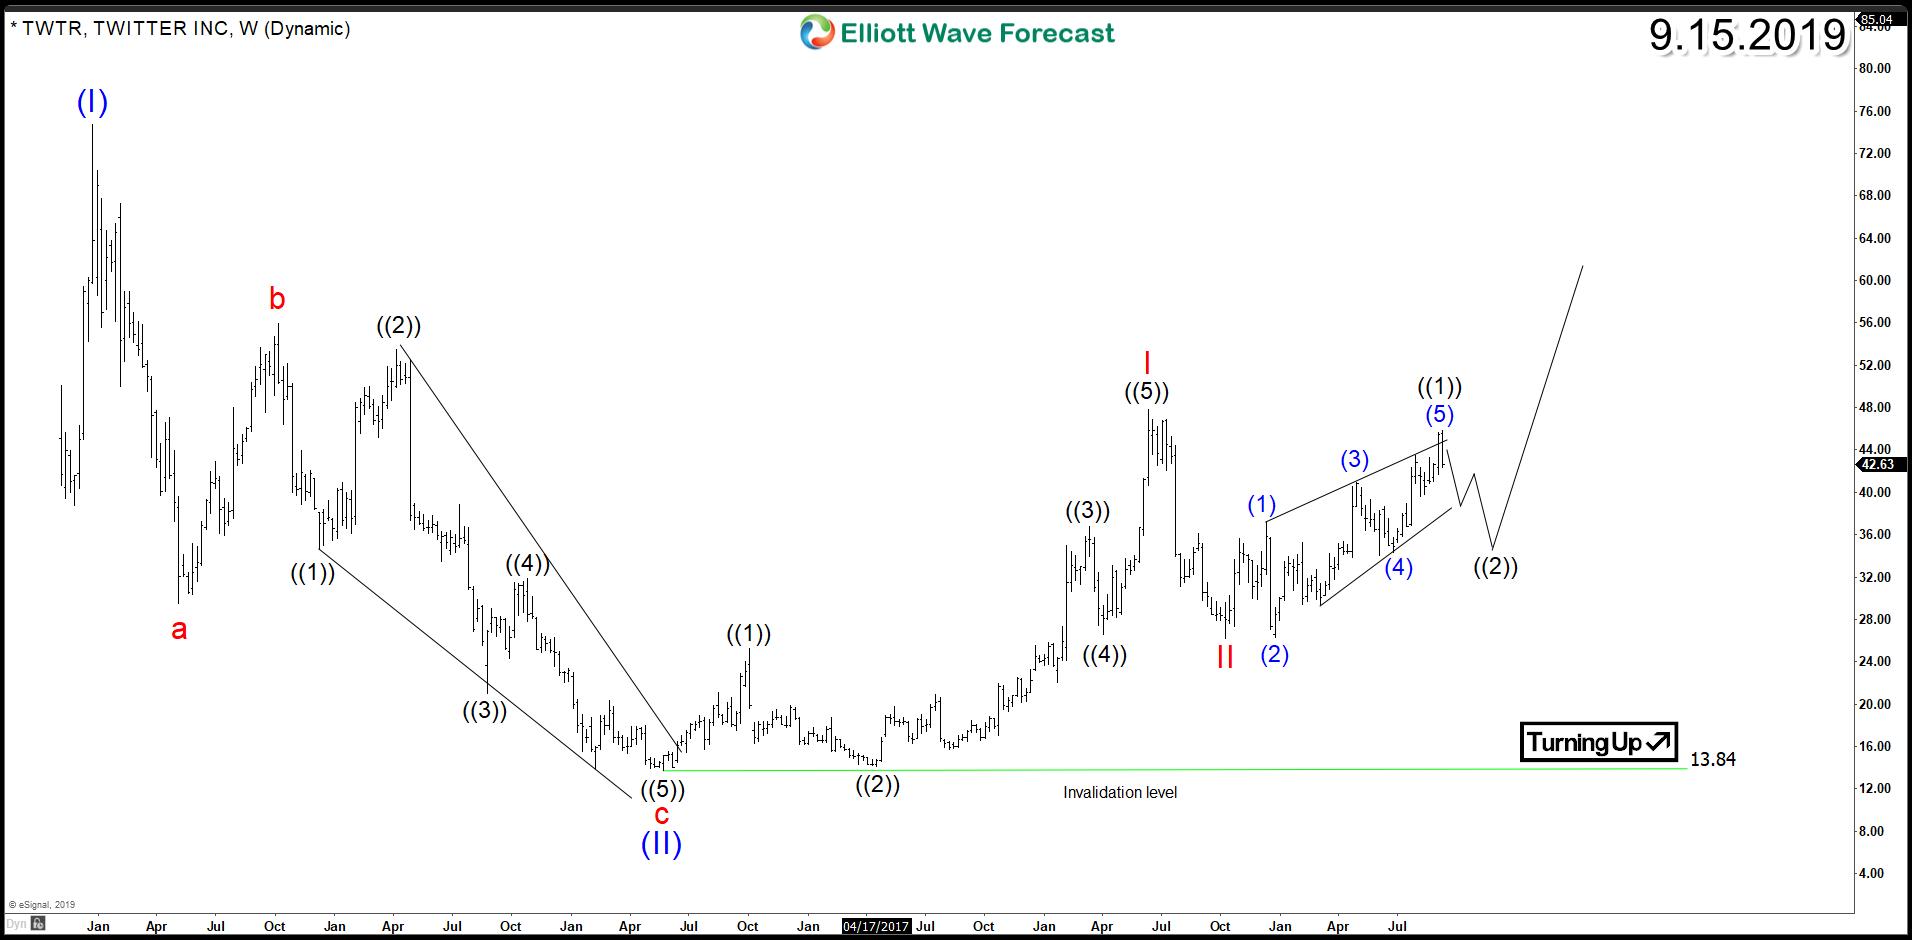
Twitter (NYSE: TWTR) Impulsive Elliott Wave Structure
Read MoreThe social networking giant Twitter (NYSE:TWTR) has become the number one platform for government leaders and it’s still considered one of the best places for breaking news. For the first time in the company’s history, Twitter made a profit in the fourth quarter of the 2017 just one year after its stock established a major bottom. […]
-
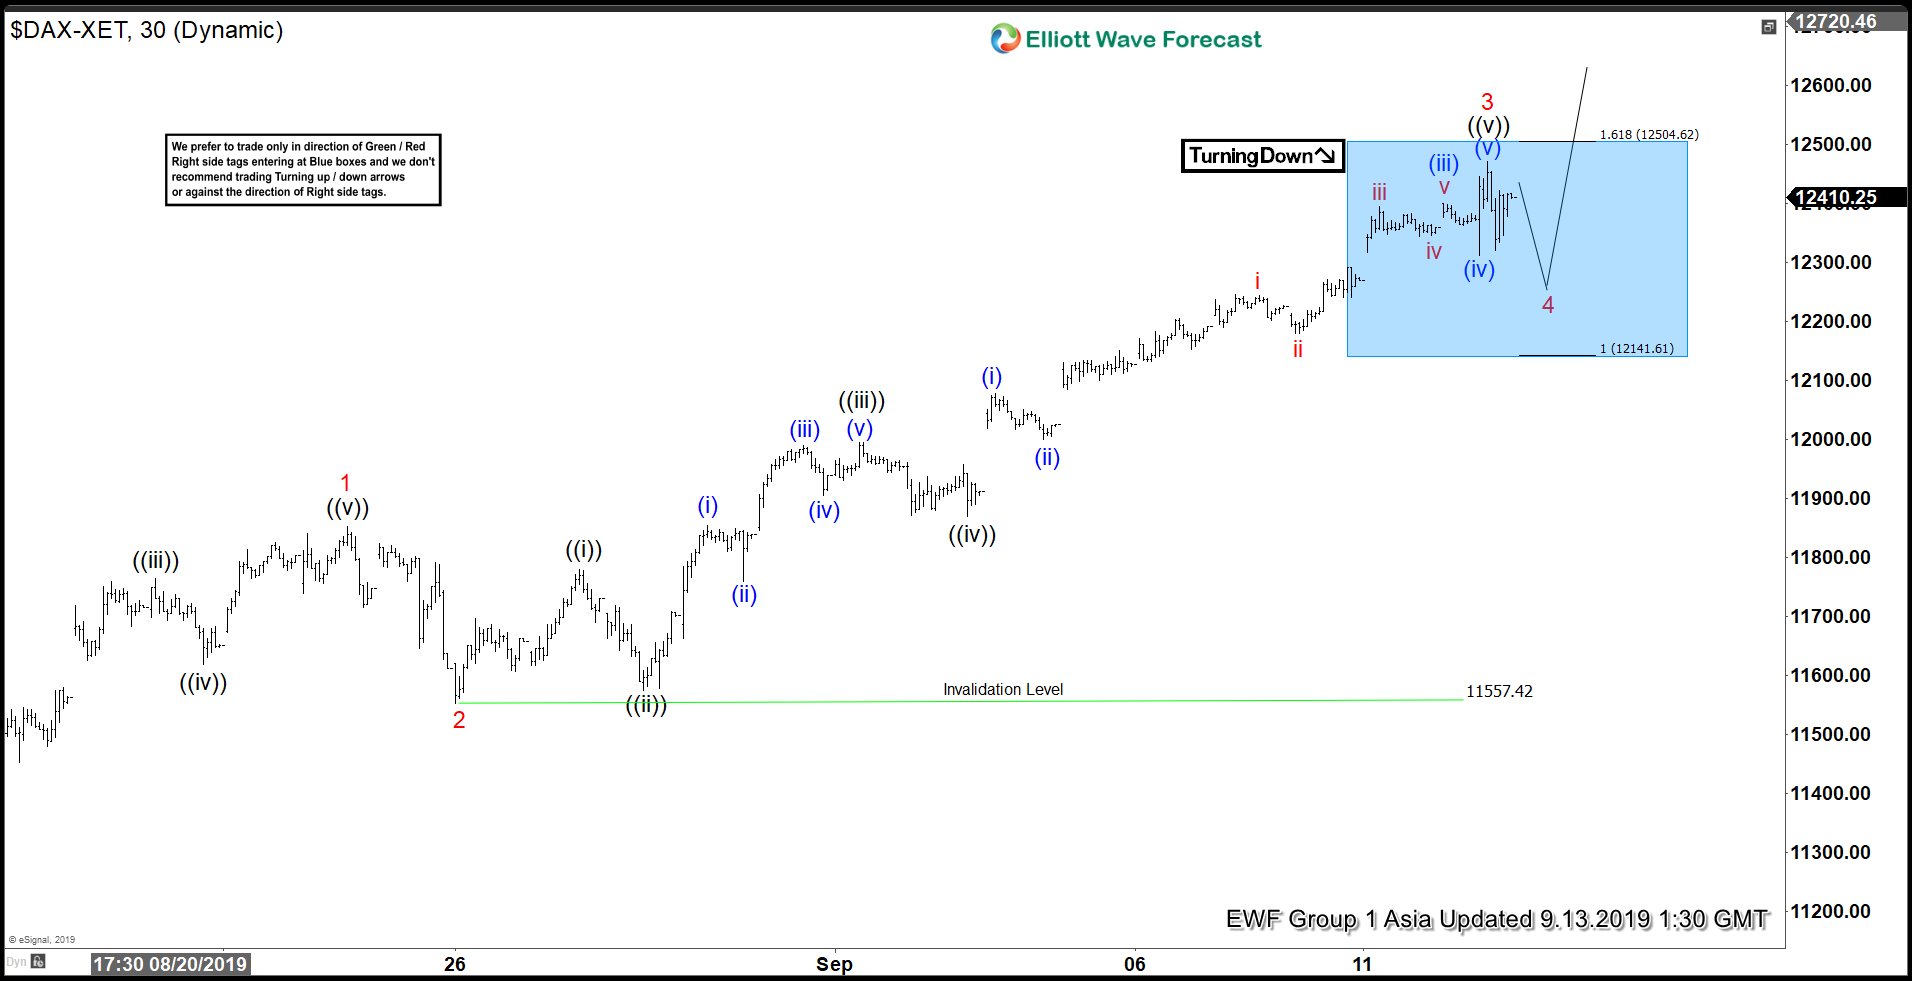
Elliott Wave View: DAX Extends Higher in Impulsive Structure
Read MoreDAX rally from August 15 low is unfolding as an impulse Elliott Wave structure. This article talks about the short term Elliott Wave path.
-
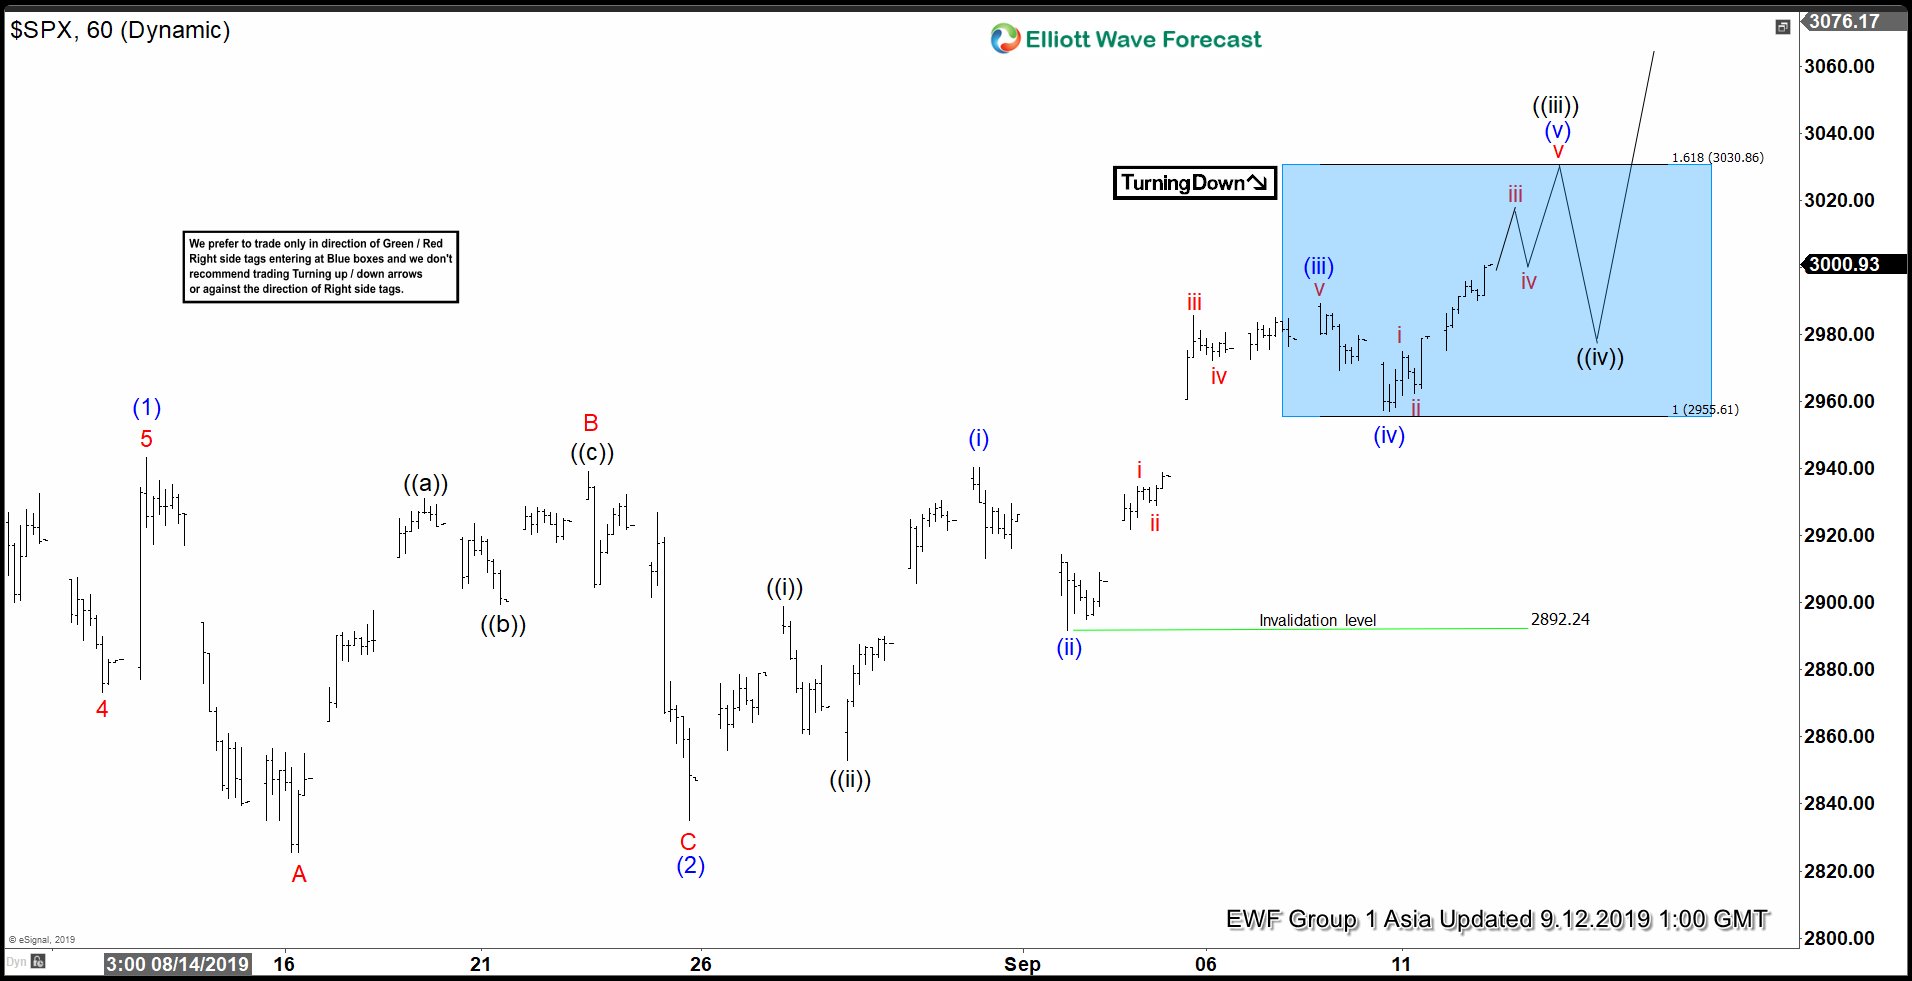
Elliott Wave View: S&P 500 (SPX) New All-Time High Imminent
Read MoreShort term Elliott Wave view suggests the rally in S&P 500 (SPX) from August 6, 2019 low is unfolding as an impulse Elliott Wave structure. In the chart below, we can see wave (1) ended at 2943.31 and wave (2) pullback ended at 2834.97. Internal subdivision of wave (2) unfolded as a running Flat. Wave A […]