

The Power of 3-7-11 and the Grand Super Cycle: How We Saw the Bullish Turn in April 2025 Back on April 9, 2025, while World Indices were dropping sharply and global sentiment had turned overwhelmingly bearish, we published an article that challenged the fear-driven narrative. We explained why selling was not the right approach and […]
-
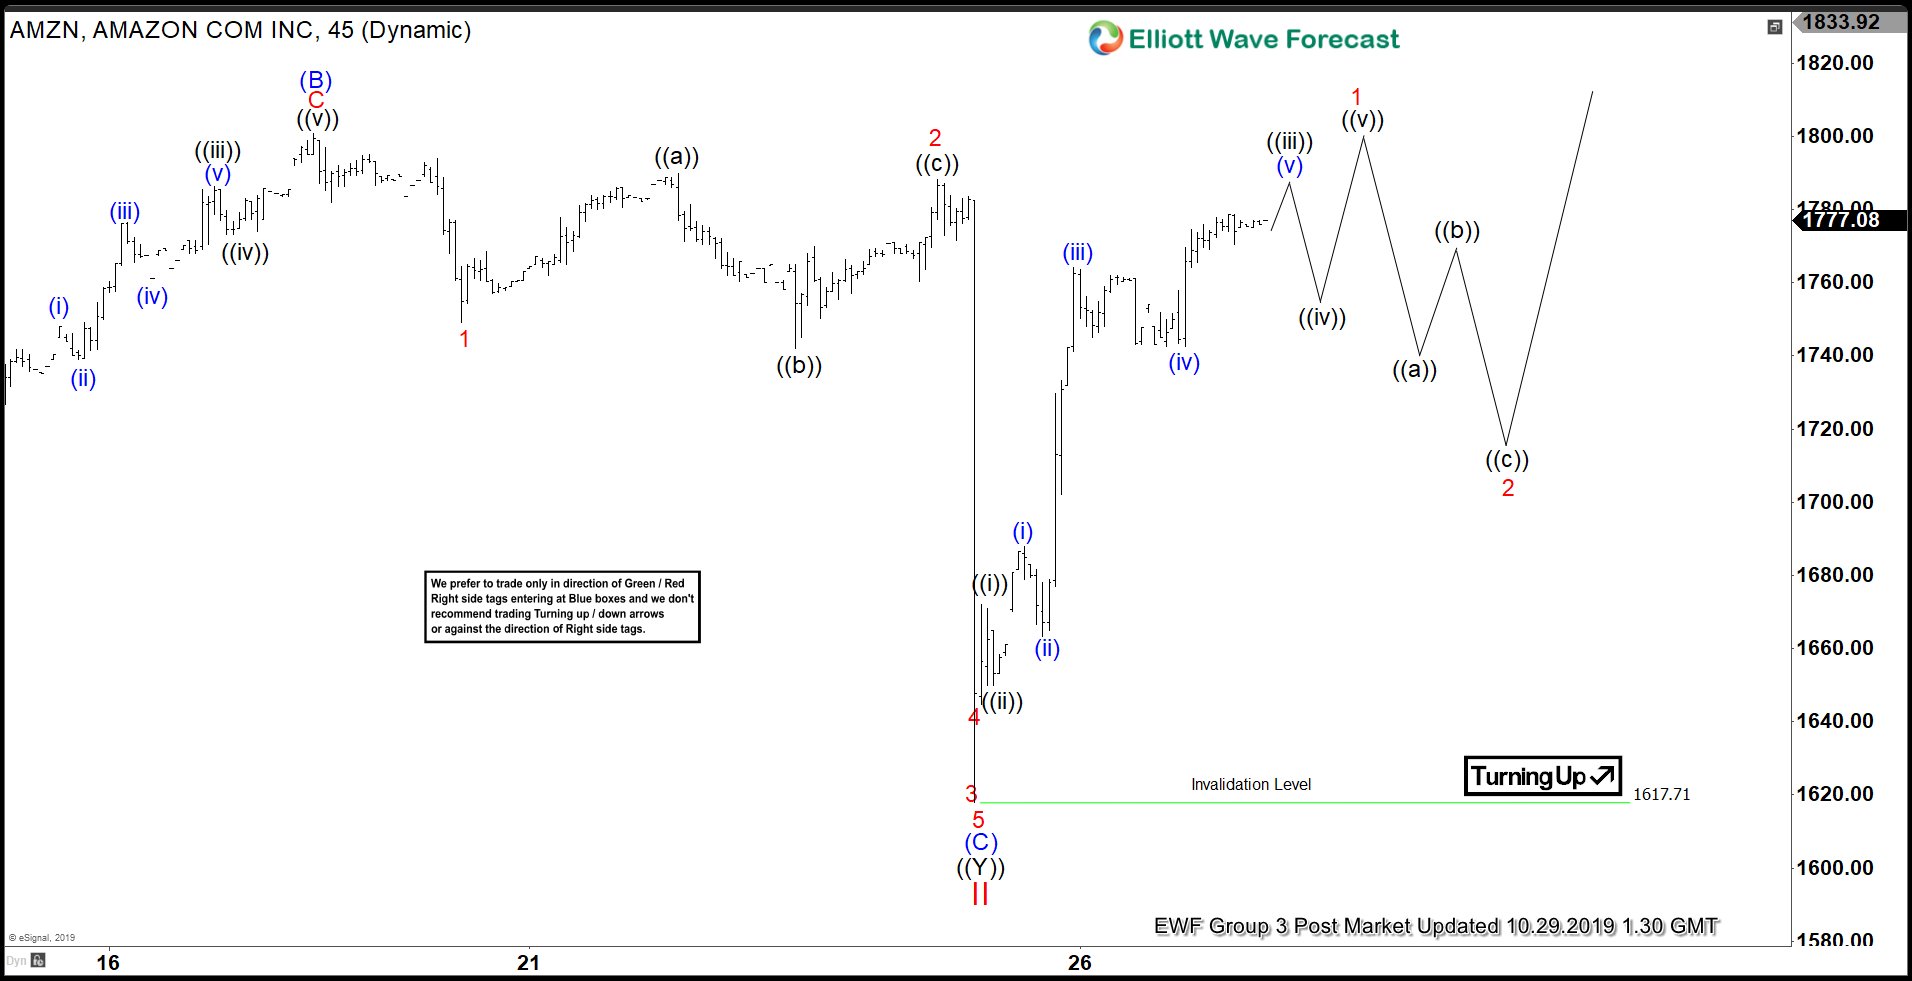
Elliott Wave View: Amazon Shares Price Recovers
Read MoreAmazon (ticker: AMZN) shares price has recovered most of the losses due to the weak earnings. Short Term Elliott Wave view suggests the drop to $1617.71 ended wave II. This drop has ended the entire correction which started from July 11, 2019 high. The stock has started to rally and the move higher from $1617.71 […]
-
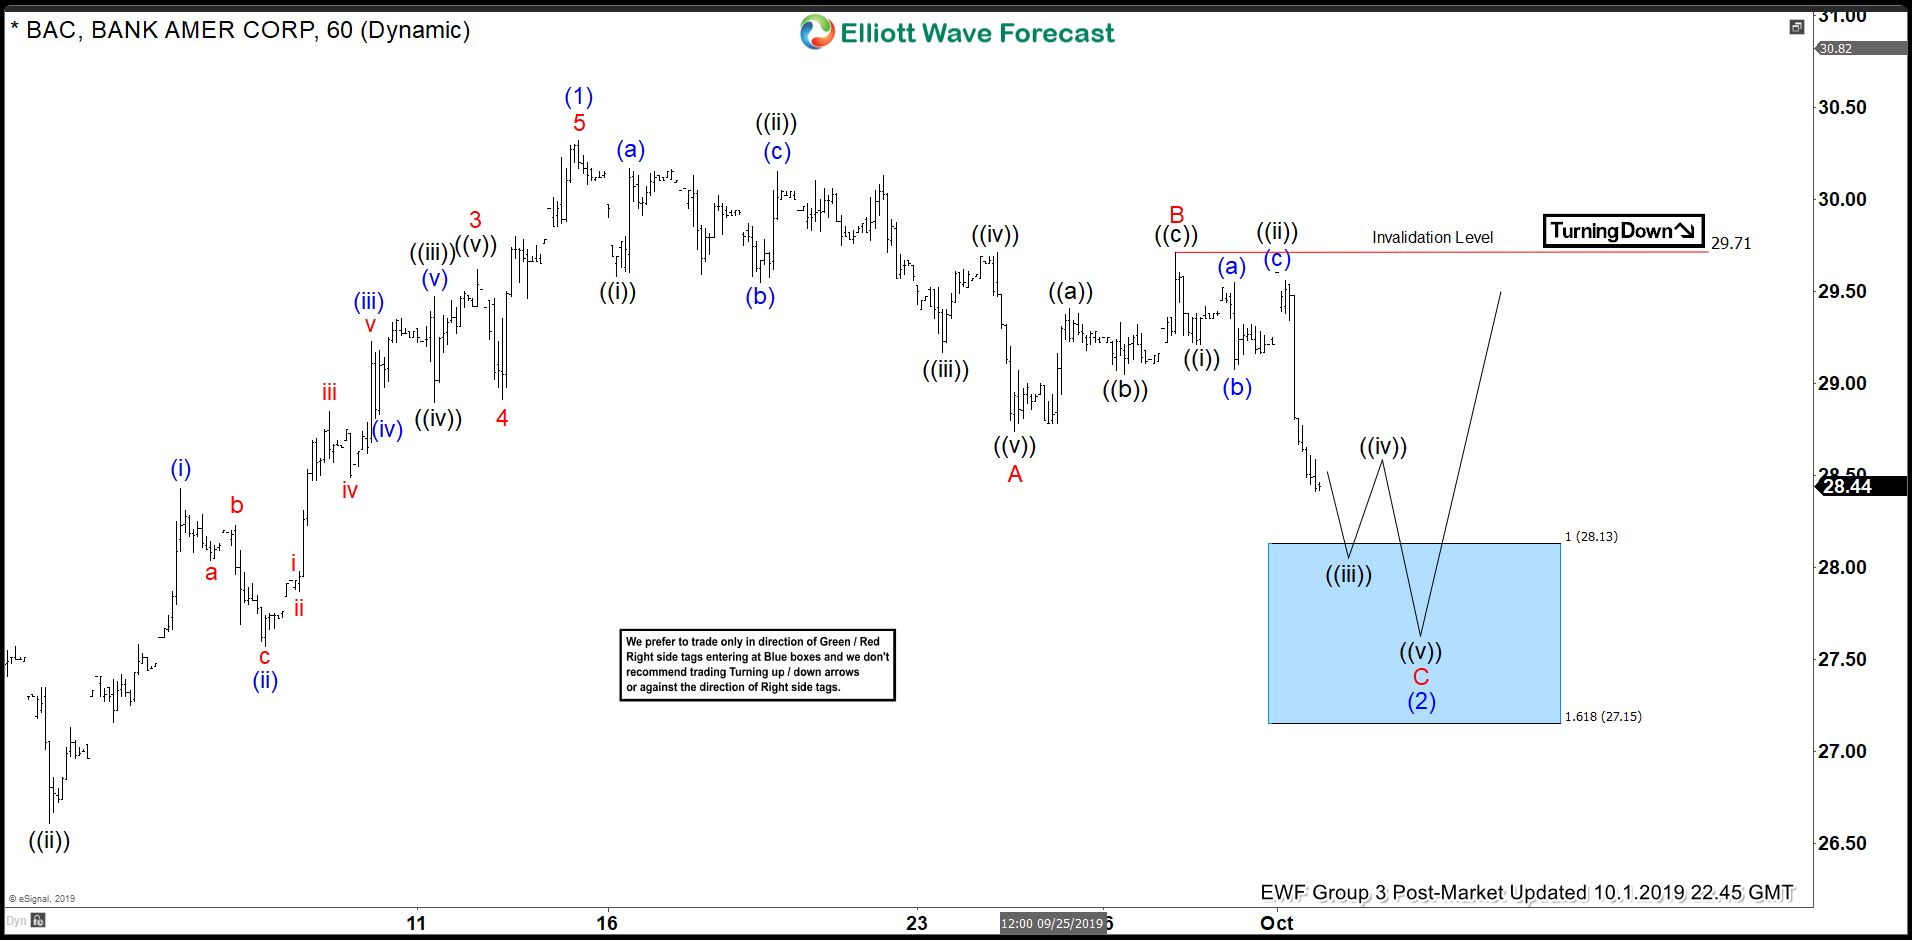
Bank Of America ( $BAC ) Forecasting The Rally From The Blue Box
Read MoreHello fellow traders. In this technical blog we’re going to take a quick look at the Elliott Wave charts of Bank Of America ( $BAC ). As our members know BAC made 5 waves up in the cycle from the 26.01 low . The Stock was expected to find buyers in 3,7,11 swings against the […]
-

JP Morgen (JPM) Stock Completed Significant Breakout
Read MoreHello fellow traders. In today’s technical blog, we will have a look at the JP Morgan (JPM) stock. JPM has been in a big consolidation between 2018 and 2019. The stock was ranging from 91.45 low and 120.05 peak. It was just a matter of time that JPM would break out this range and start the […]
-
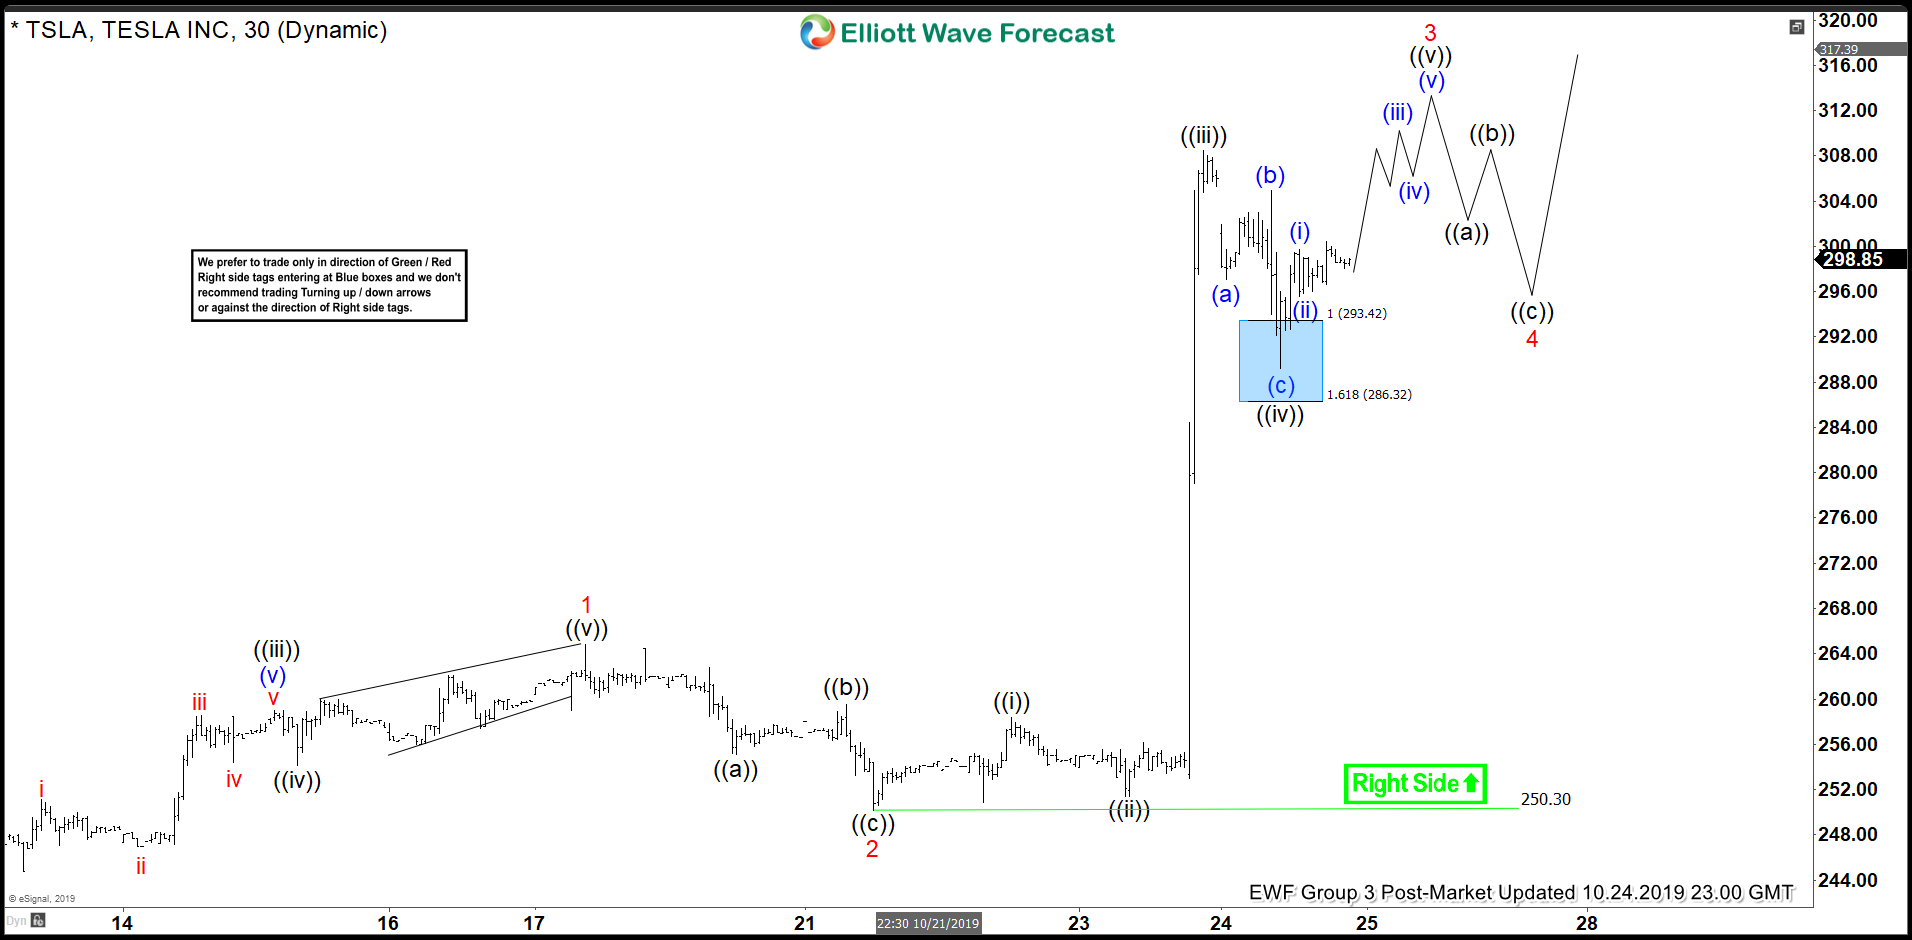
Elliott Wave View: Tesla Starts Impulse Rally
Read MoreTesla soars as the company reported better than expected earnings. This article and video looks at the Elliott Wave path of the stock.
-
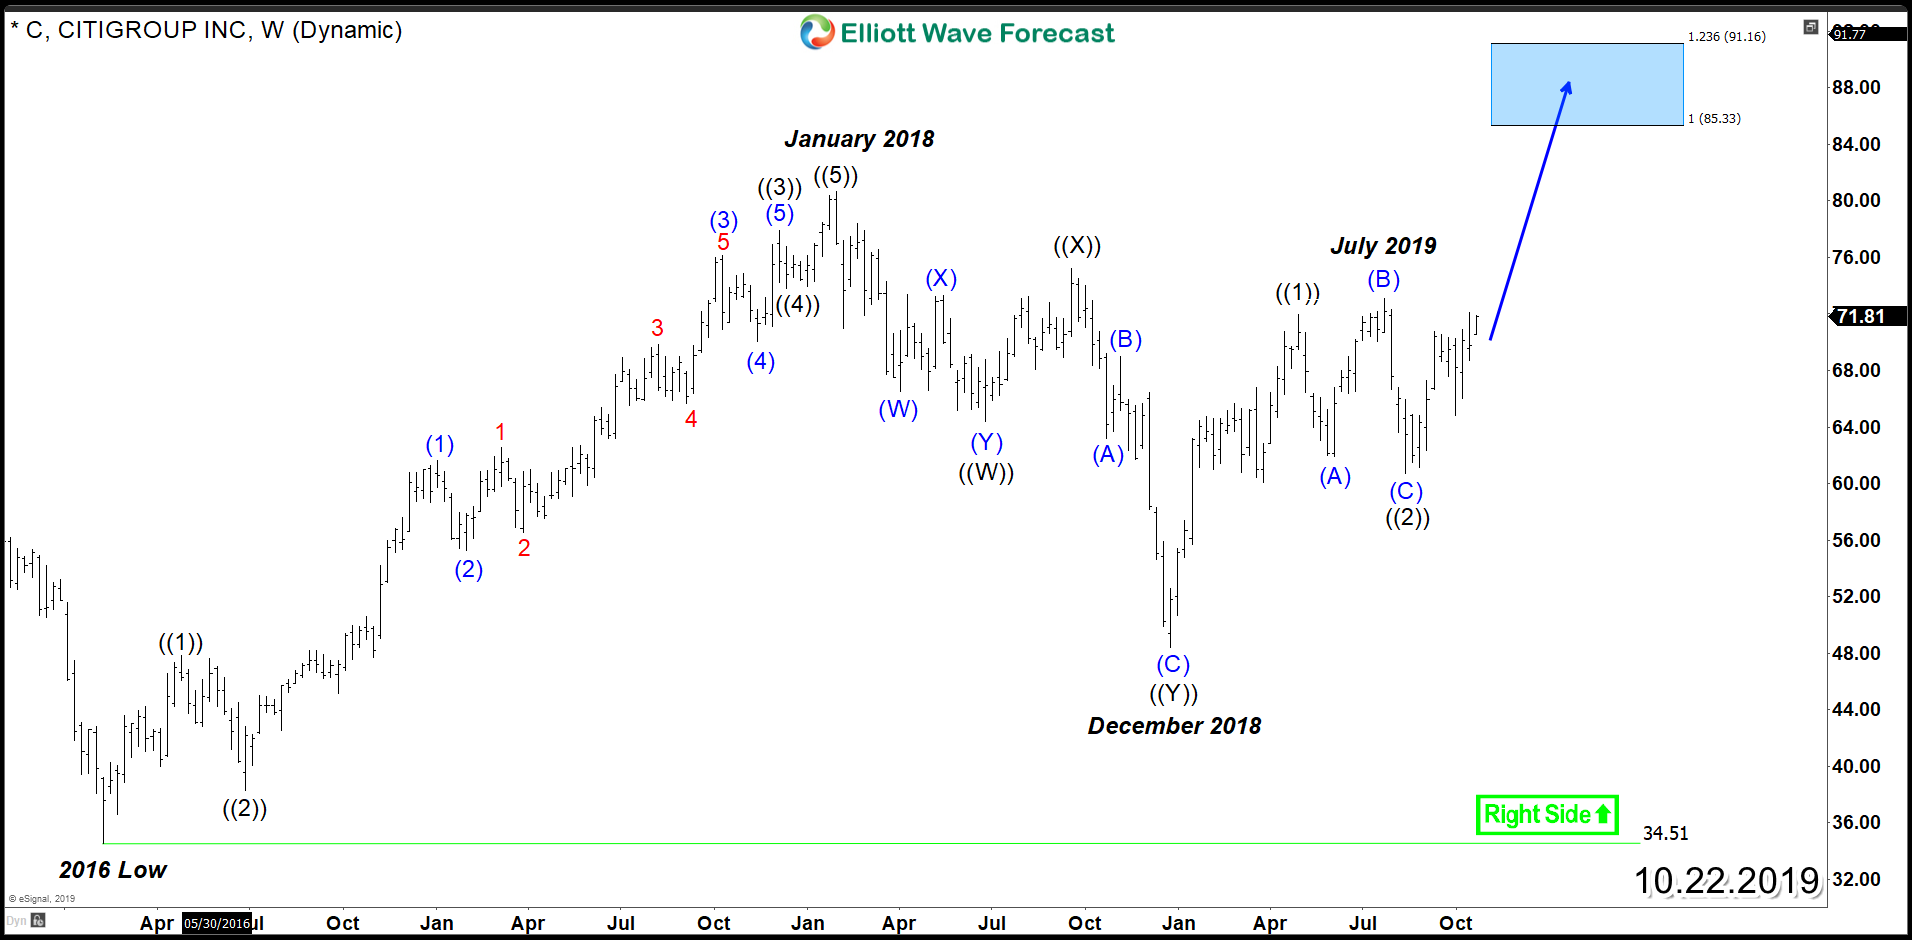
Citigroup (NYSE: C) Impulsive Rally Extending for Year-End
Read MoreCitigroup (NYSE: C) is currently up $34 year-to-date and the stock is still aiming for further gains before year-end as the financial sector continues the recovery from last year correction. The recent impulsive rally from 10.03.2019 low allowed the stock to break above September 2019 peak which opened a bullish sequence from August low and […]
-
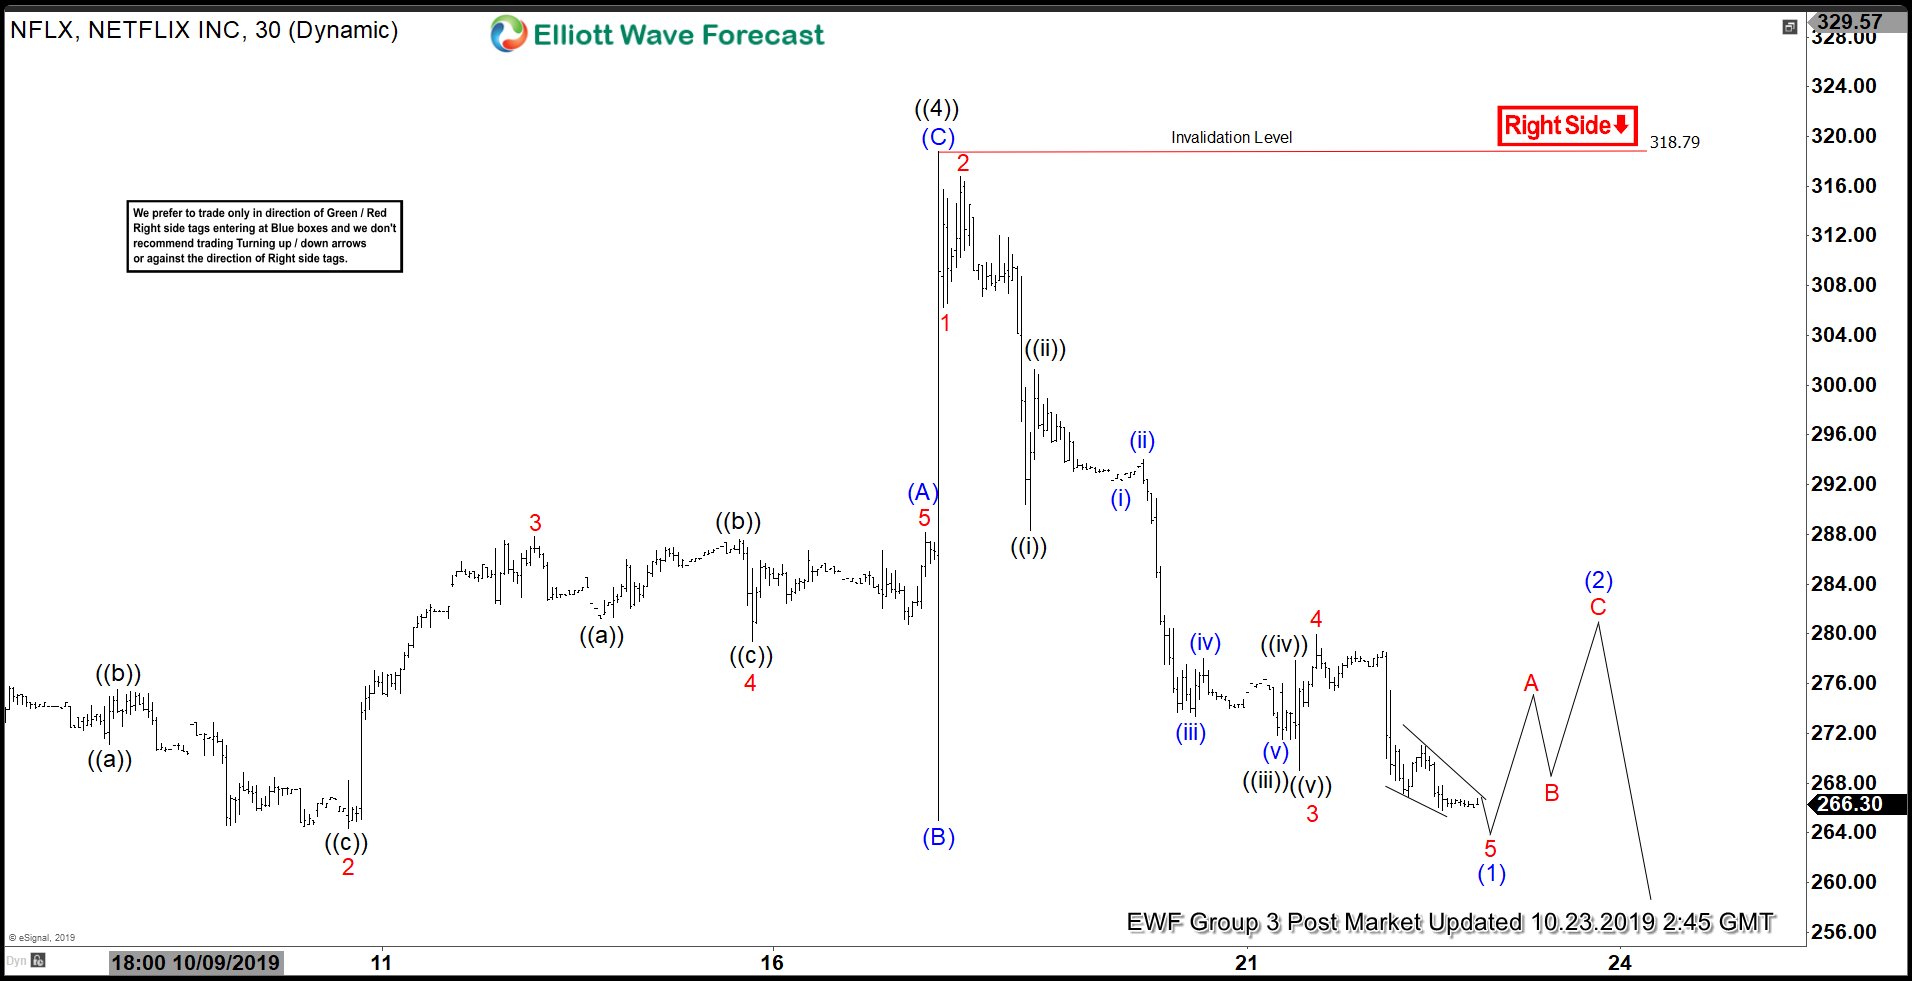
Elliott Wave View: Netflix Looking to Resume Lower
Read MoreShort Term Elliott Wave view on Netflix (Ticker: NFLX) suggests that the spike to $318.79 on October 17, 2019 ended wave ((4)). Internal subdivision of wave ((4)) unfolded as a zigzag Elliott Wave structure where wave (A) ended at 288.17, wave (B) ended at 265, and wave (C) ended at 318.79. Since then, the stock […]