

The Power of 3-7-11 and the Grand Super Cycle: How We Saw the Bullish Turn in April 2025 Back on April 9, 2025, while World Indices were dropping sharply and global sentiment had turned overwhelmingly bearish, we published an article that challenged the fear-driven narrative. We explained why selling was not the right approach and […]
-
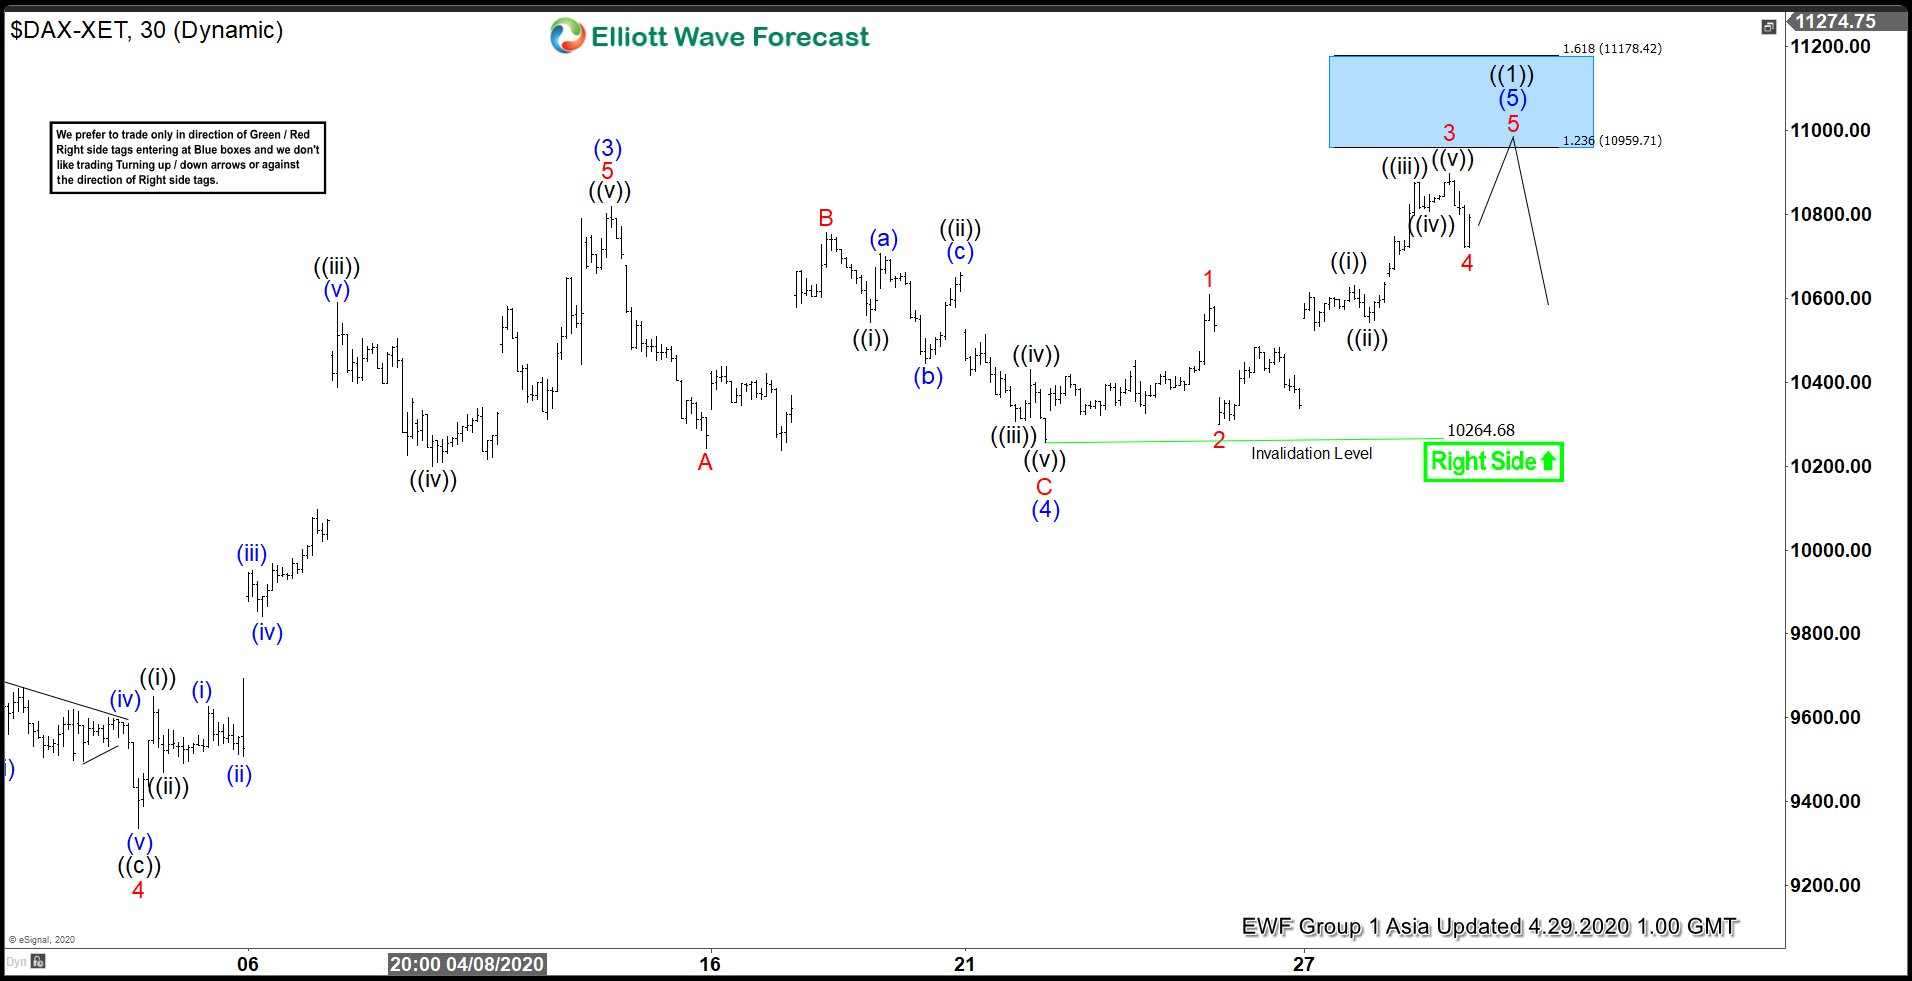
Elliott Wave View: Impulsive Rally in DAX From March Low
Read MoreDAX Rally from March 16, 2020 low is unfolding as an impulse which favors more upside. This video looks at the Elliott Wave path.
-
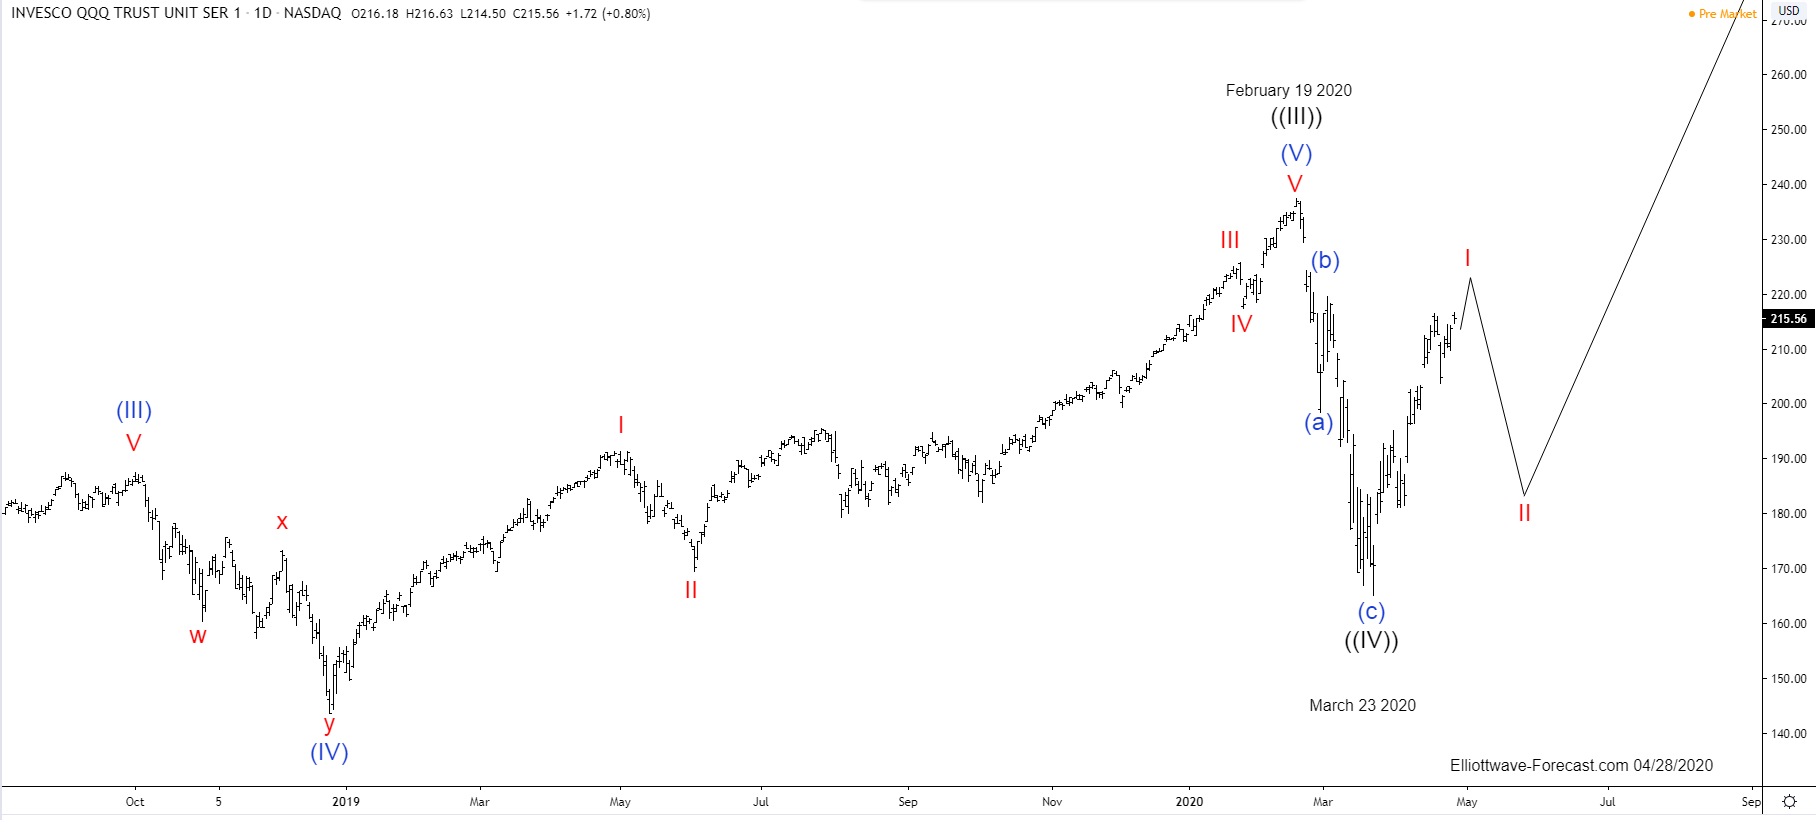
The $QQQ Nasdaq Tracker Long Term Cycles & Elliott Wave
Read MoreThe $QQQ Nasdaq Tracker Long Term Cycles & Elliott Wave Firstly the QQQ instrument inception date was in March 1999. That was before it ended a larger cycle up from the all time lows in March 2000. The ETF instrument mirrors the price movement of the Nasdaq which did that. As shown below from the […]
-
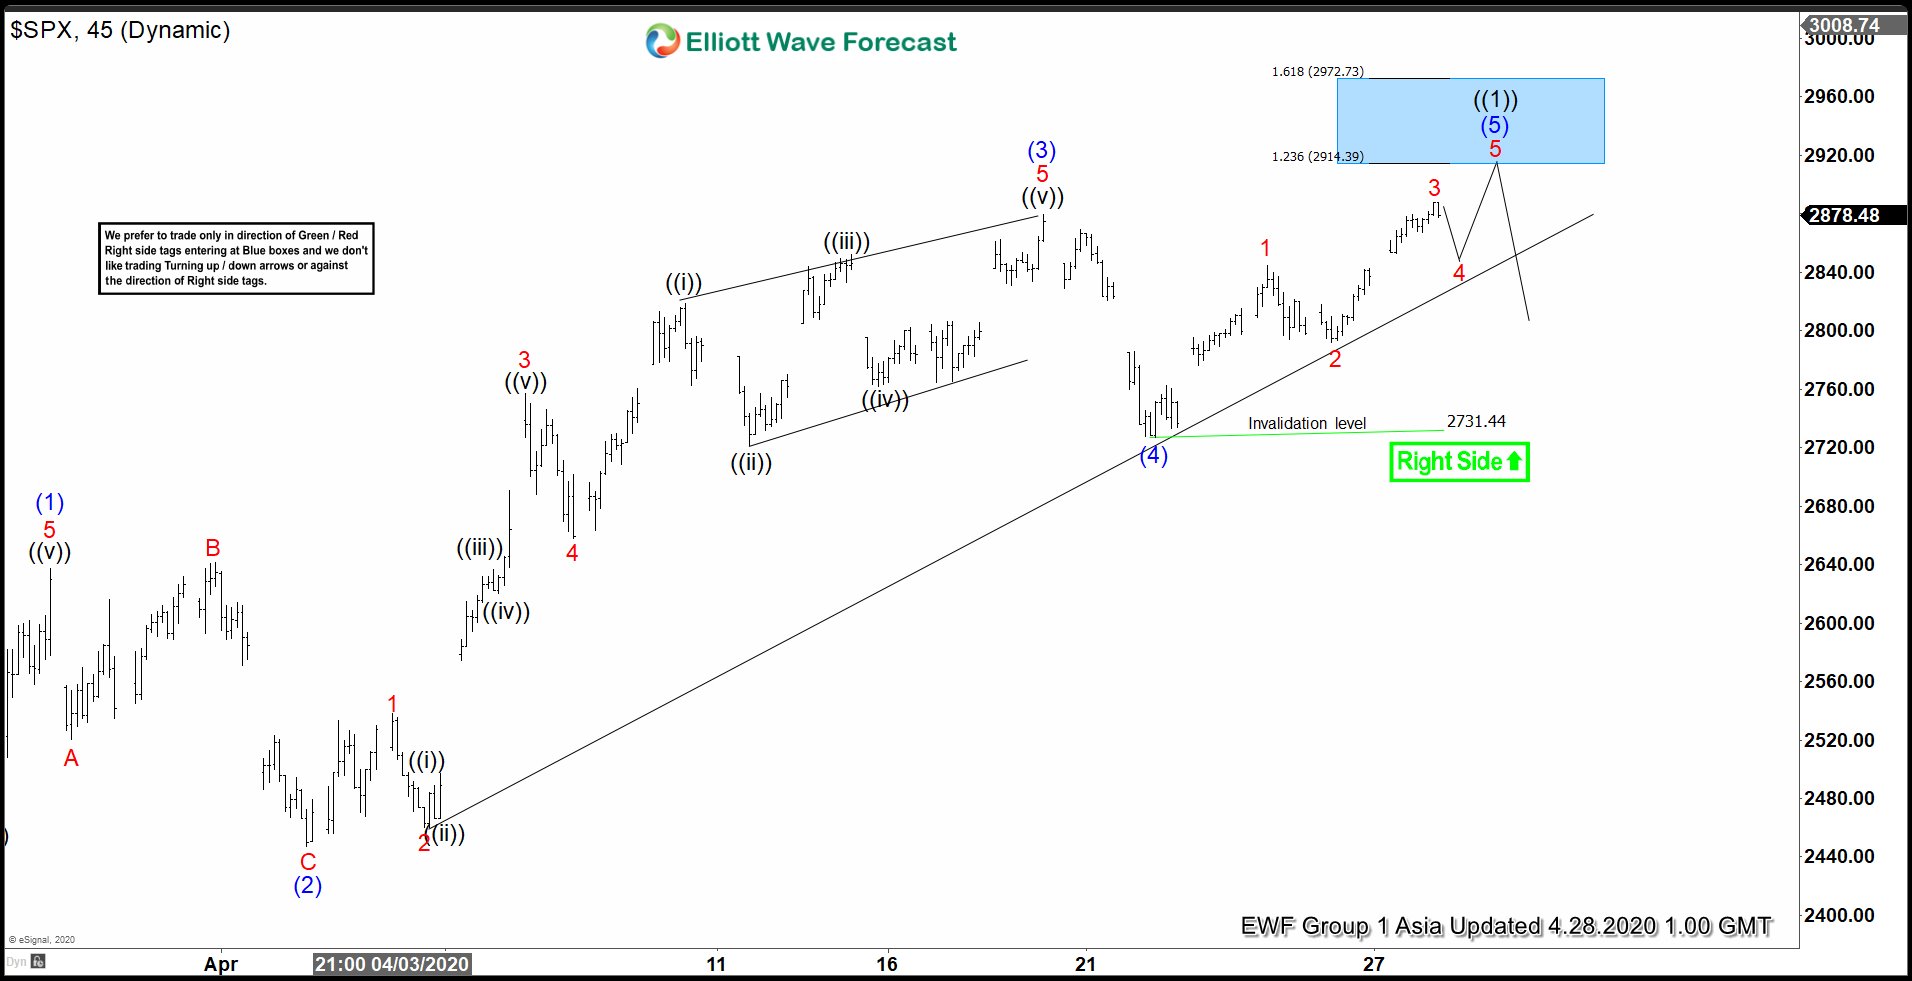
Elliott Wave View: SPX Rally from March Low as an Impulse
Read MoreSPX rally from March low is unfolding as an impulse. This article and video looks at the short term Elliott Wave path of the Index.
-
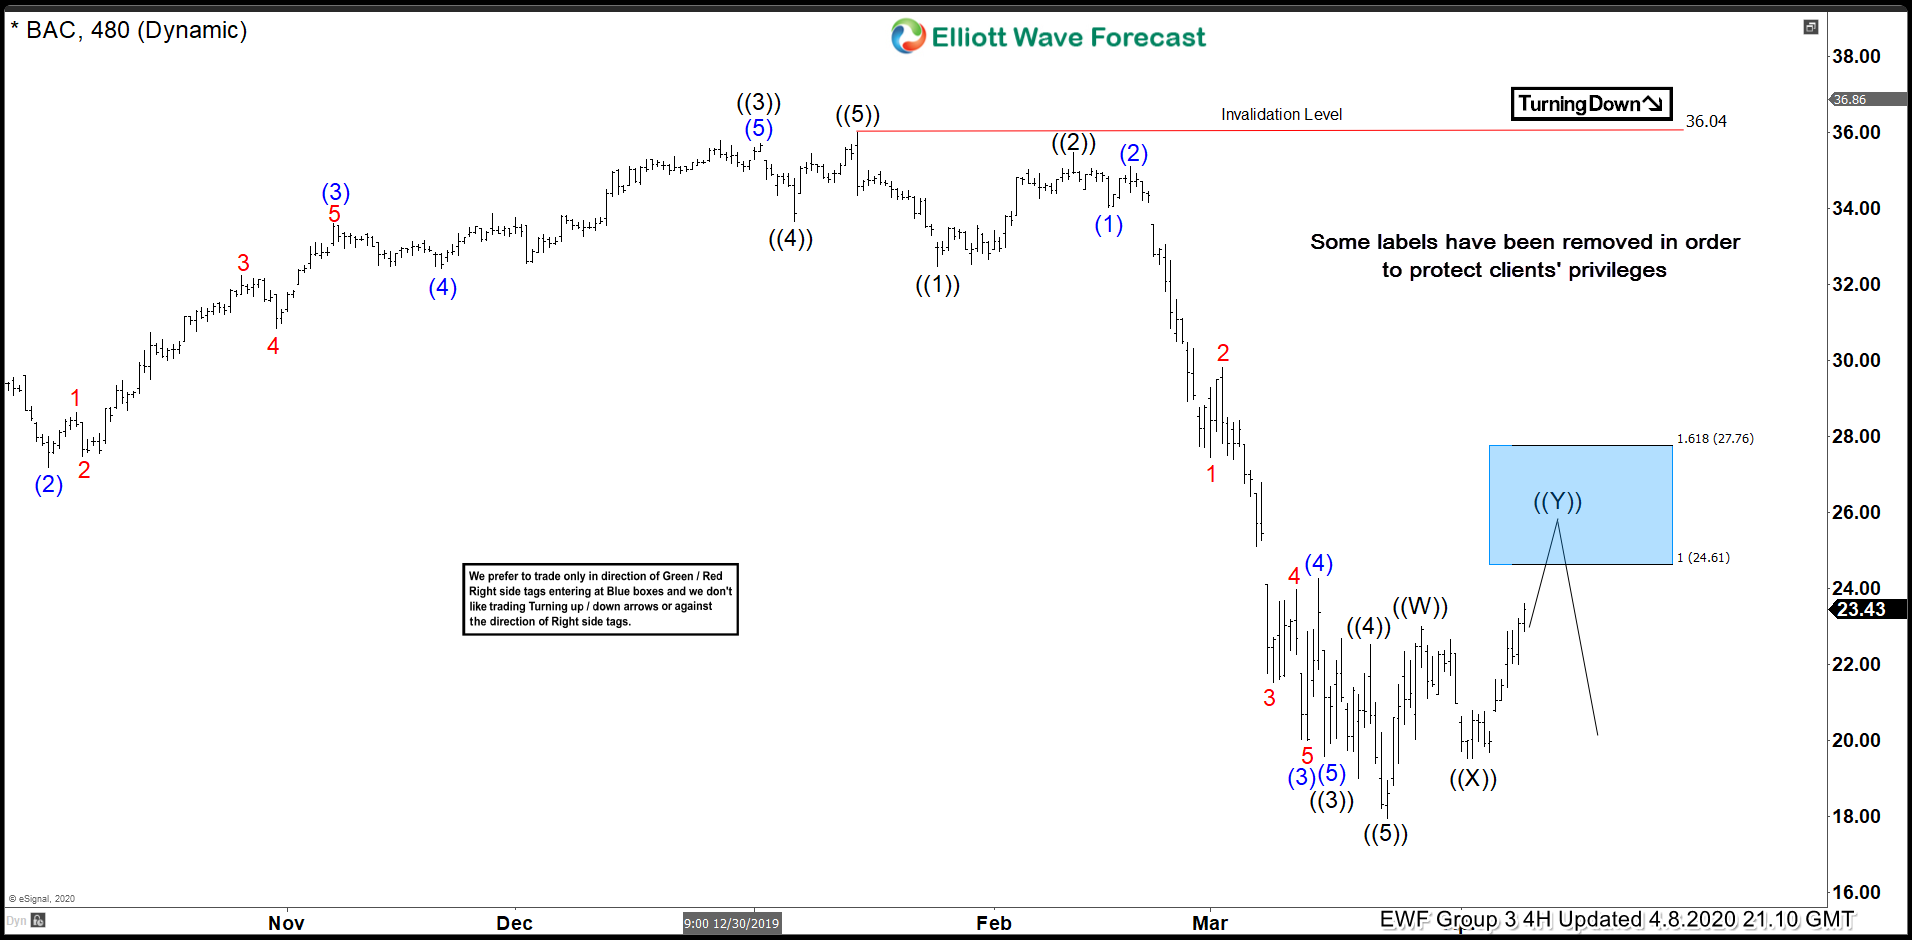
BAC Forecasting The Decline From The Blue Box
Read MoreIn this technical blog we’re going to take a quick look at the charts of Bank Of America (BAC) published in members area of the website. As our members know BAC made 5 waves down from the 36.04 peak ( 01/15). Proposed January cycle completed on March 23th date and the Stock made recovery. BAC […]
-

$BAYN : Bayer Should Resume Rally To New Highs Or Recover In 3 Waves Minimum
Read MoreBayer Ag is one of the largest pharmaceutical companies in the world. Founded in 1863 and headquartered in Leverkusen, Germany, Bayer’s most famous product was aspirin. Today, the company is a part of DAX30 and of SX5E indices. In recent weeks, as all major pharmaceutical companies, Bayer contributes also actively in the fight against COVID-19. If that […]
-
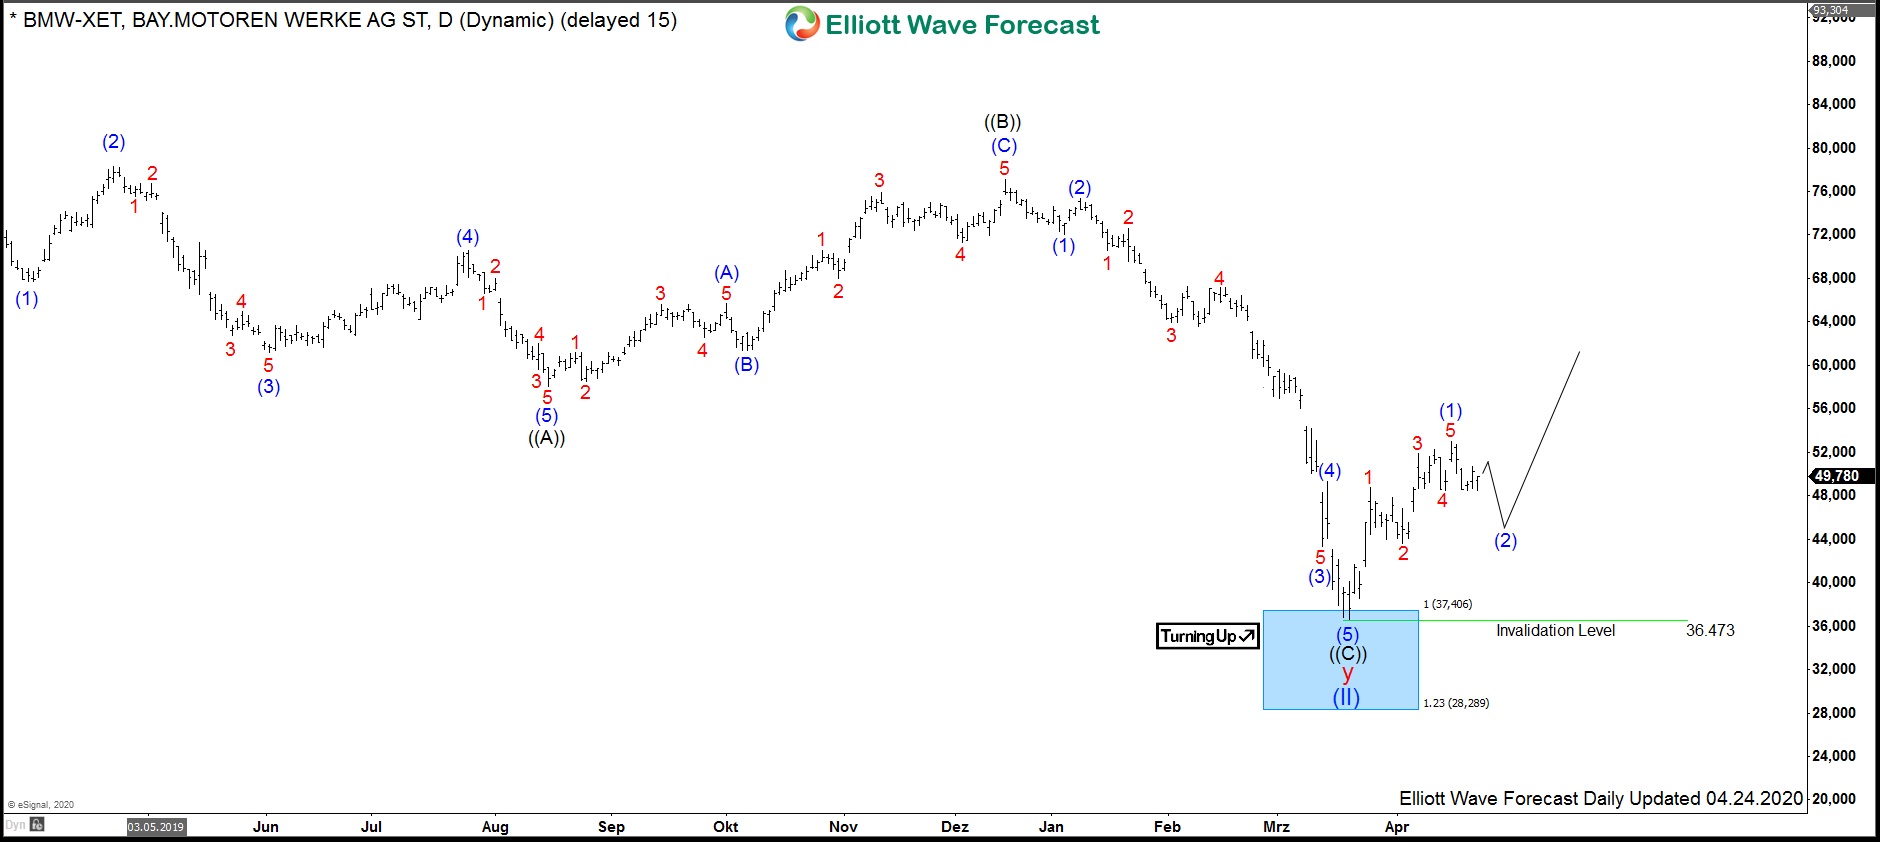
$BMW : BMW stock is finally ready to accelerate higher
Read MoreBMW is one of the biggest german car manufacturers excelling in quality and technical characteristics. From march 2015, the performance of the stock price $BMW being part of DAX is, however, in a steady decline. As a matter of fact, this price development may be a real headake for company leaders. And still, disregarding all […]