

The Power of 3-7-11 and the Grand Super Cycle: How We Saw the Bullish Turn in April 2025 Back on April 9, 2025, while World Indices were dropping sharply and global sentiment had turned overwhelmingly bearish, we published an article that challenged the fear-driven narrative. We explained why selling was not the right approach and […]
-
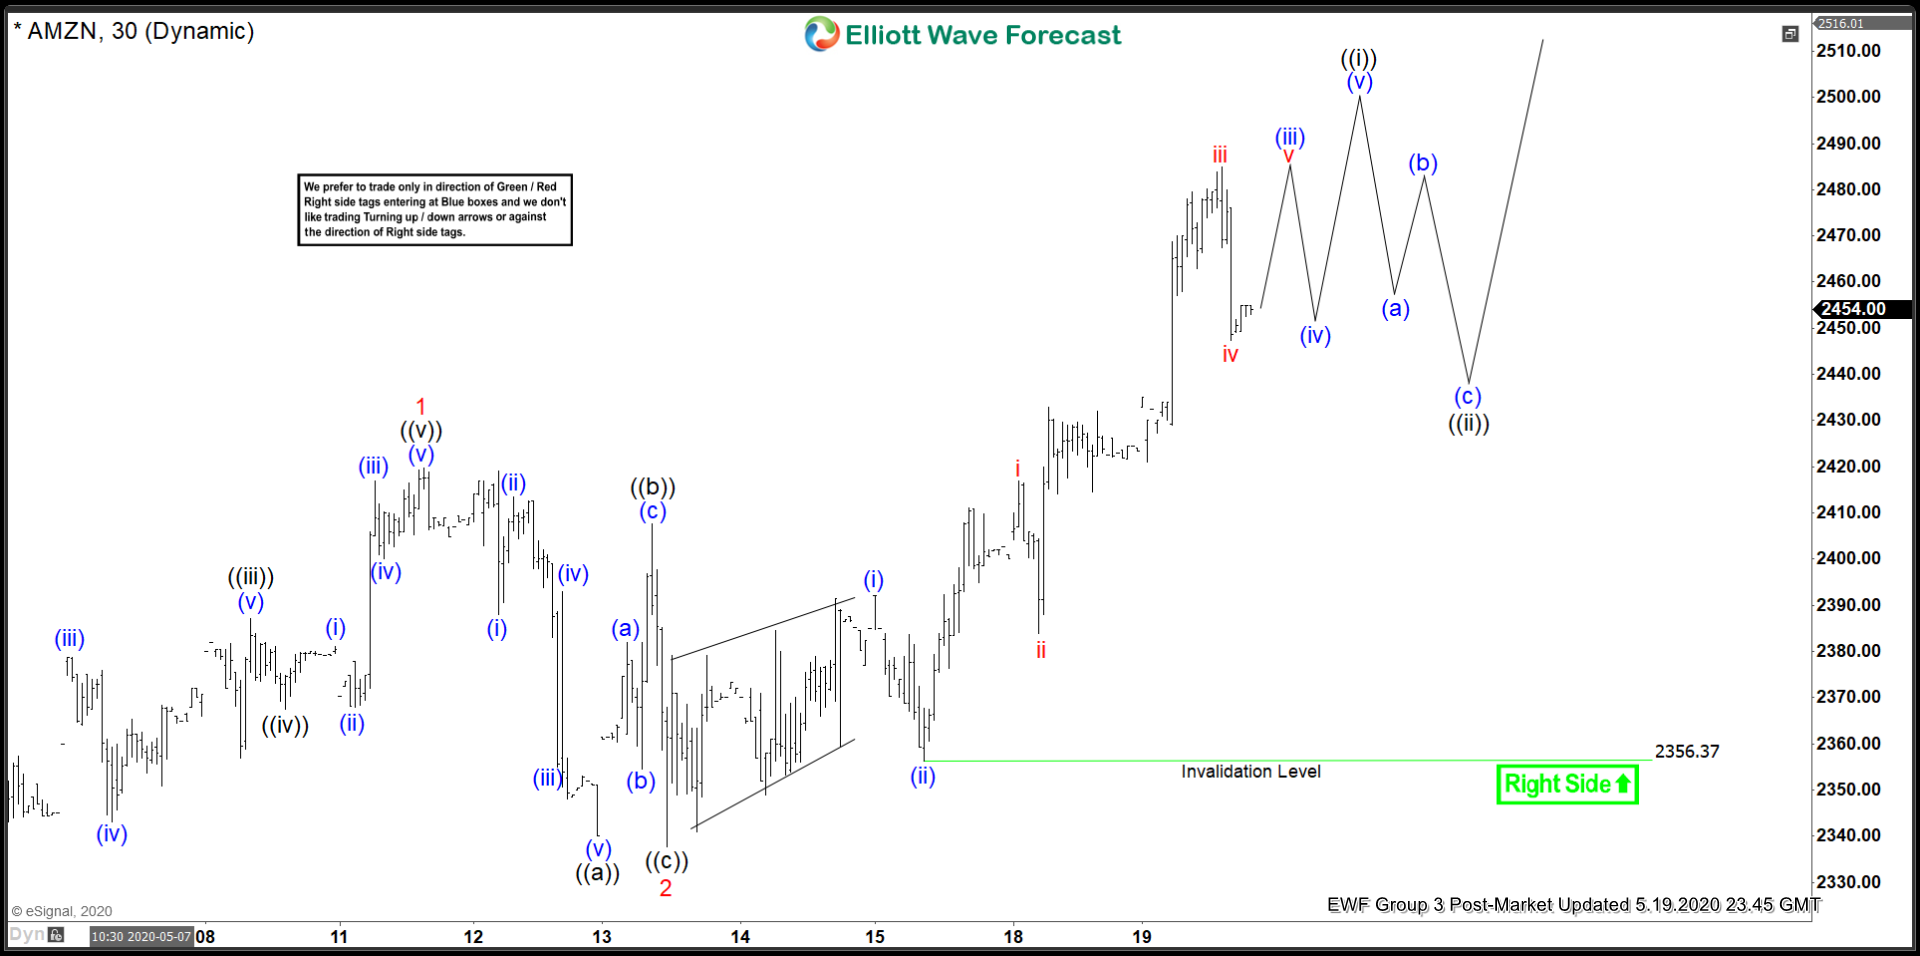
Elliott Wave View: Amazon (AMZN) Impulsive Move In Progress
Read MoreAmazon (AMZN) rally from March 16, 2020 low is impulsive and favors further upside. This article and video look at the Elliott Wave path.
-
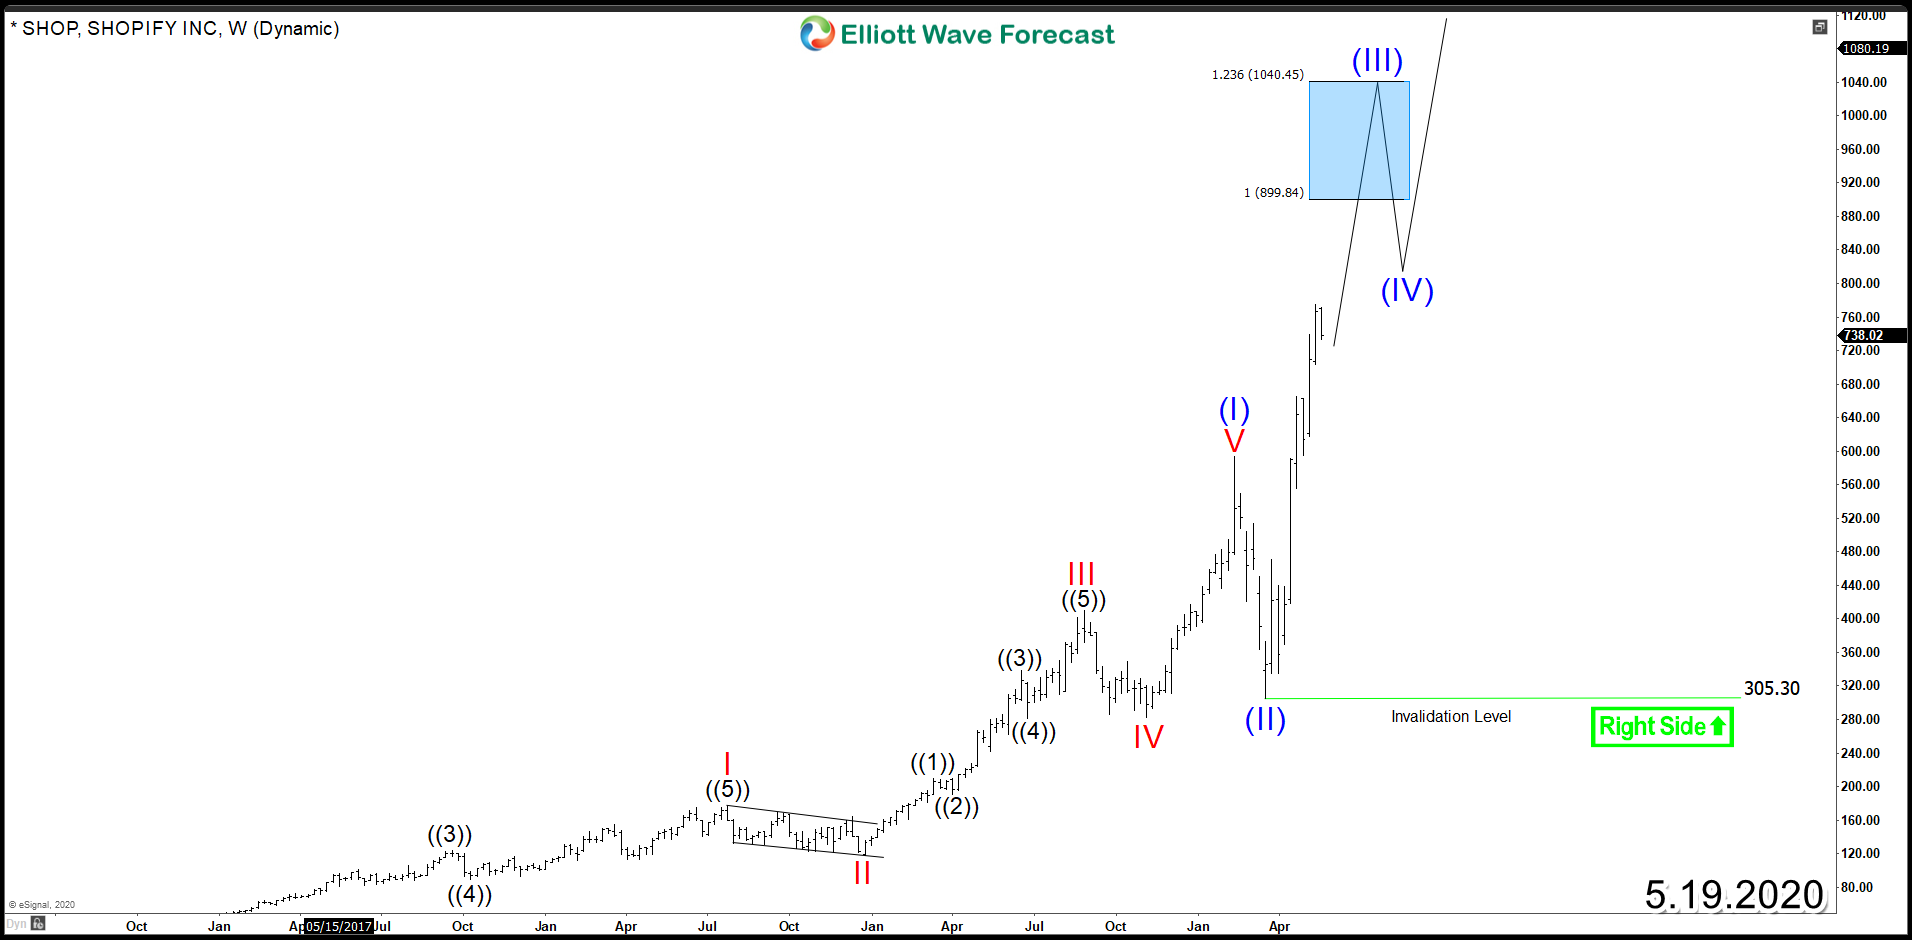
Shopify (NYSE:SHOP) – Bulls Looking To Remain In Control
Read MoreShopify (NYSE: SHOP) is one of the best performing technology stocks since its IPO back in 2015. As electronic commerce boomed in recent years, SHOP saw an enormous gain in value up to 2900% punting the stock as one of the fastest growing companies. Despite the majority of stock market being down in 2020%, SHOP was able to […]
-
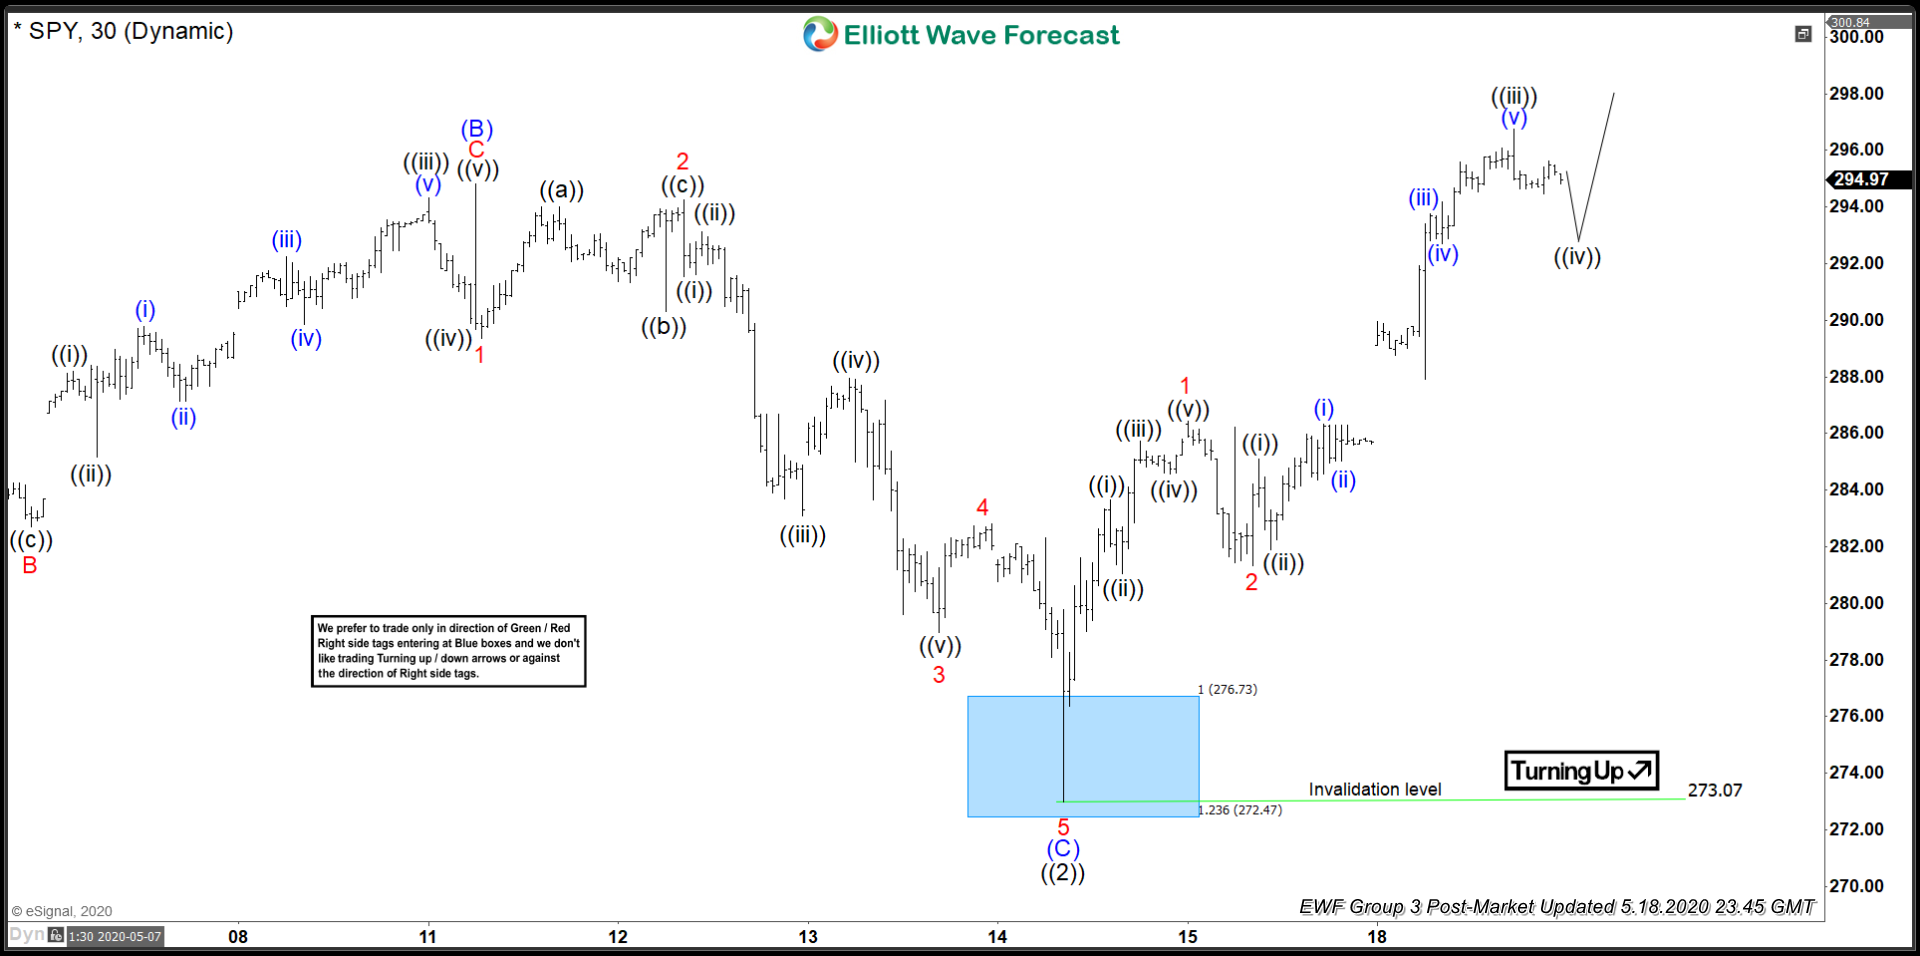
Elliott Wave View: SPY Has Resumed Wave 3 Higher
Read MoreSPY Has ended Correction to Cycle from 3.23.2020 low and resumes higher in wave 3. This article and video look at the Elliott Wave path.
-
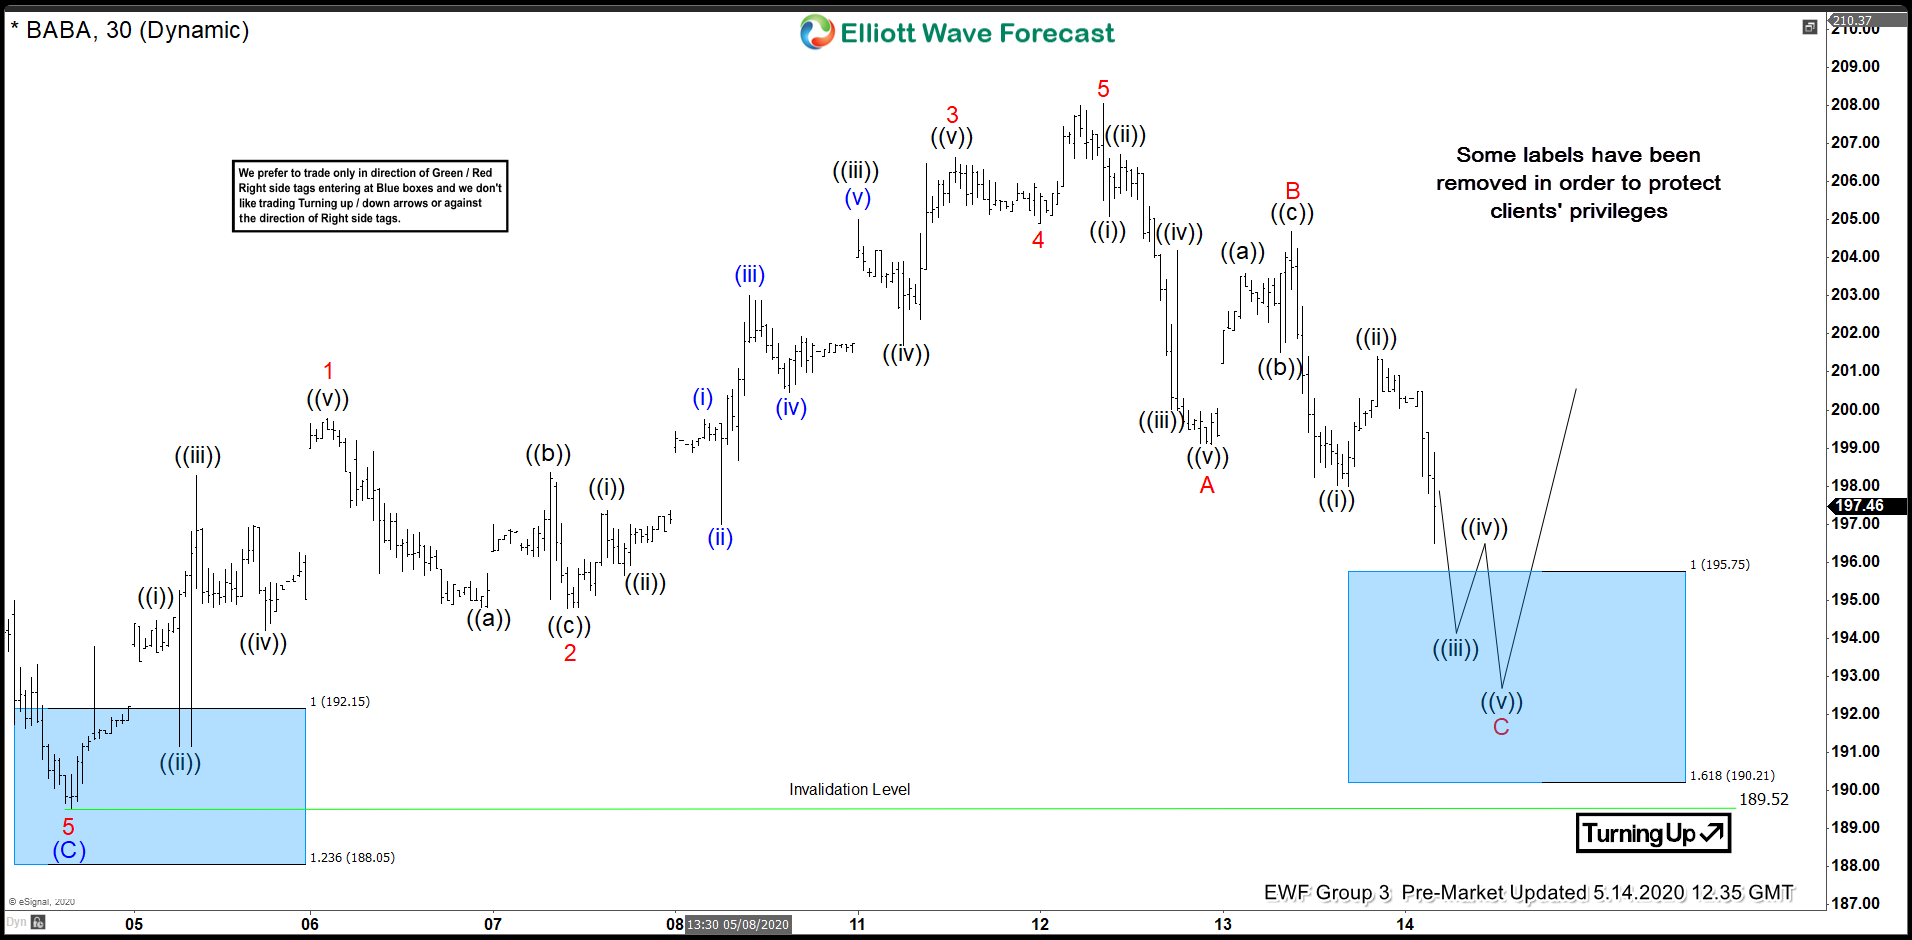
BABA Found Buyers After Elliott Wave Zig Zag Pattern
Read MoreHello fellow traders. In this technical blog we’re going to take a quick look at the Elliott Wave charts of BABA stock, published in members area of the website. As our members know, BABA has been reacting nicely from blue box areas. Recently the stock found buyers, after completing Elliott Wave Zig Zag Pattern. In […]
-
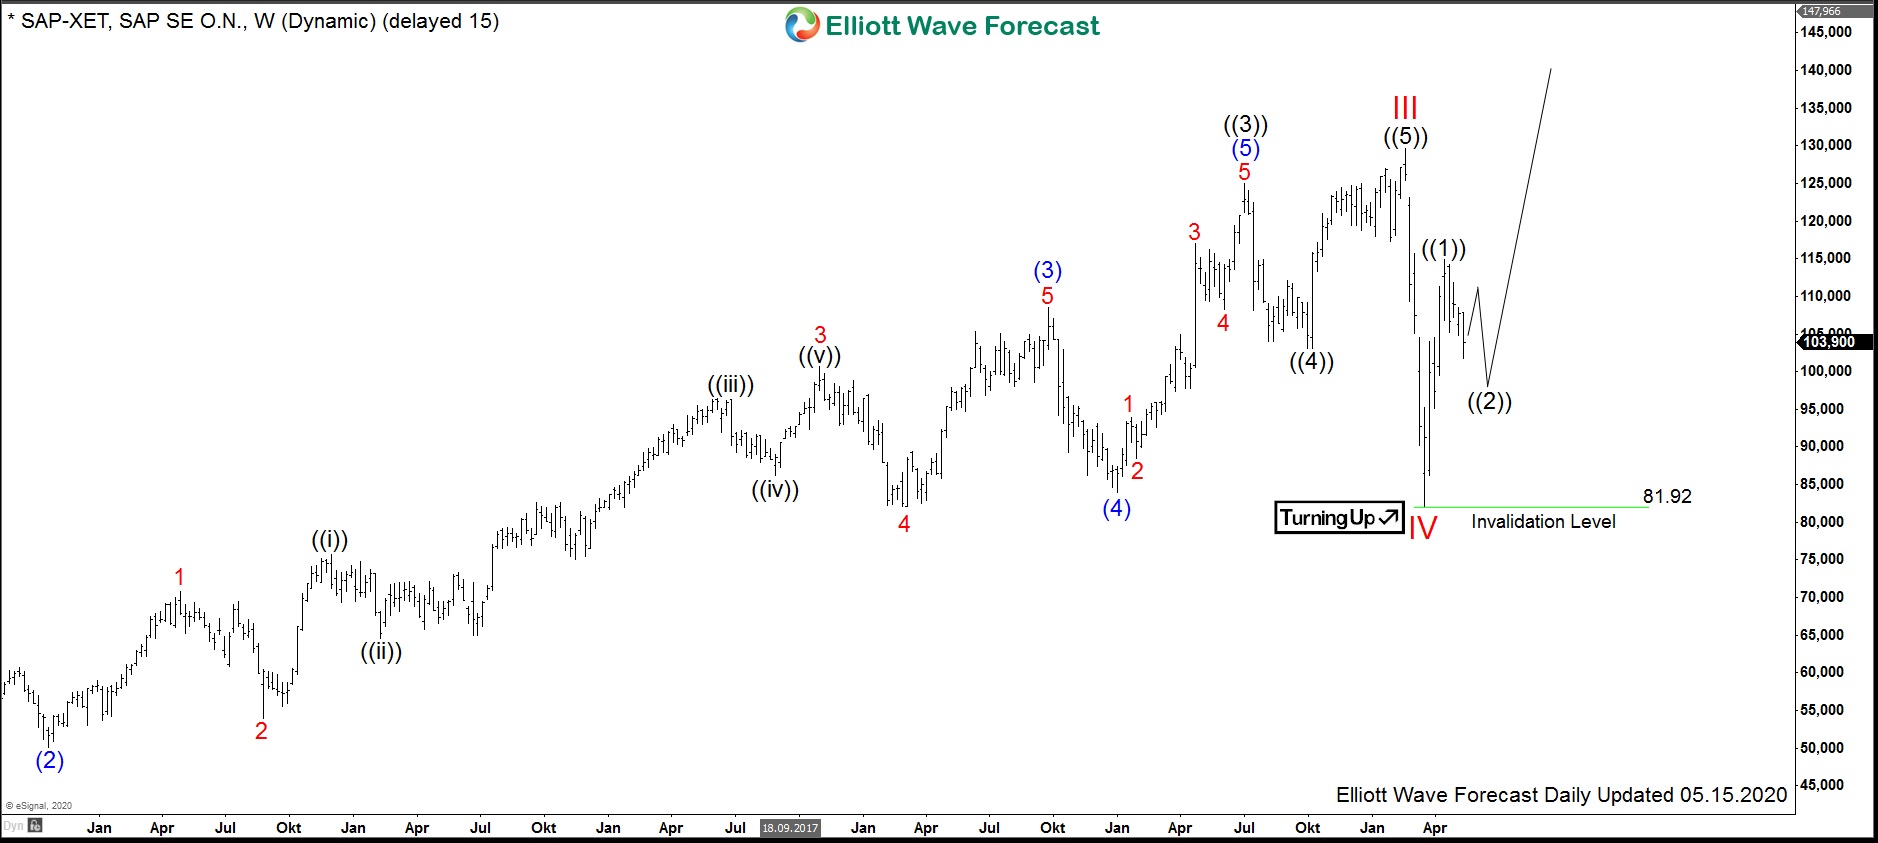
$SAP : Software Corporation SAP Can Continue Higher
Read MoreSAP SE is a multinational corporation which is well known as a producer of the enterprise software being used in managing business operations and customer relations. Founded in 1972 and headquartered in Walldorf, Germany, the company’s most famous product is the enterprise resource planning (ERP) software. The company is a part of both DAX30 and […]
-
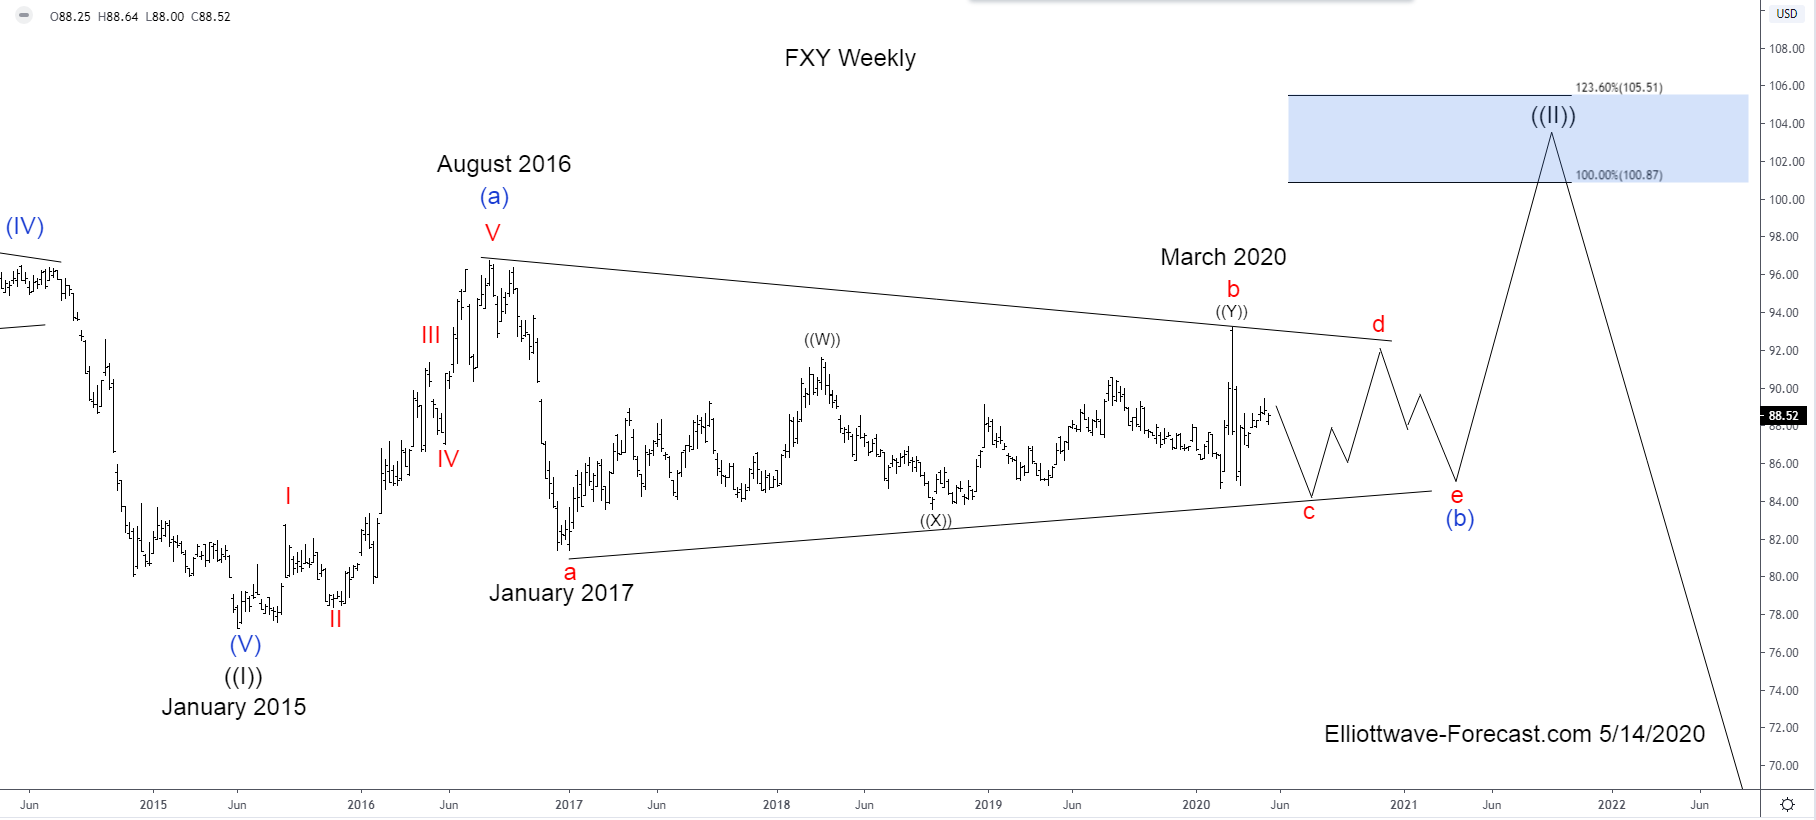
$FXY Elliott Wave & Longer Term Cycles
Read More$FXY Elliott Wave & Longer Term Cycles Firstly the $FXY instrument inception date was 2/12/2007. The instrument tracks changes of the value of the Japanese Yen versus the US Dollar. There is plenty of data going back into the longer term 1970’s time frame available for the currency cross rate in the USDJPY. The foreign […]