

The Power of 3-7-11 and the Grand Super Cycle: How We Saw the Bullish Turn in April 2025 Back on April 9, 2025, while World Indices were dropping sharply and global sentiment had turned overwhelmingly bearish, we published an article that challenged the fear-driven narrative. We explained why selling was not the right approach and […]
-
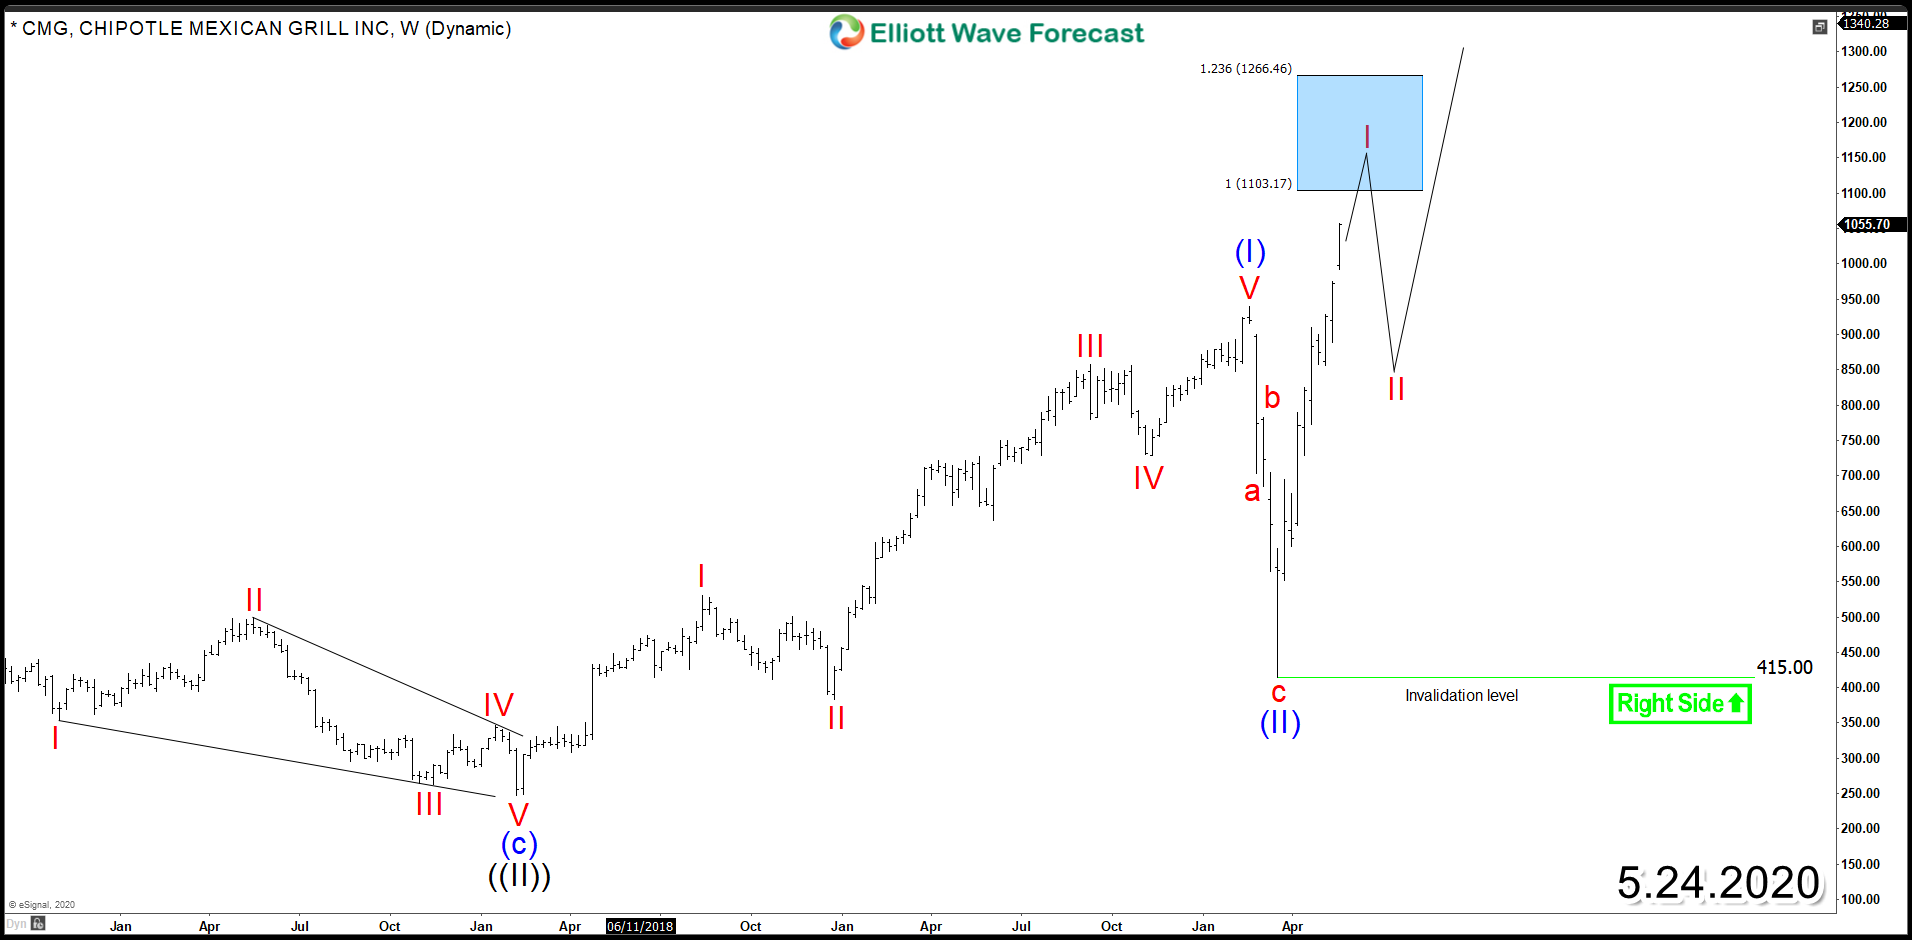
Chipotle Mexican Grill (NYSE: CMG) – Target Around the Corner
Read MoreChipotle Mexican Grill (NYSE: CMG) has been able to adapt within the current pandemic situation by adjusting its operations to handle digital orders and and made deliveries. Last week , the stock hit a record high, going over $1,000 per share for the first time and it’s currently up 125% since the March bottom. The technical outlook […]
-
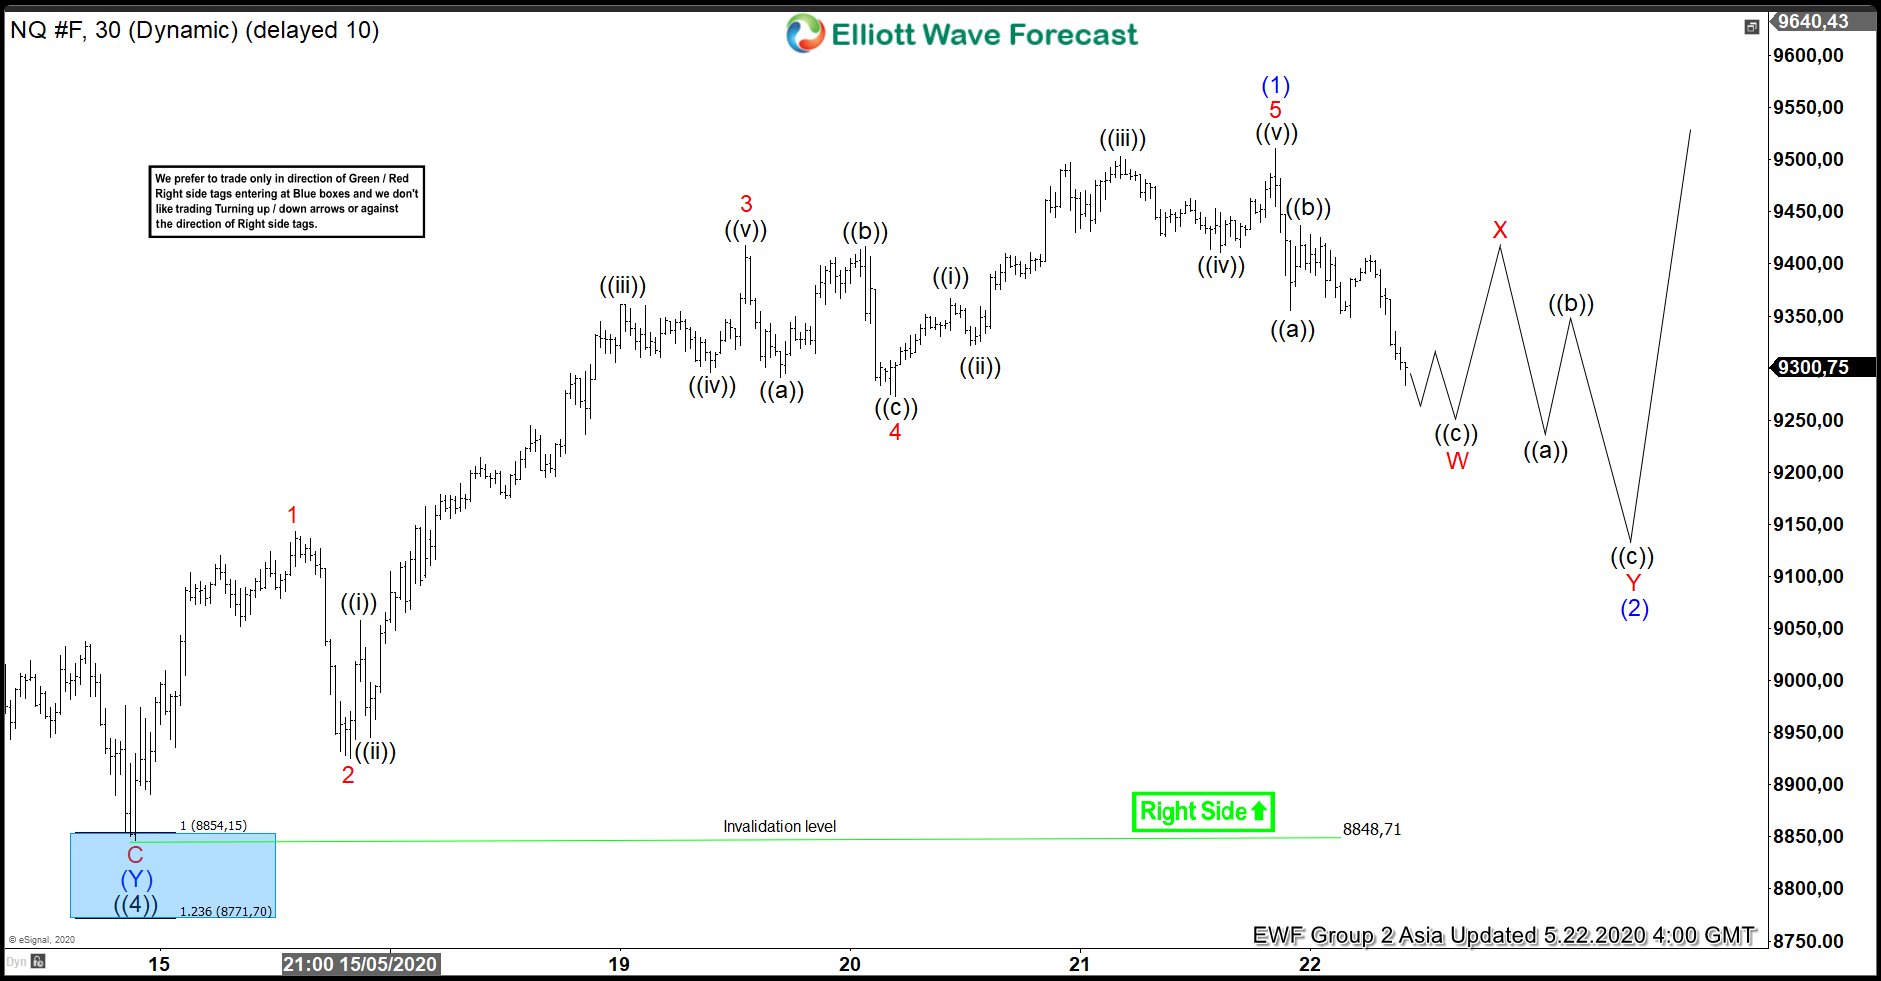
Elliott Wave View: Nasdaq Wave ((5)) In Progress
Read MoreNasdaq is within wave 5 from March 23 low. Dips can continue to find support in 3, 7, 11 swing. This article & video look at the Elliott Wave path.
-
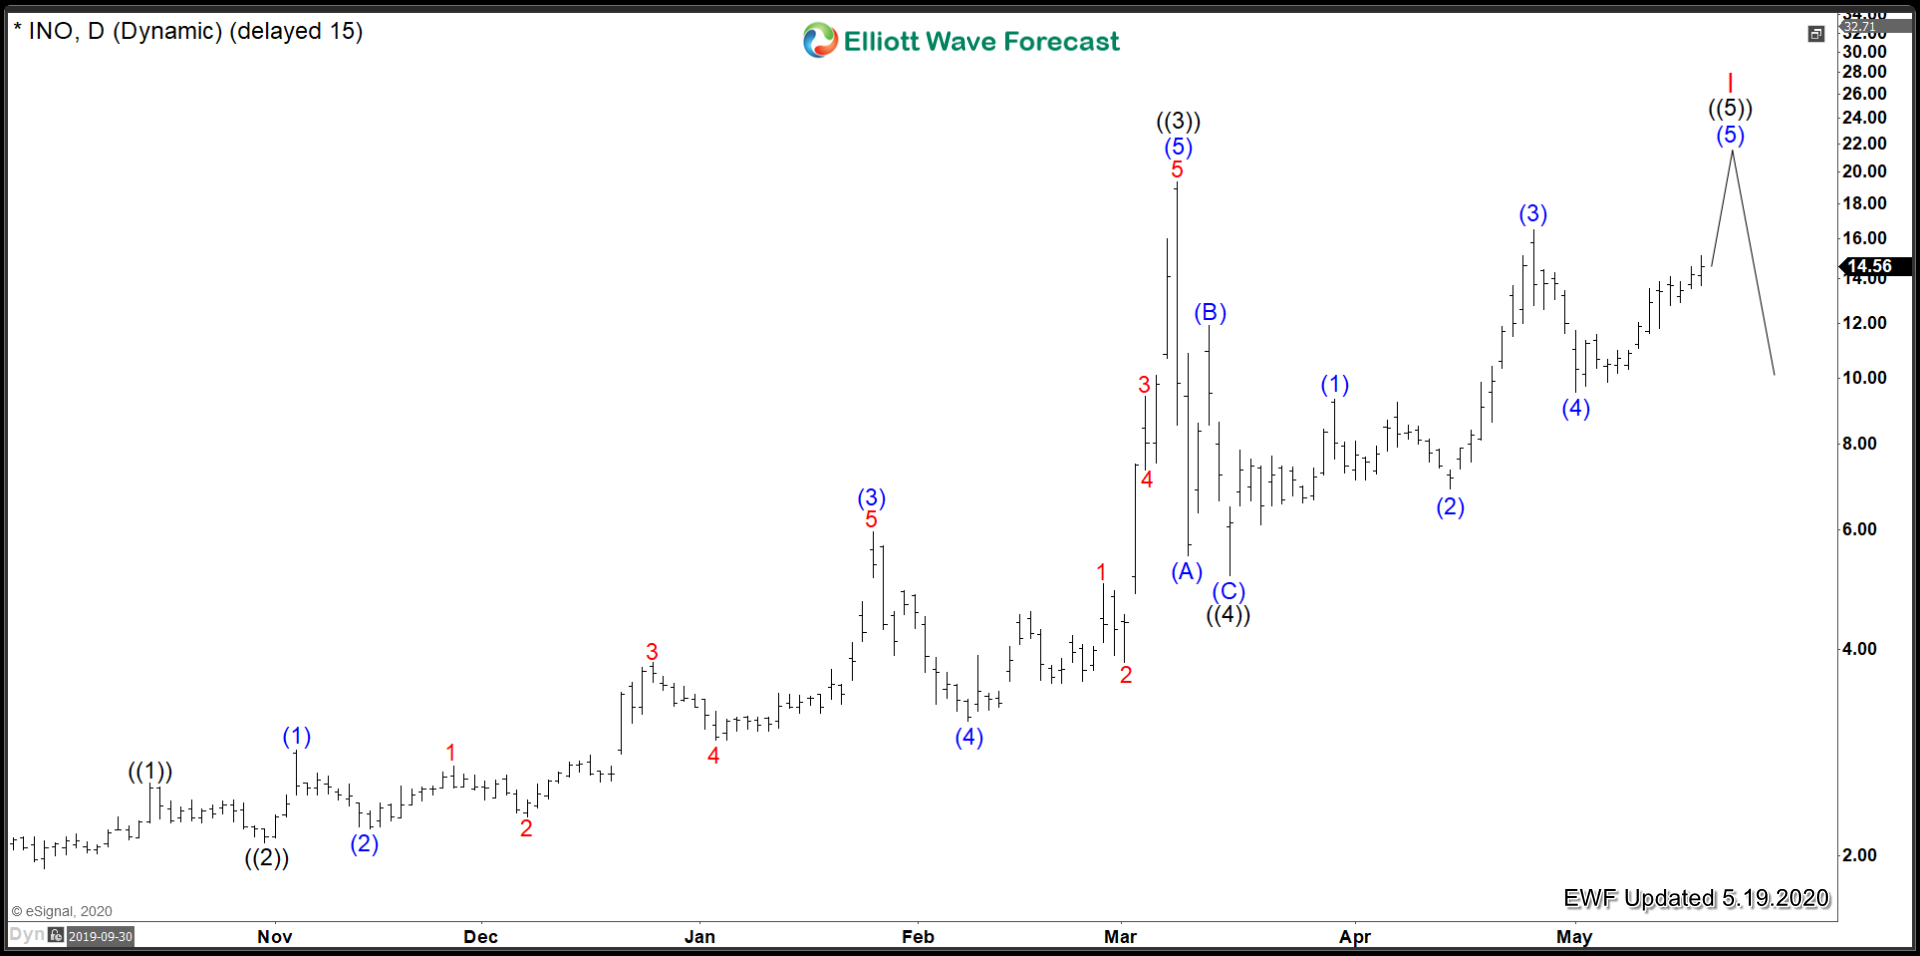
Inovio Pharmaceuticals Inc ($INO) Cycle Nearly Complete
Read MoreThe next entry in the theme of Corona Virus stocks is Inovio Pharmaceuticals Inc. Inovio has had a steady advance during the COVID-19 spreading worldwide. It also remains very technical as with all other stocks. Lets take a look at what they do as a company: “The Inovio technology is based on inserting engineered DNA into cells […]
-
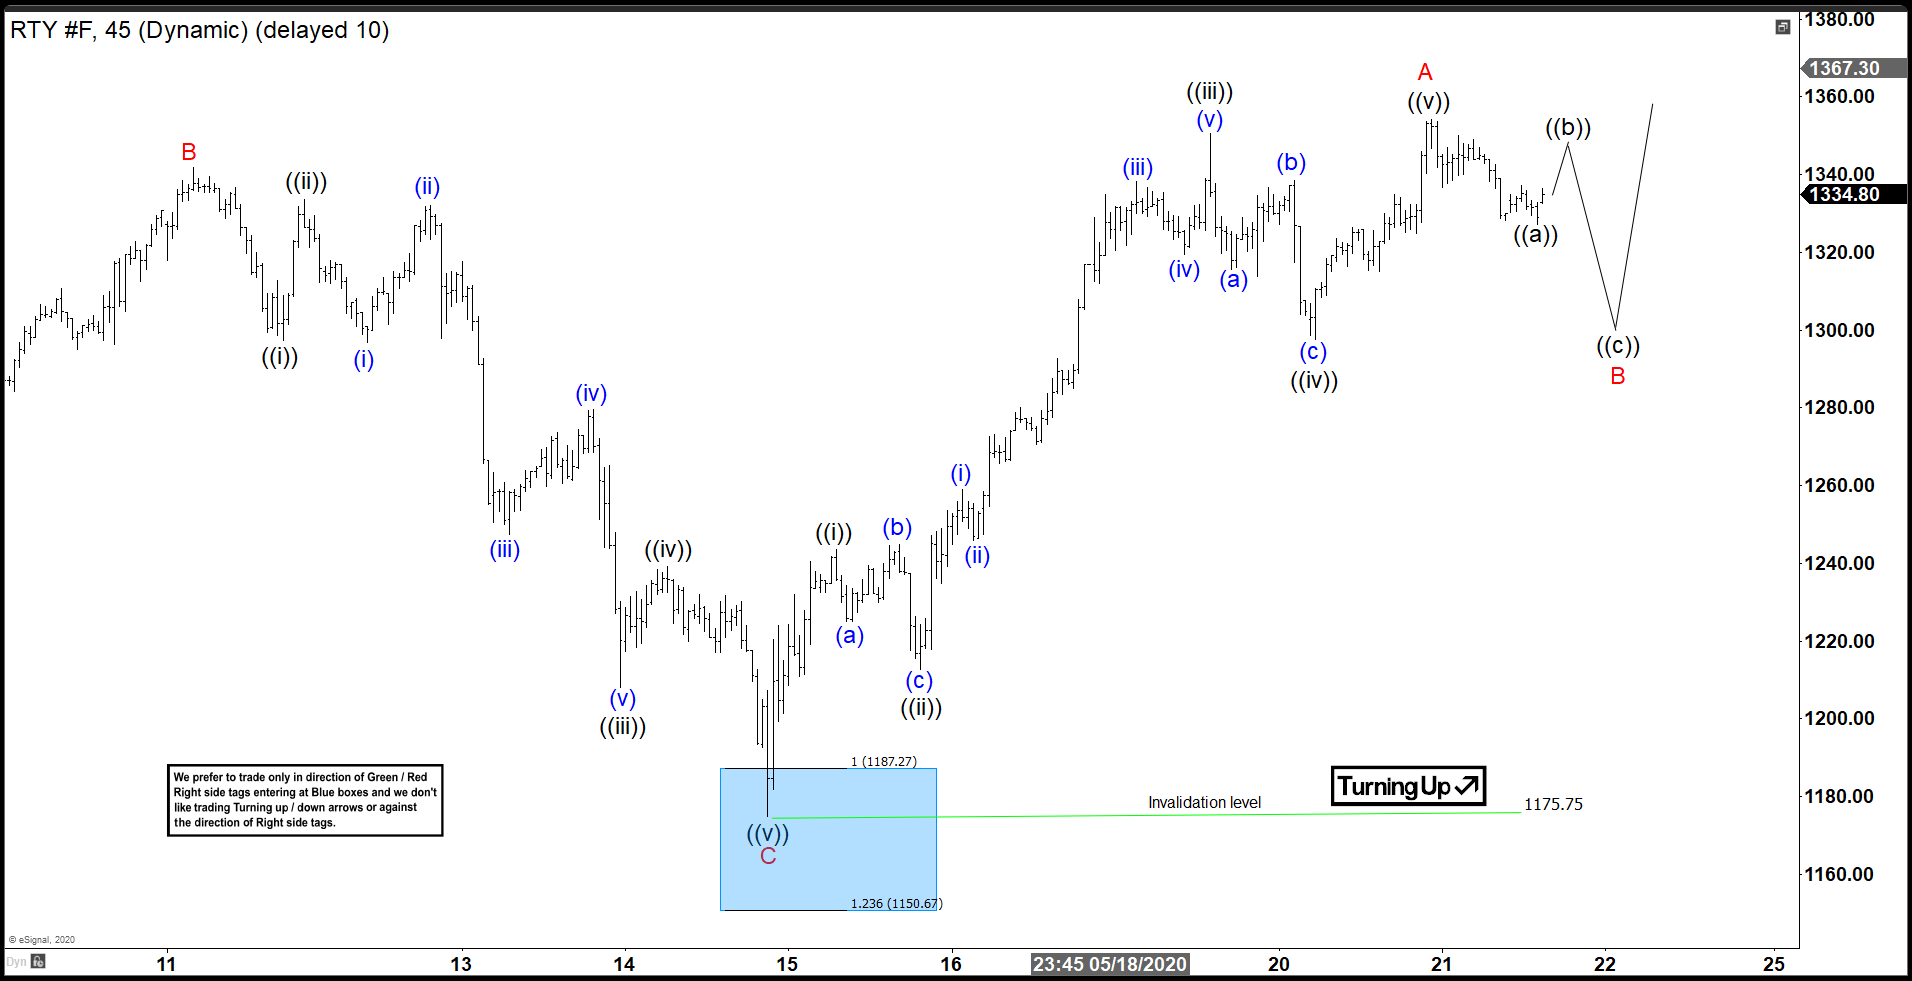
RTY_F (Russell 2000) Forecasting The Bounce From Blue Box
Read MoreIn this blog, we are going to take a look at the Elliott Wave chart of RTY_F (E-mini Russell 2000). The 1 hour NY Midday chart update shows that the cycle from April 29 peak is unfolding as a zig-zag pattern. Wave (A) ended at 1220.1 low and wave (B) bounce ended at 1341.7 high. […]
-
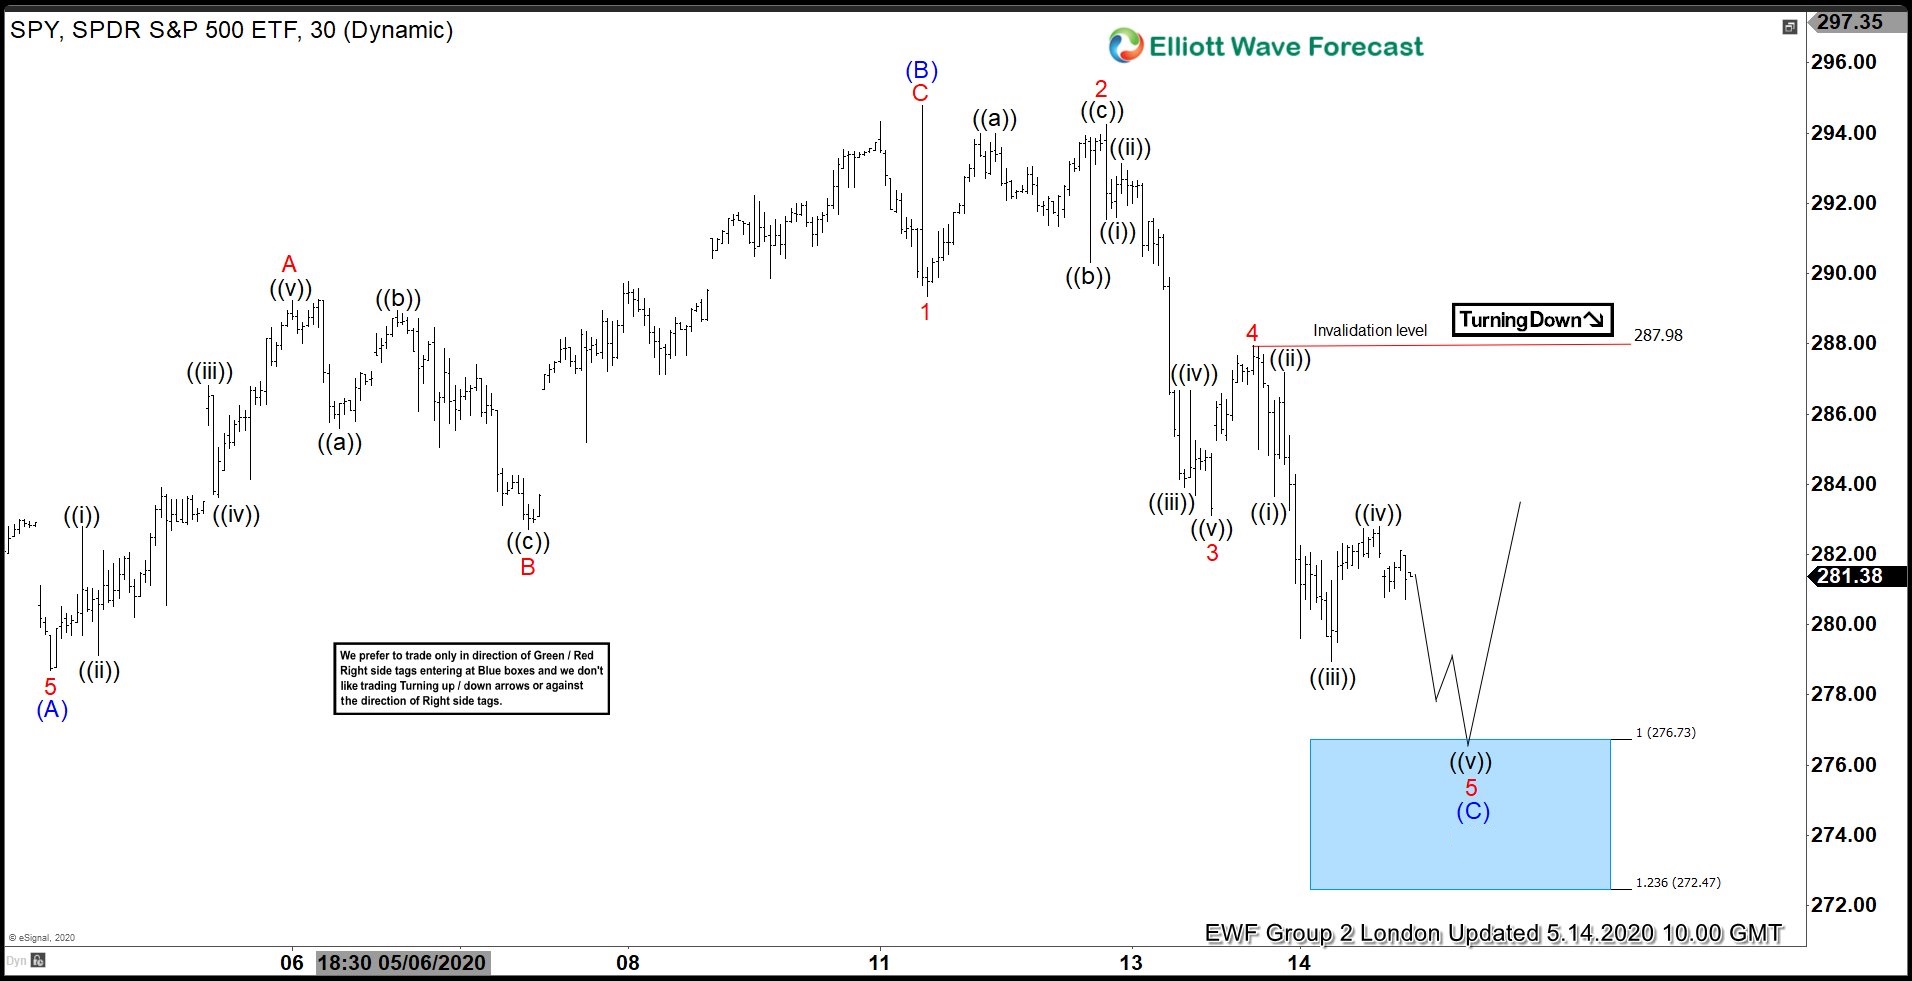
SPY Forecasting The Rally from Elliott Wave Blue Box
Read More$SPY made a sharp decline last week and our members knew that the decline was corrective and it was another opportunity for buyers to enter the market to resume the rally for new highs or produce a larger 3 waves bounce at least. In this article, we would look at the forecast from last week […]
-
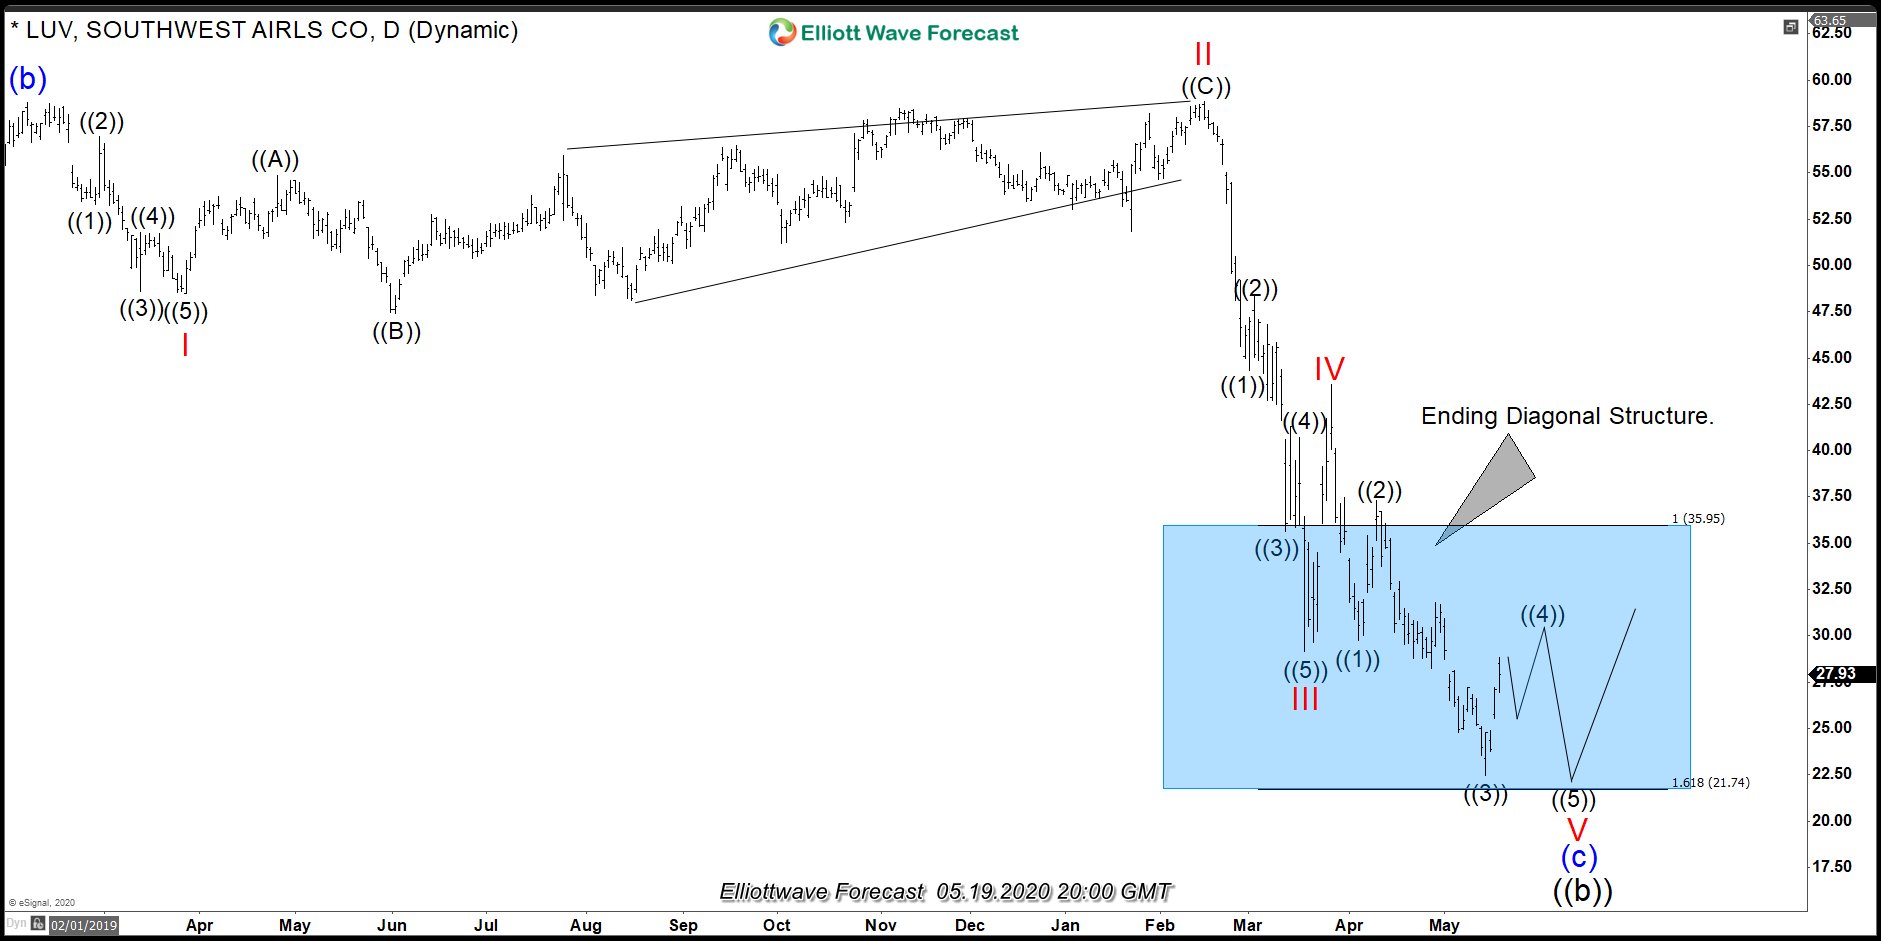
Southwest Airlines (LUV): The Ending Diagonal and World Indices
Read MoreIn this article, we will take a look at Southwest Airline (ticker: LUV) stock. The airlines industry and stock have been battered due to the corona virus. We do understand that the Fundamentals might not look great right now for the airlines industry. However, fundamentals can change in an hour, and anticipating the move is […]