

The Power of 3-7-11 and the Grand Super Cycle: How We Saw the Bullish Turn in April 2025 Back on April 9, 2025, while World Indices were dropping sharply and global sentiment had turned overwhelmingly bearish, we published an article that challenged the fear-driven narrative. We explained why selling was not the right approach and […]
-
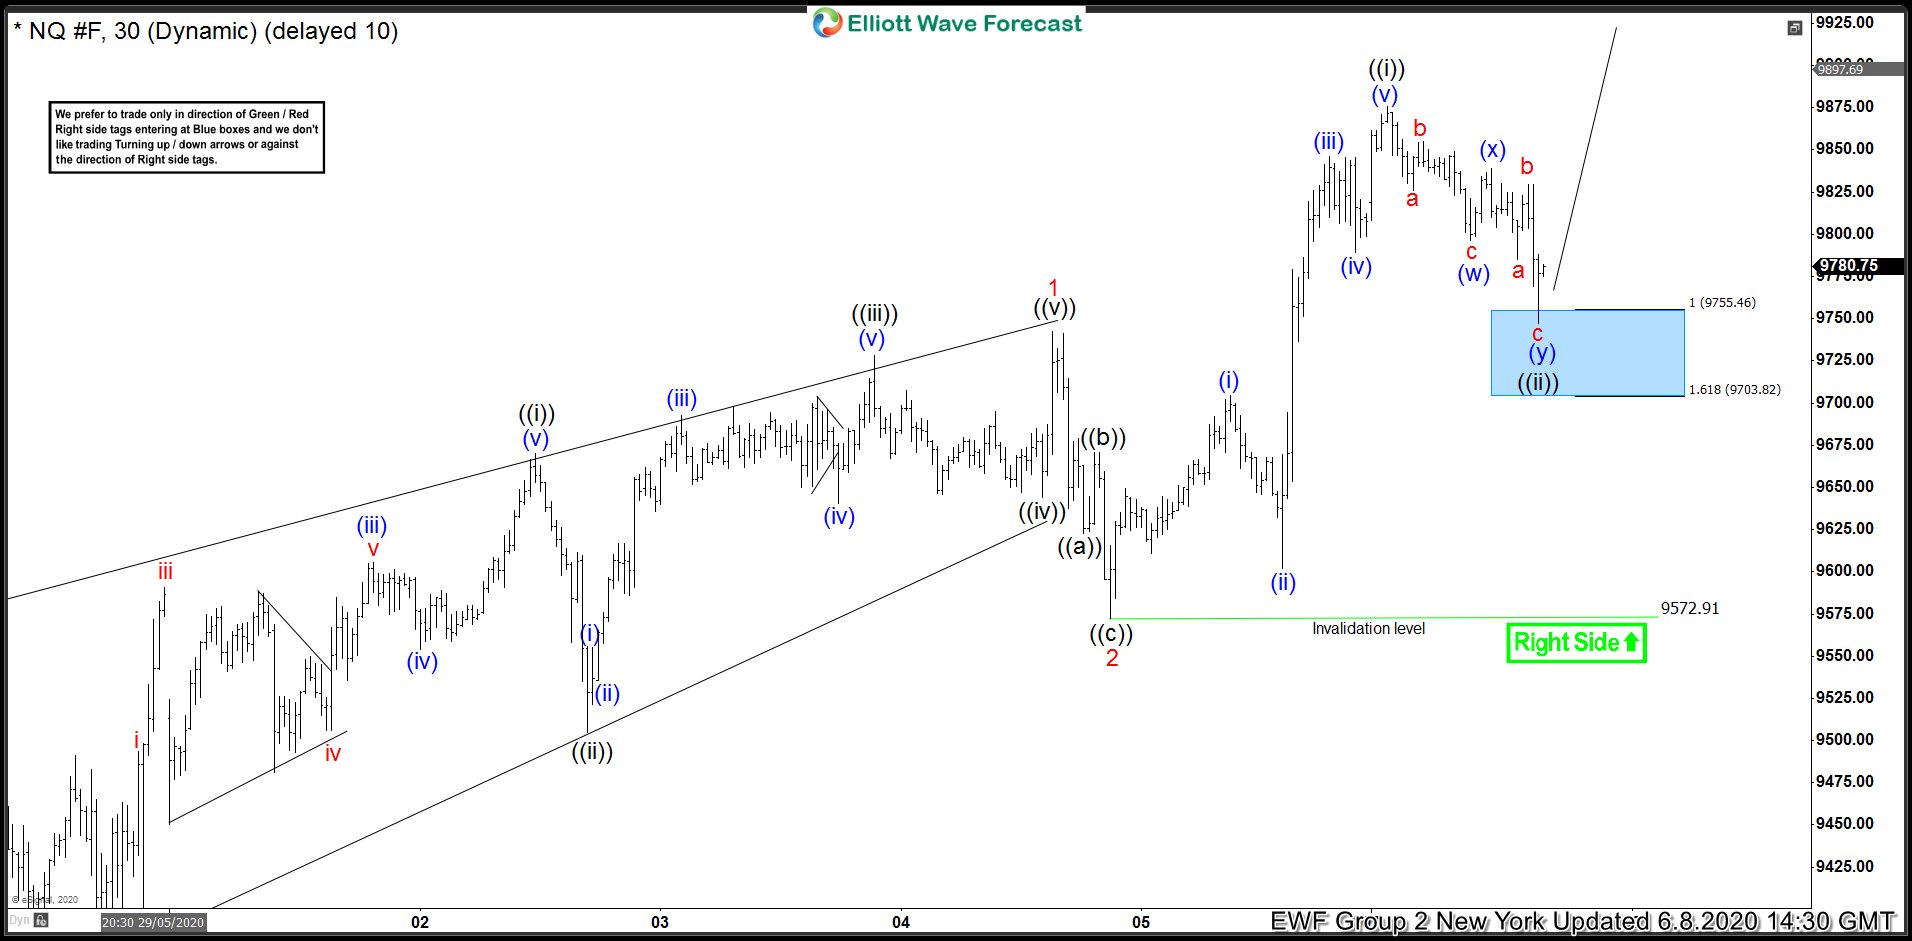
NASDAQ (NQ_F) Bounced Higher From Blue Box To All Time High
Read MoreIn this blog, we are going to take a look at the Elliott Wave chart of NASDAQ Futures (NQ_F). The 1 hour London chart update from June 8, 2020 shows that the index has ended the cycle from May 27 low at 9742.50 high. NASDAQ then did a pullback to correct that cycle, which ended […]
-
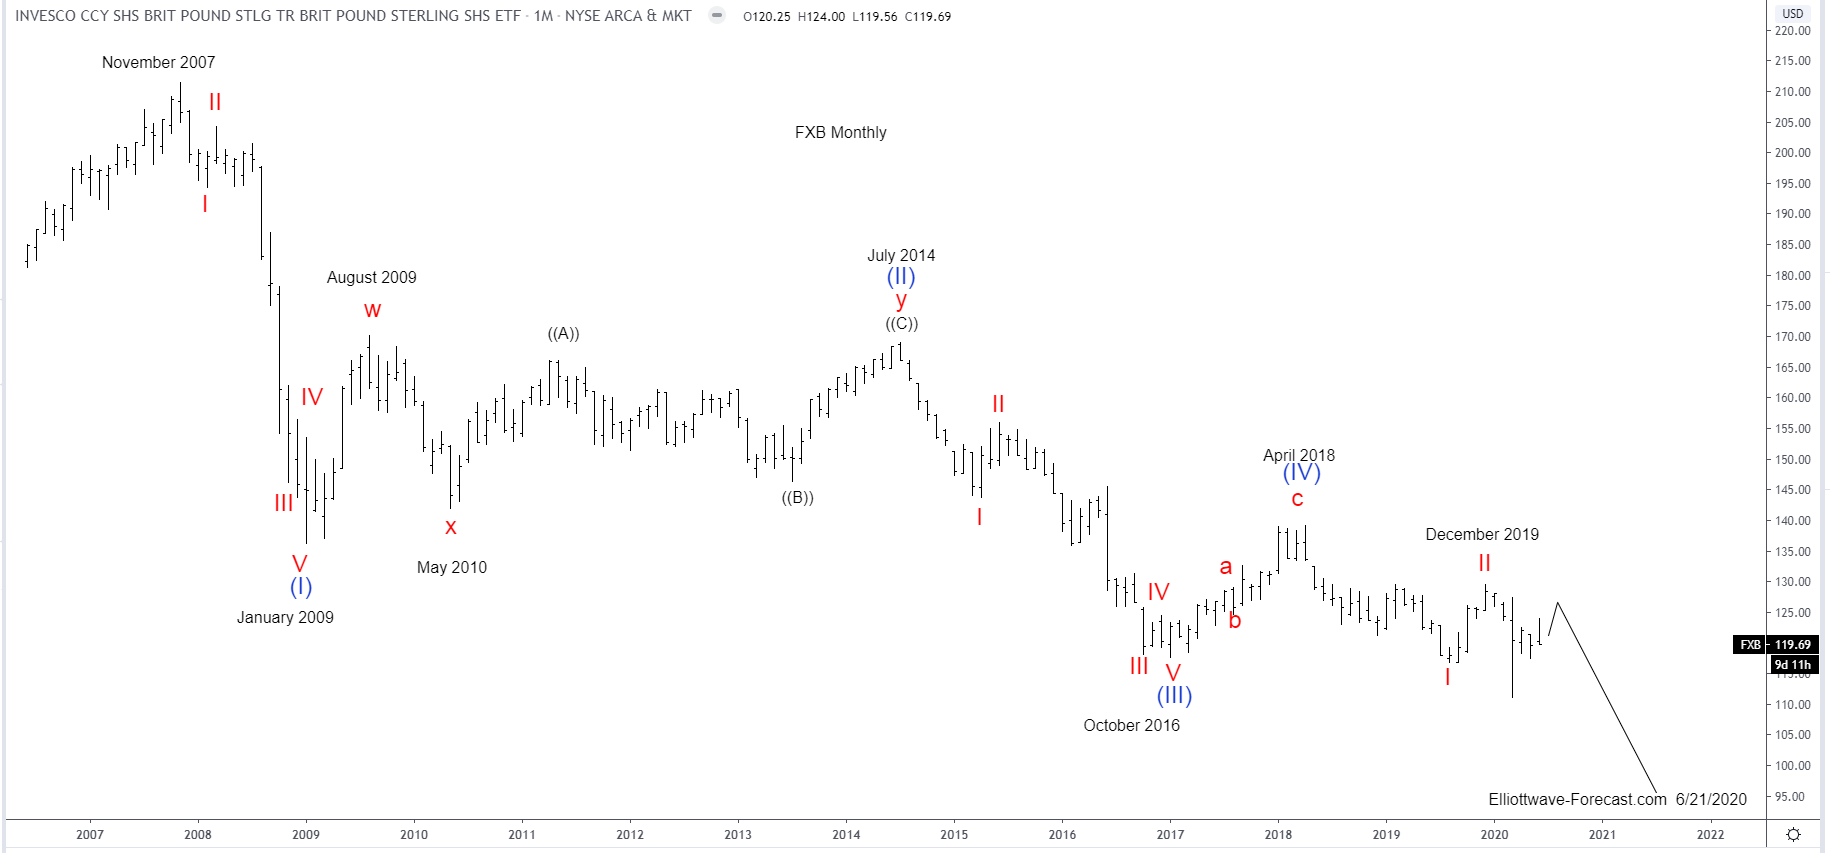
$FXB Longer Term Bearish Cycles & Elliott Wave
Read More$FXB Longer Term Bearish Cycles & Elliott Wave Firstly the British Pound Sterling tracking ETF fund FXB inception date was 6/21/2006. The bearish cycle lower from the November 2007 highs in FXB is the focus of this analysis. The British Pound Sterling has been the currency of the Bank of England since 1694. Considering that date was back […]
-
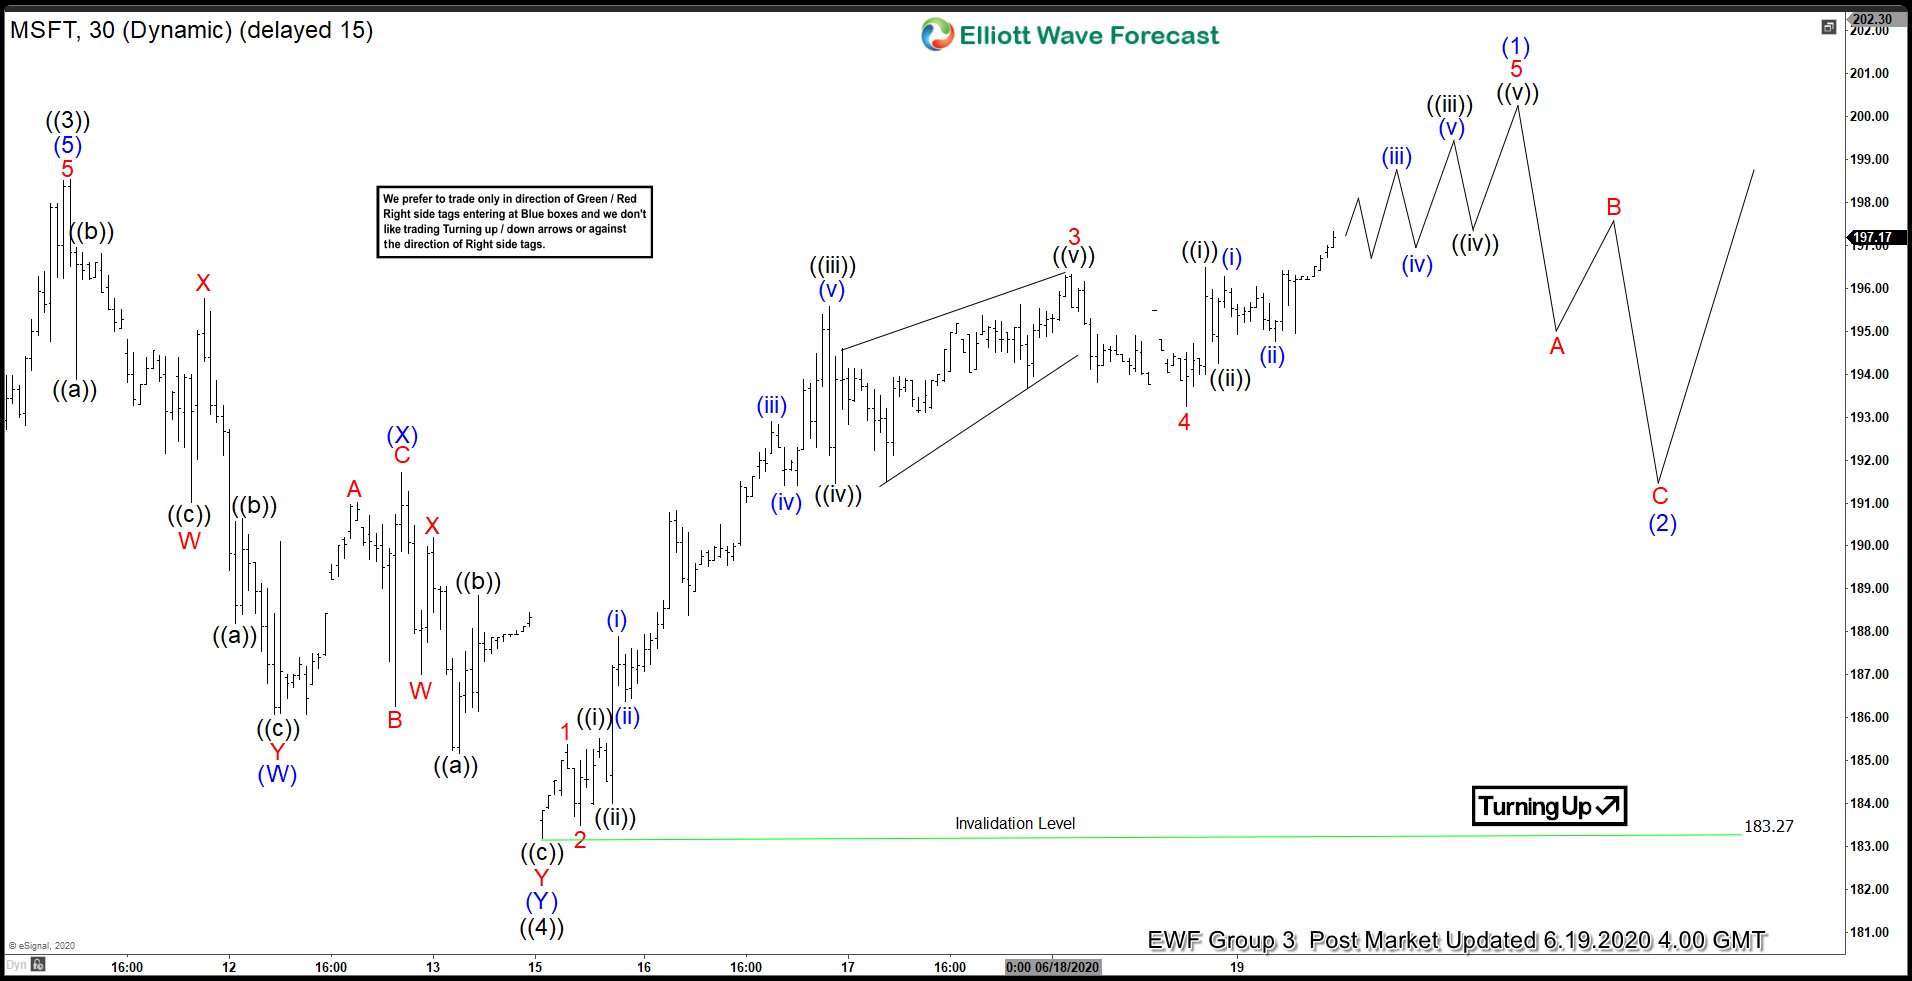
Elliott Wave View: Microsoft (MSFT) Cycle from March Low Still In Progress
Read MoreMicrosoft Corporation ( MSFT ) is currently still extending higher from 3.23.2020 low. The stock reached all time high on 6.11.2020 and ended wave ((3)) at 198.52 high. From there, MSFT did a pullback in wave ((4)) as a Double Three Elliott Wave structure. Down from 6.11.2020 high, wave (W) ended at 186.07 low. The […]
-
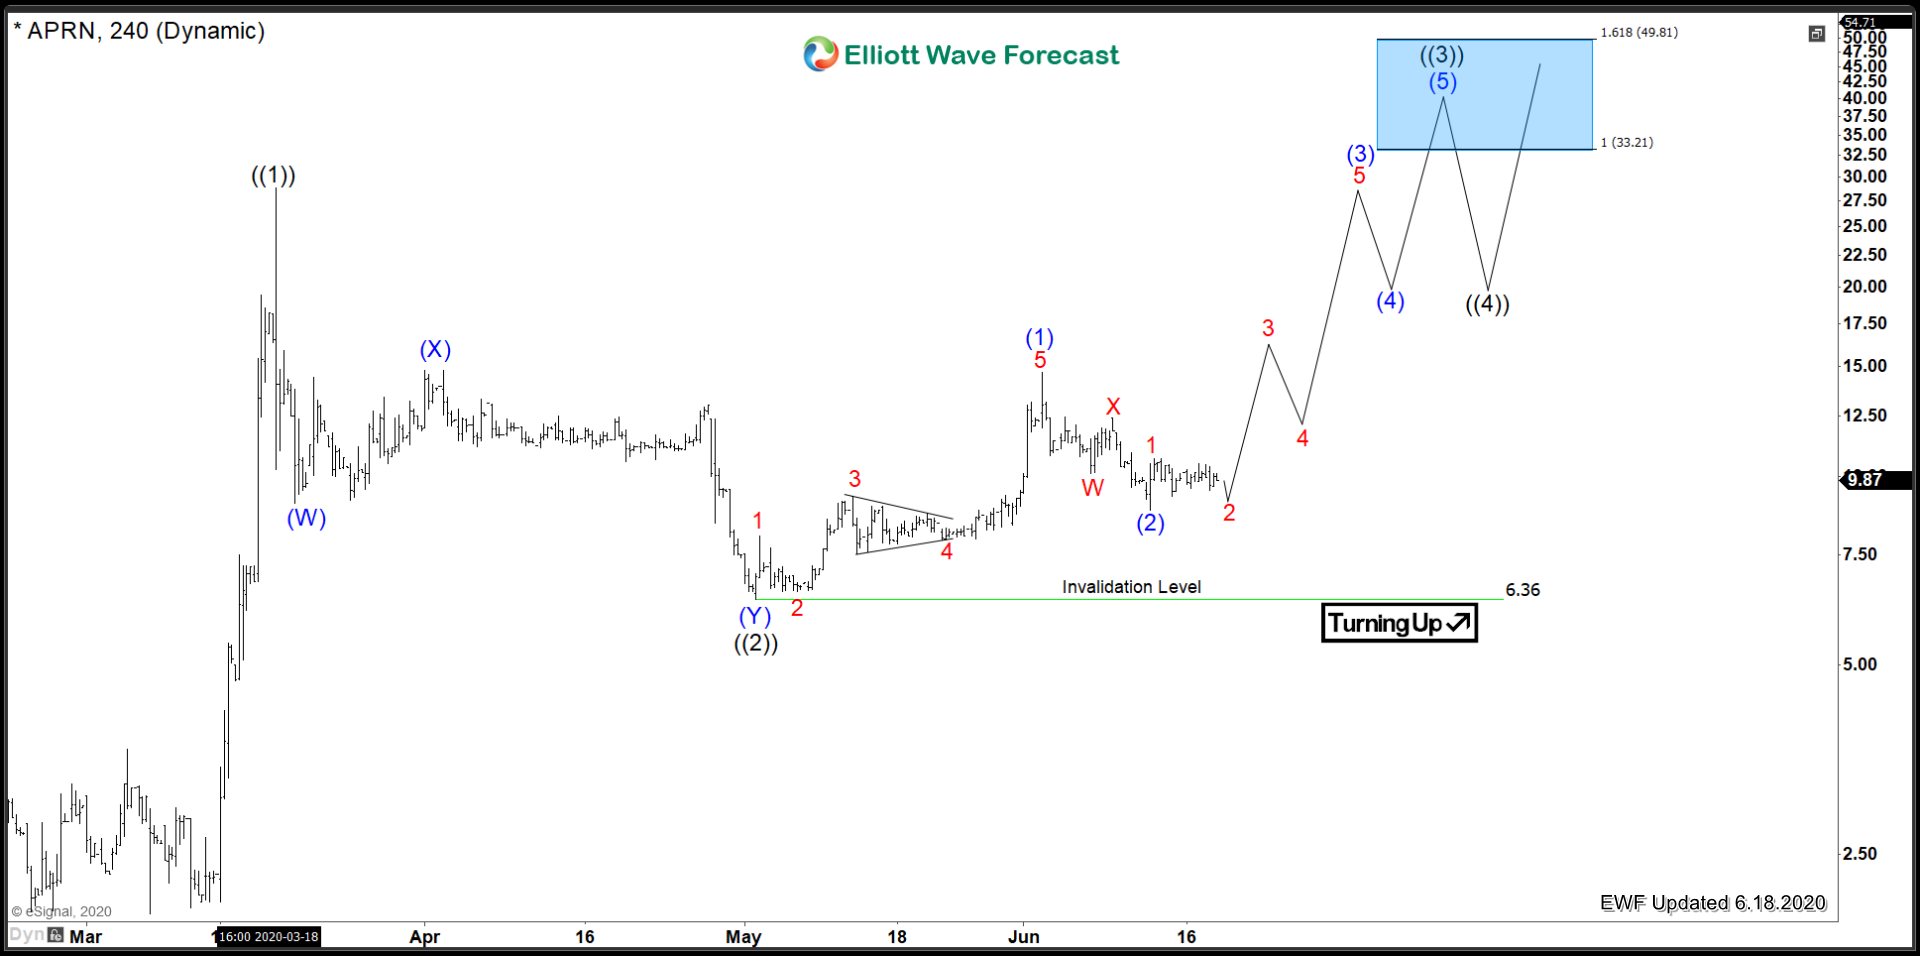
Blue Apron Holdings ($APRN) Looking To Rally
Read MoreThe next entry in the theme of Corona Virus stocks is Blue Apron Holdings Inc ($APRN). Biotech and software are not the only sectors benefitting greatly from the COVID-19 outbreak. The food delivery services are also making large gains since the lows. Blue Apron has had an unbelievable run, let’s take a look at the […]
-
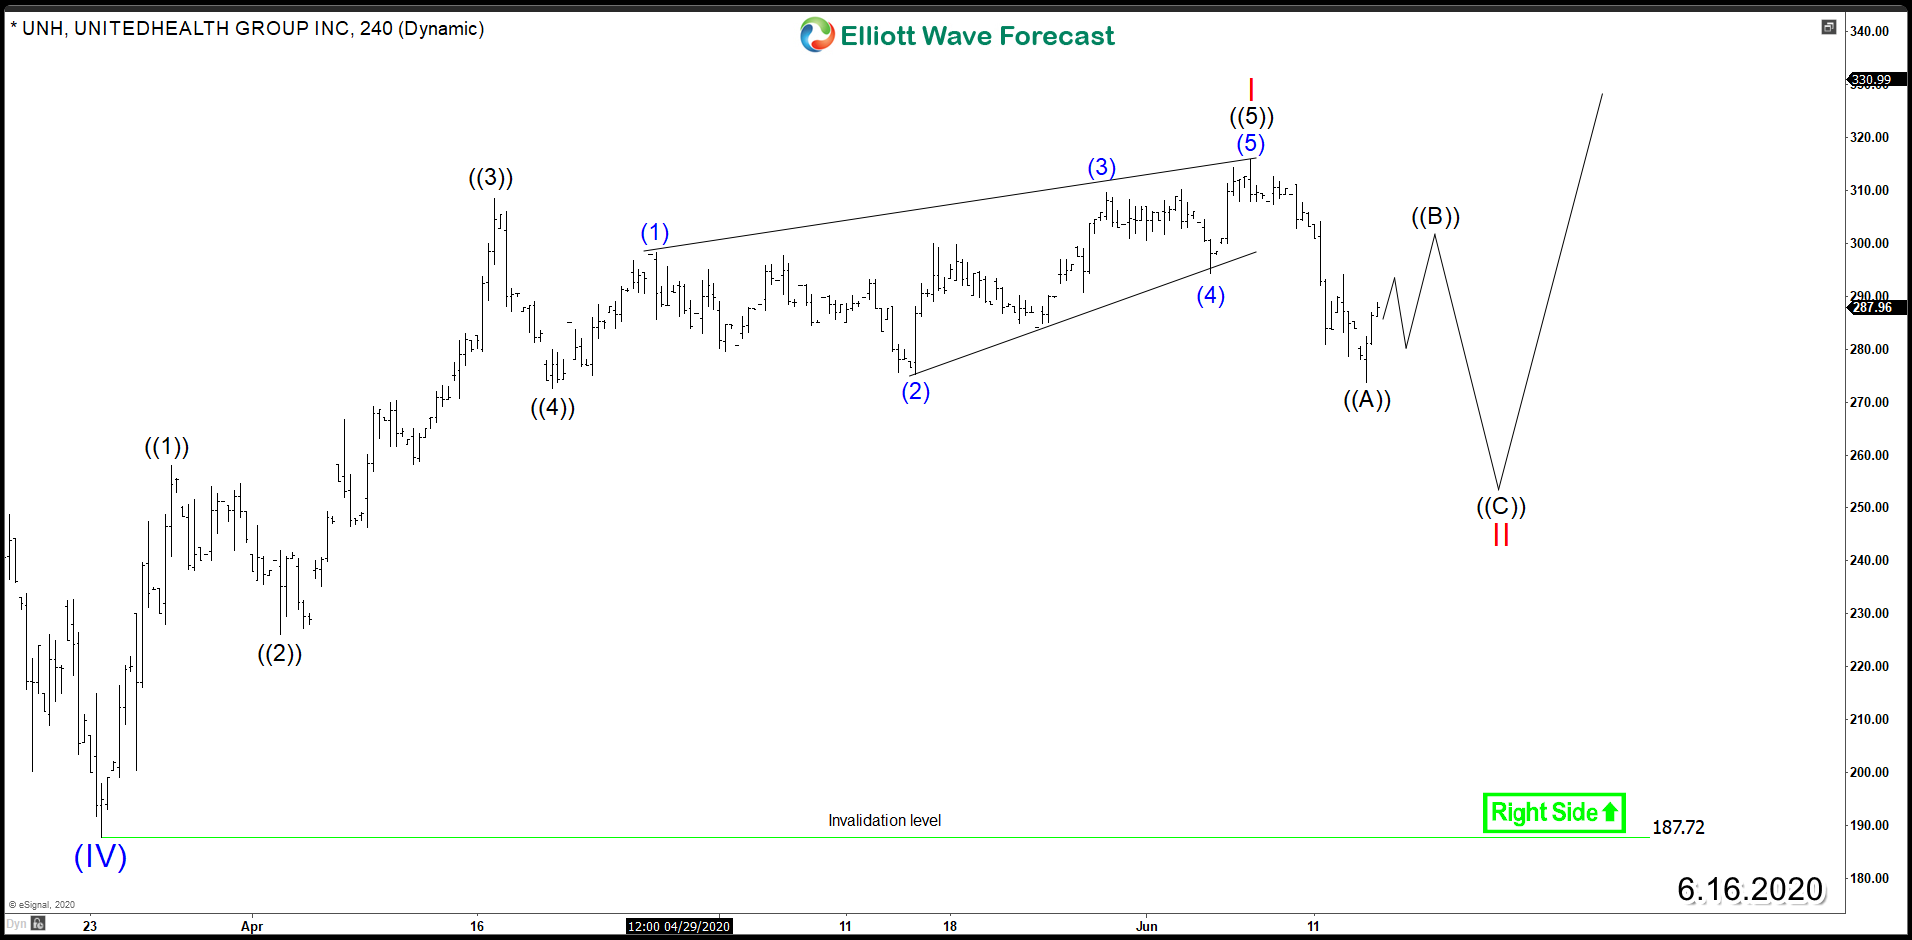
UnitedHealth Group (NYSE: UNH) Supported Pullback in Progress
Read MoreUnitedHealth Group Incorporated (NYSE: UNH) is the largest healthcare company in the world by revenue providing health care products and insurance services. UNH established an impulsive 5 waves advance from 3/25 low allowing the stock to rally to new all time highs last April followed by another move higher early this month. Based on the Elliott Wave Theory, […]
-
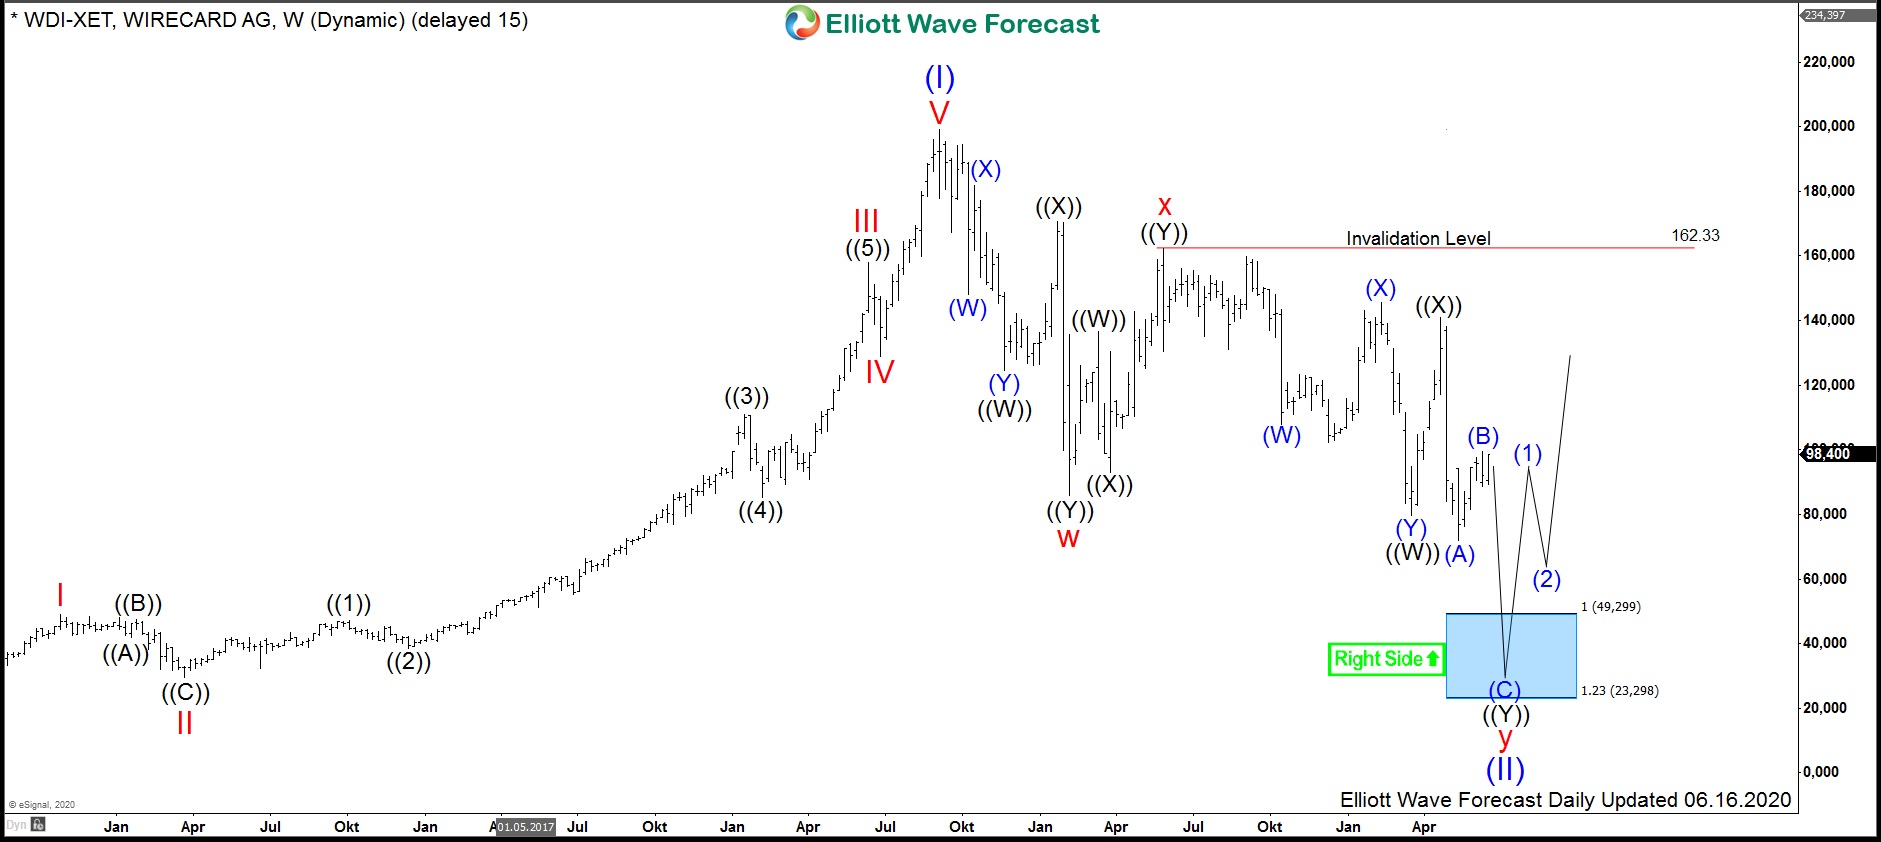
$WDI : Wirecard AG soon to become a once-in-a-lifetime opportunity
Read MoreWirecard AG is a german provider of financial services and payment processes. Founded in 1999 and headquartered in Aschheim (Munich), Germany, the company is since 2018 a part of the DAX30 index. After a respectable rally towards 199.4 in September 2018, the shares plunged few months later in February 2019 towards 85.6. Some still believe, […]