

The Power of 3-7-11 and the Grand Super Cycle: How We Saw the Bullish Turn in April 2025 Back on April 9, 2025, while World Indices were dropping sharply and global sentiment had turned overwhelmingly bearish, we published an article that challenged the fear-driven narrative. We explained why selling was not the right approach and […]
-
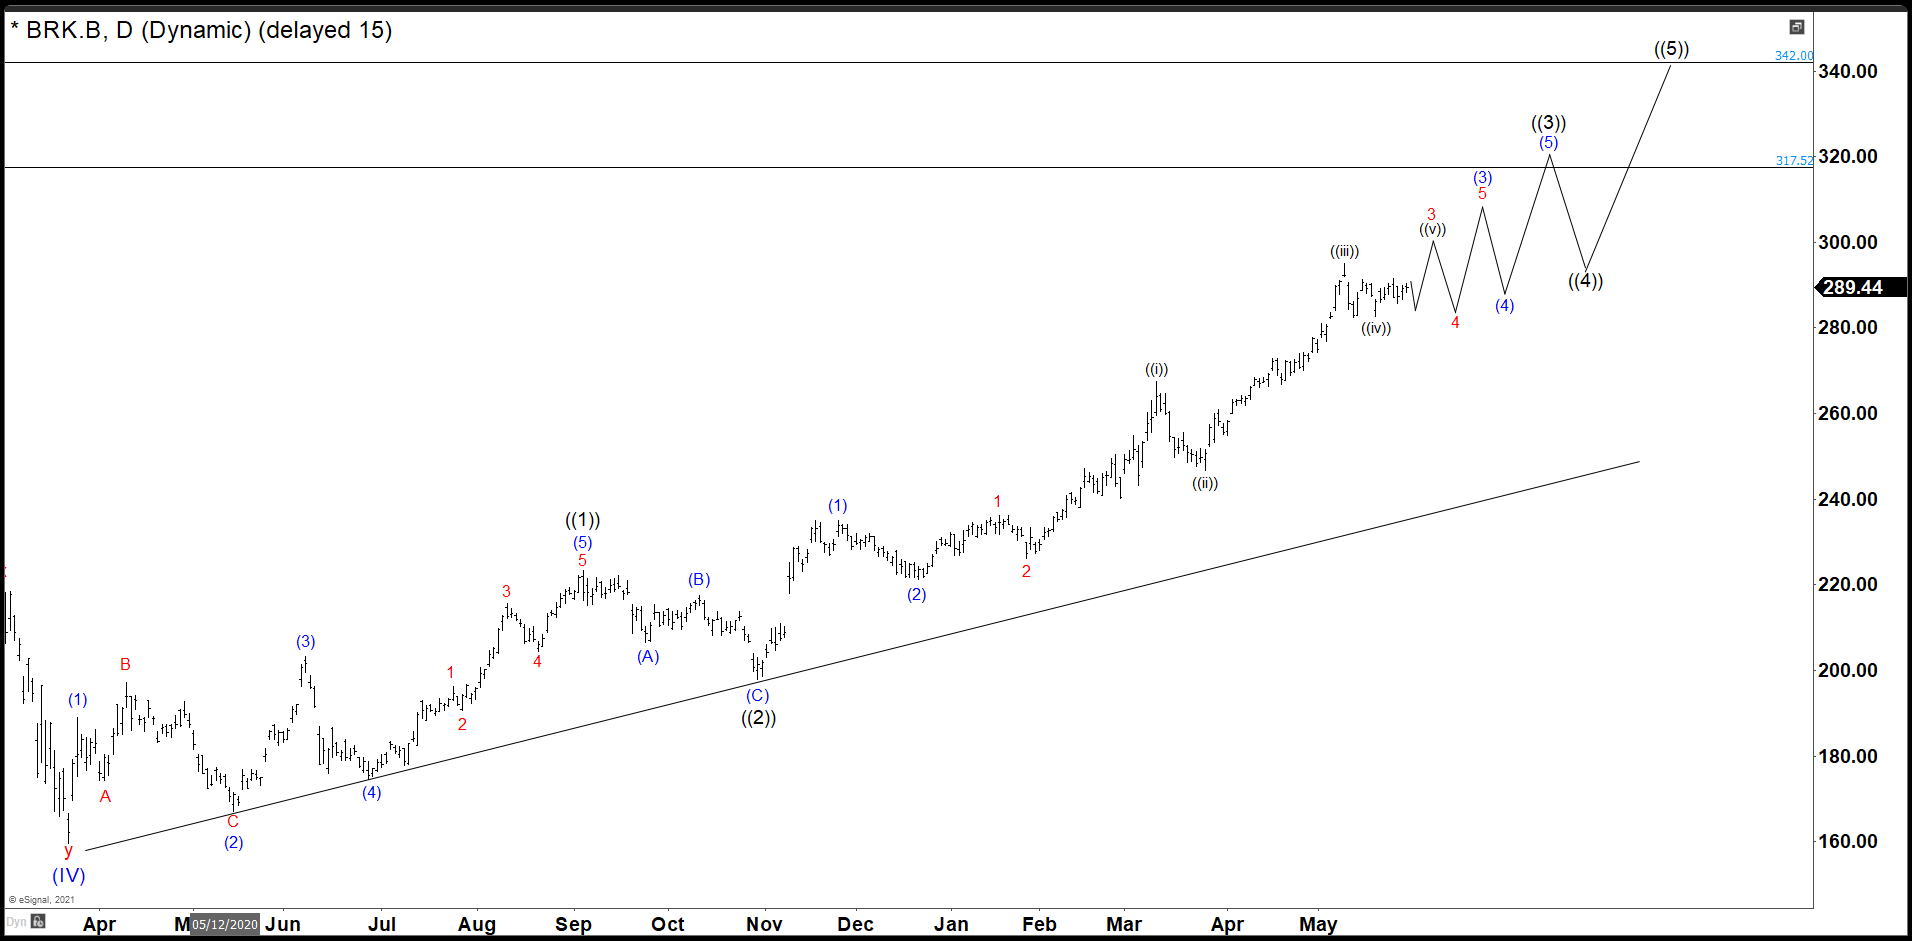
Berkshire Hathaway Inc. Followed The Path Entering in a Ranging Zone
Read MoreSince the crash of March 2020, all stocks have tried to recover what they lost, and Berkshire Hathaway was no exception. BRK.B did not only recover the lost, but It also reached historic highs. Now, it is building an impulse from March 2020 lows with a target to $318 – $342 area. Target measured from […]
-
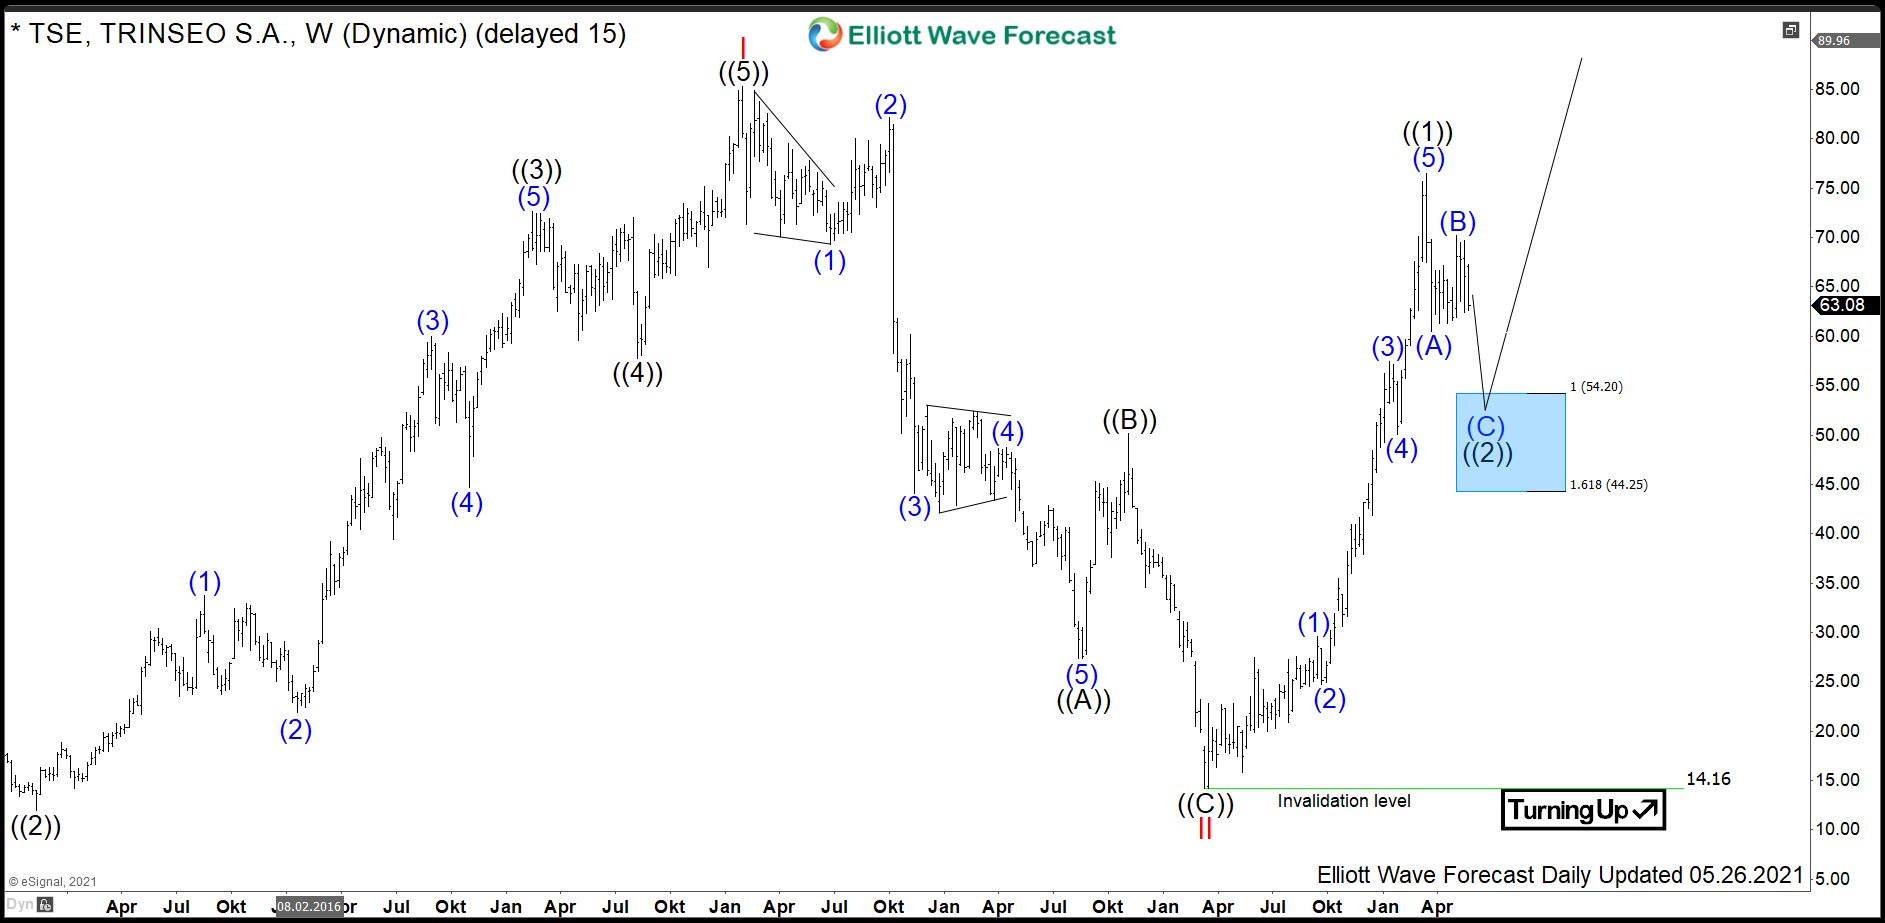
$TSE: Materials Manufacturer Trinseo Should Continue See Buyers
Read MoreTrinseo (formerly Styron) is a global materials company based in Berwyn, Pennsylvania, USA. The stock being a component of the Russel2000 index can be traded under ticker $TSE at NYSE. Trinseo offers a broad line of plastics, latex and synthetic rubber. The primary markets are automotive, appliances, electronics, packaging, tire industries, among others. Currently, we […]
-
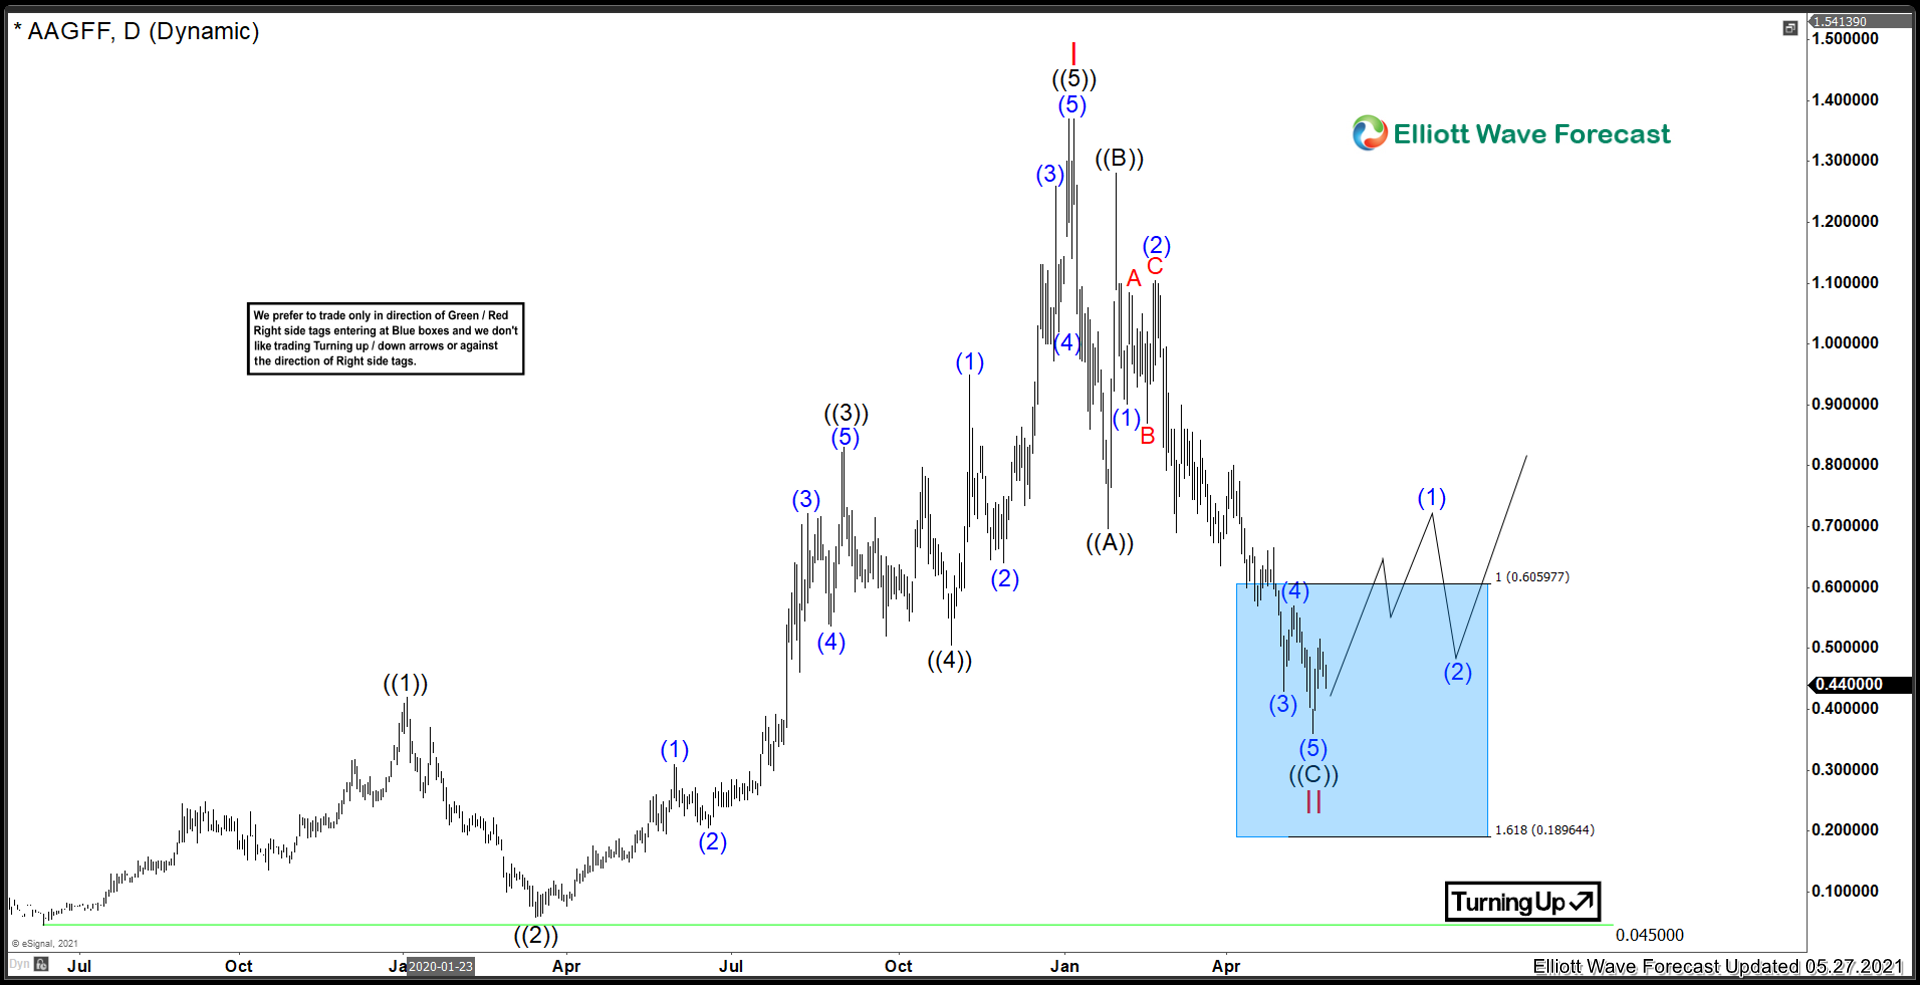
Aftermath Silver ($AAGFF $AAG.CA) Reaching The Blue Box
Read MoreAfter Gold made new all time highs in August 2020 the precious metals sector got a much needed incomplete bullish sequence confirmation. Aftermath Silver Corporation is in a good spot to take advantage of possible USDX weakness, and precious metals strength in the future. It is a penny stock, and as such, has a very […]
-
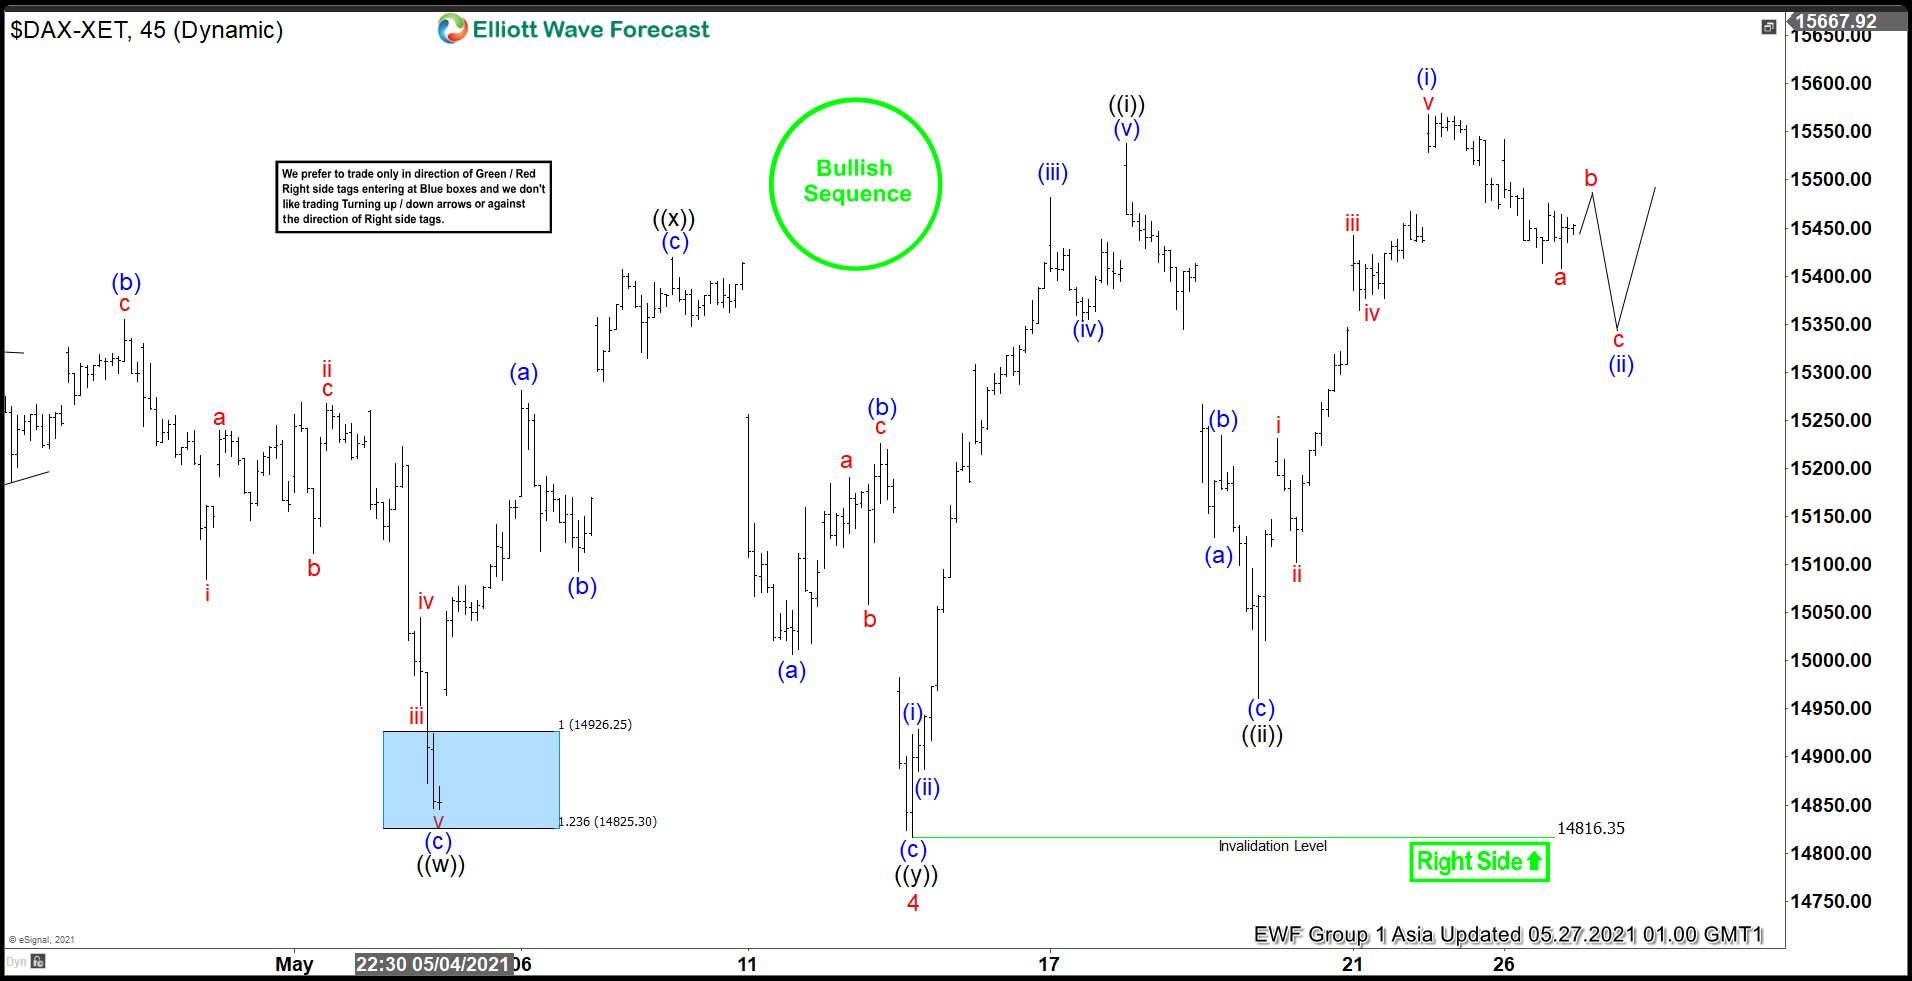
Elliott Wave View: DAX Bullish Sequence Remains Incomplete
Read MoreDAX shows incomplete bullish sequence favoring more upside. This article and video look at the Elliott Wave path for the Index.
-
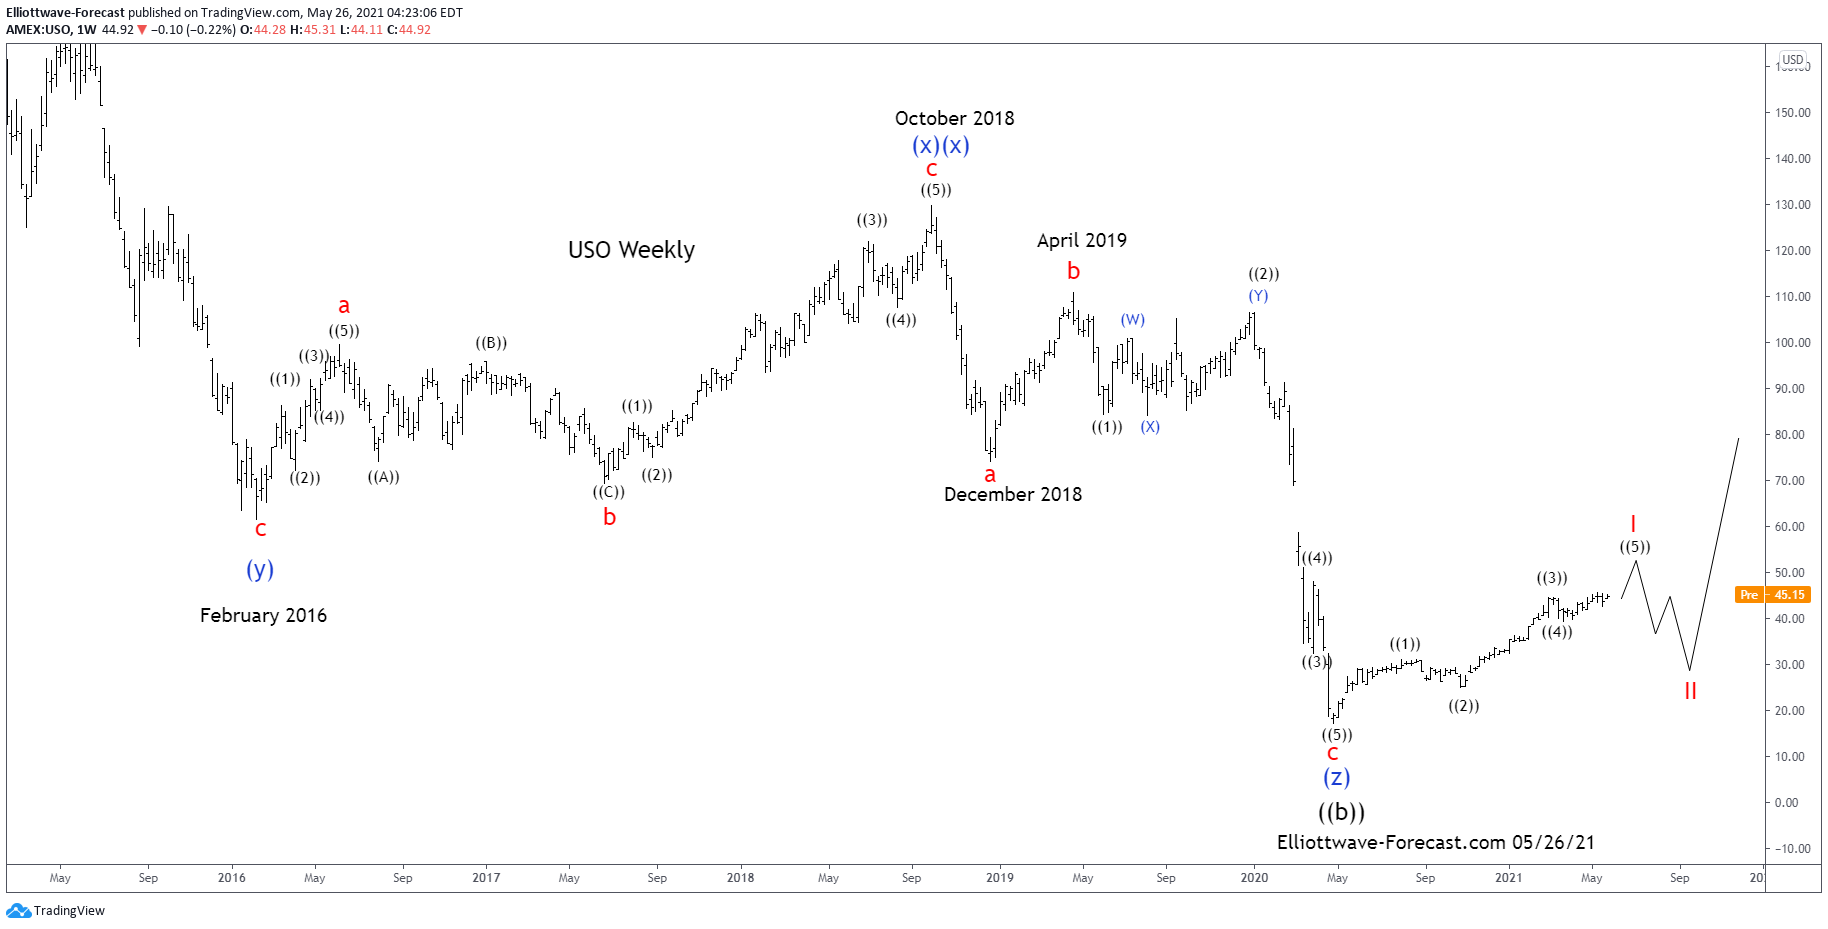
United States Oil Fund Elliott Wave & Long Term Cycles $USO
Read MoreUnited States Oil Fund Elliott Wave & Long Term Cycles $USO Firstly the USO instrument inception date was 4/10/2006. CL_F Crude Oil put in an all time high at 147.27 in July 2008. USO put in an all time high at 953.36 in July 2008 noted on the monthly chart. The decline from there into the […]
-
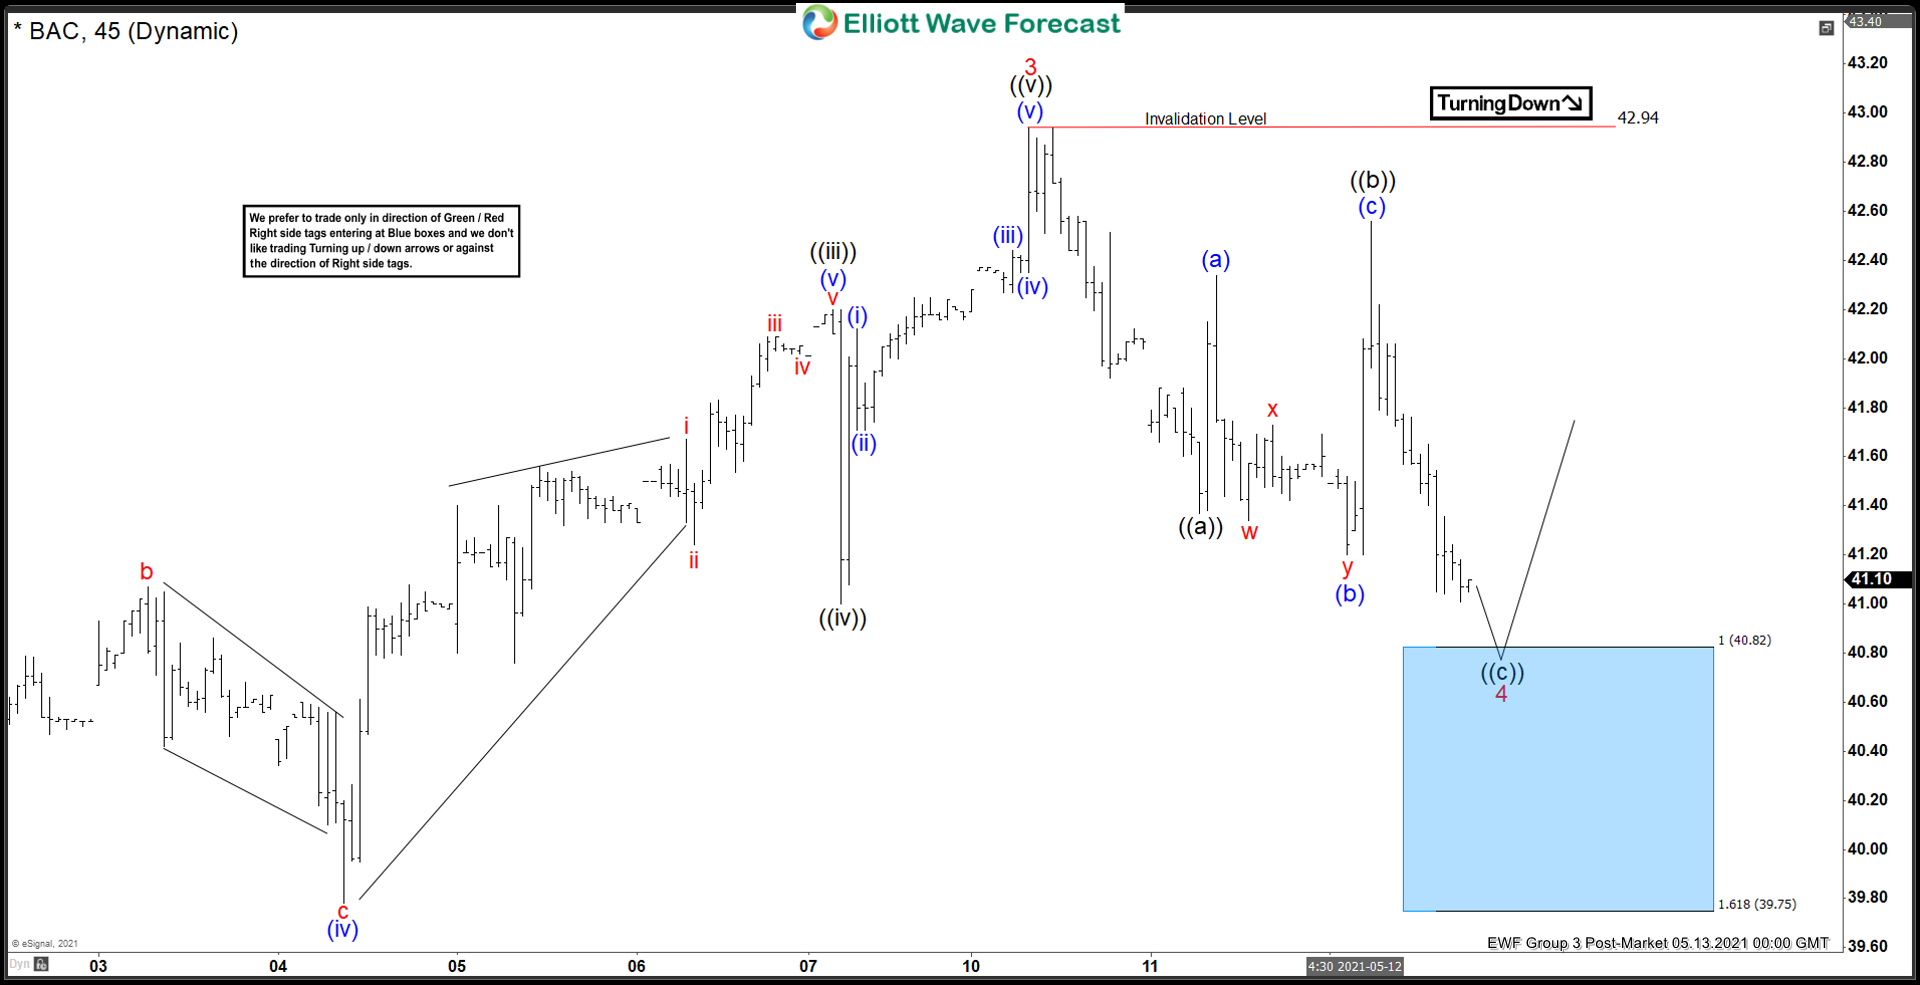
BAC Elliott Wave View: Forecasting The Wave 4 Pullback
Read MoreIn this blog, we take a look at the past performance of 1 hour Elliott Wave charts of BAC In which our members took advantage of the blue box areas.