

The Power of 3-7-11 and the Grand Super Cycle: How We Saw the Bullish Turn in April 2025 Back on April 9, 2025, while World Indices were dropping sharply and global sentiment had turned overwhelmingly bearish, we published an article that challenged the fear-driven narrative. We explained why selling was not the right approach and […]
-
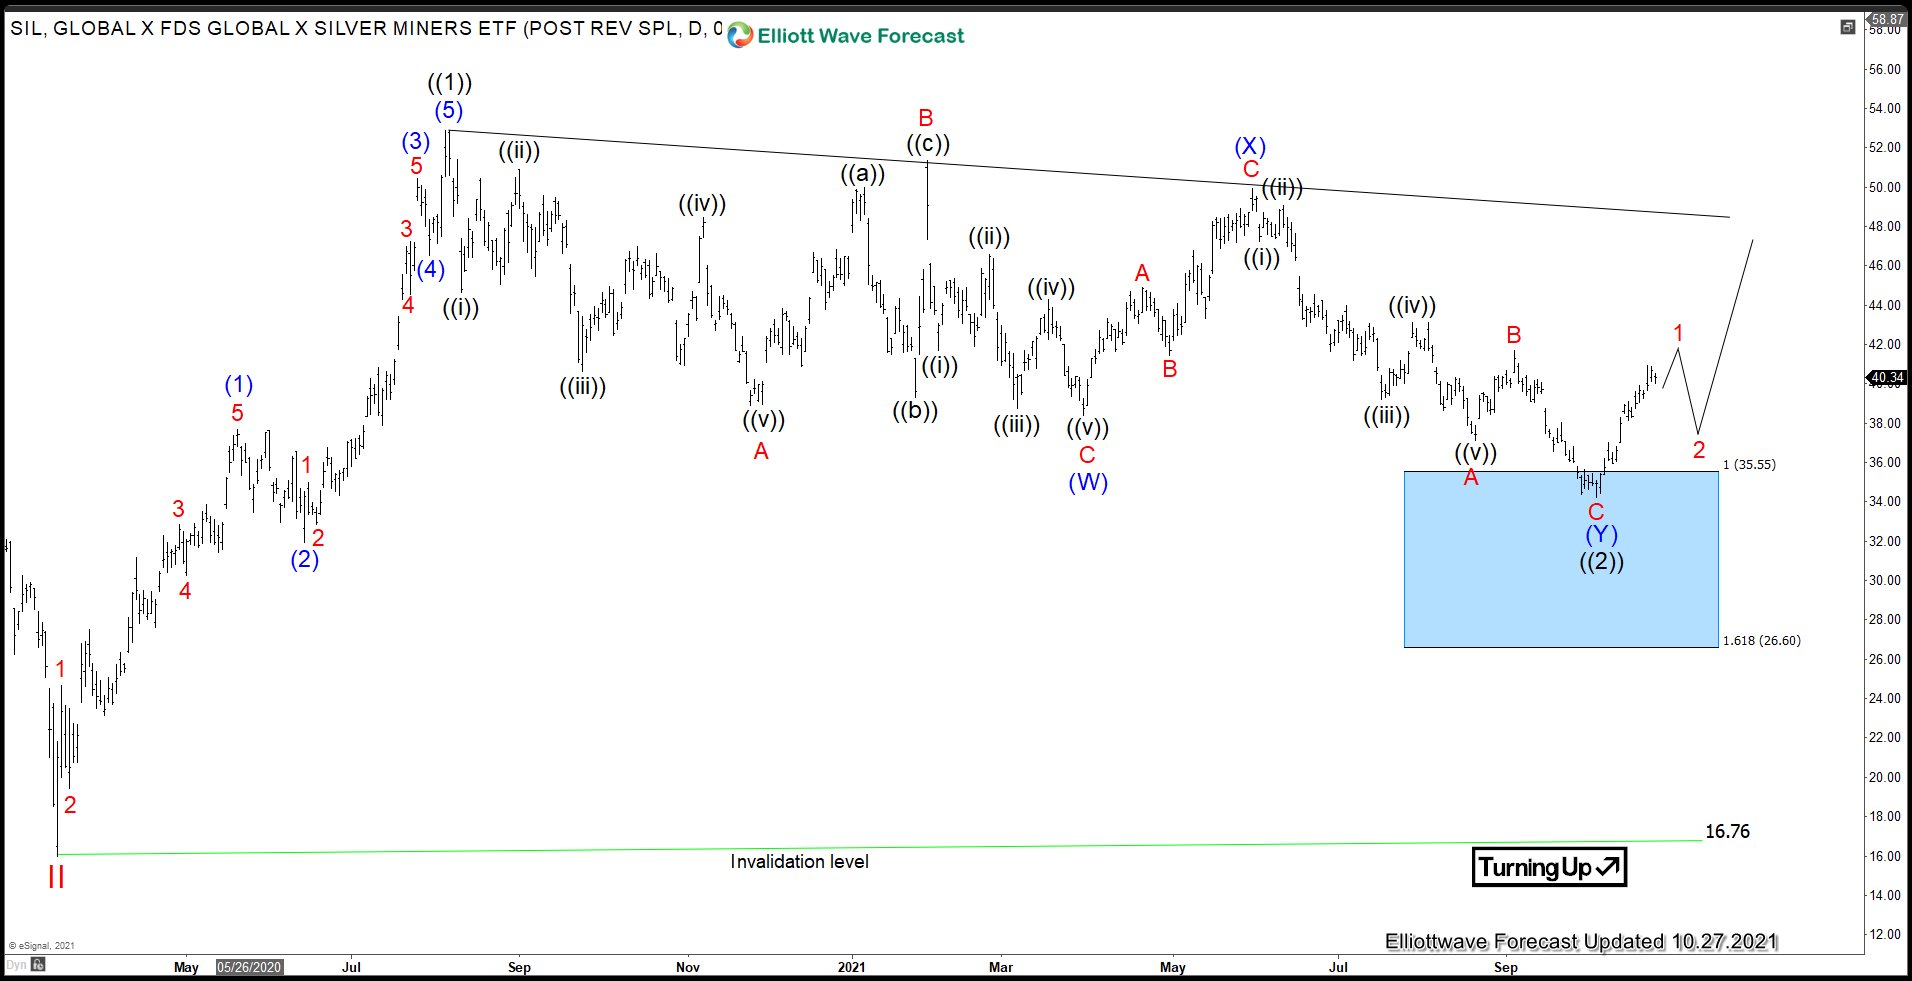
Silver Miners ETF (SIL) Has Ended Correction
Read MoreIn our article at the end of last month, we warned that Silver Miners ETF (SIL) has already reached support area. Thus the ETF is ready to turn higher anytime and rally at least in 3 waves. Now 1 month later, the ETF did turn higher from the blue box and it’s still in the early […]
-
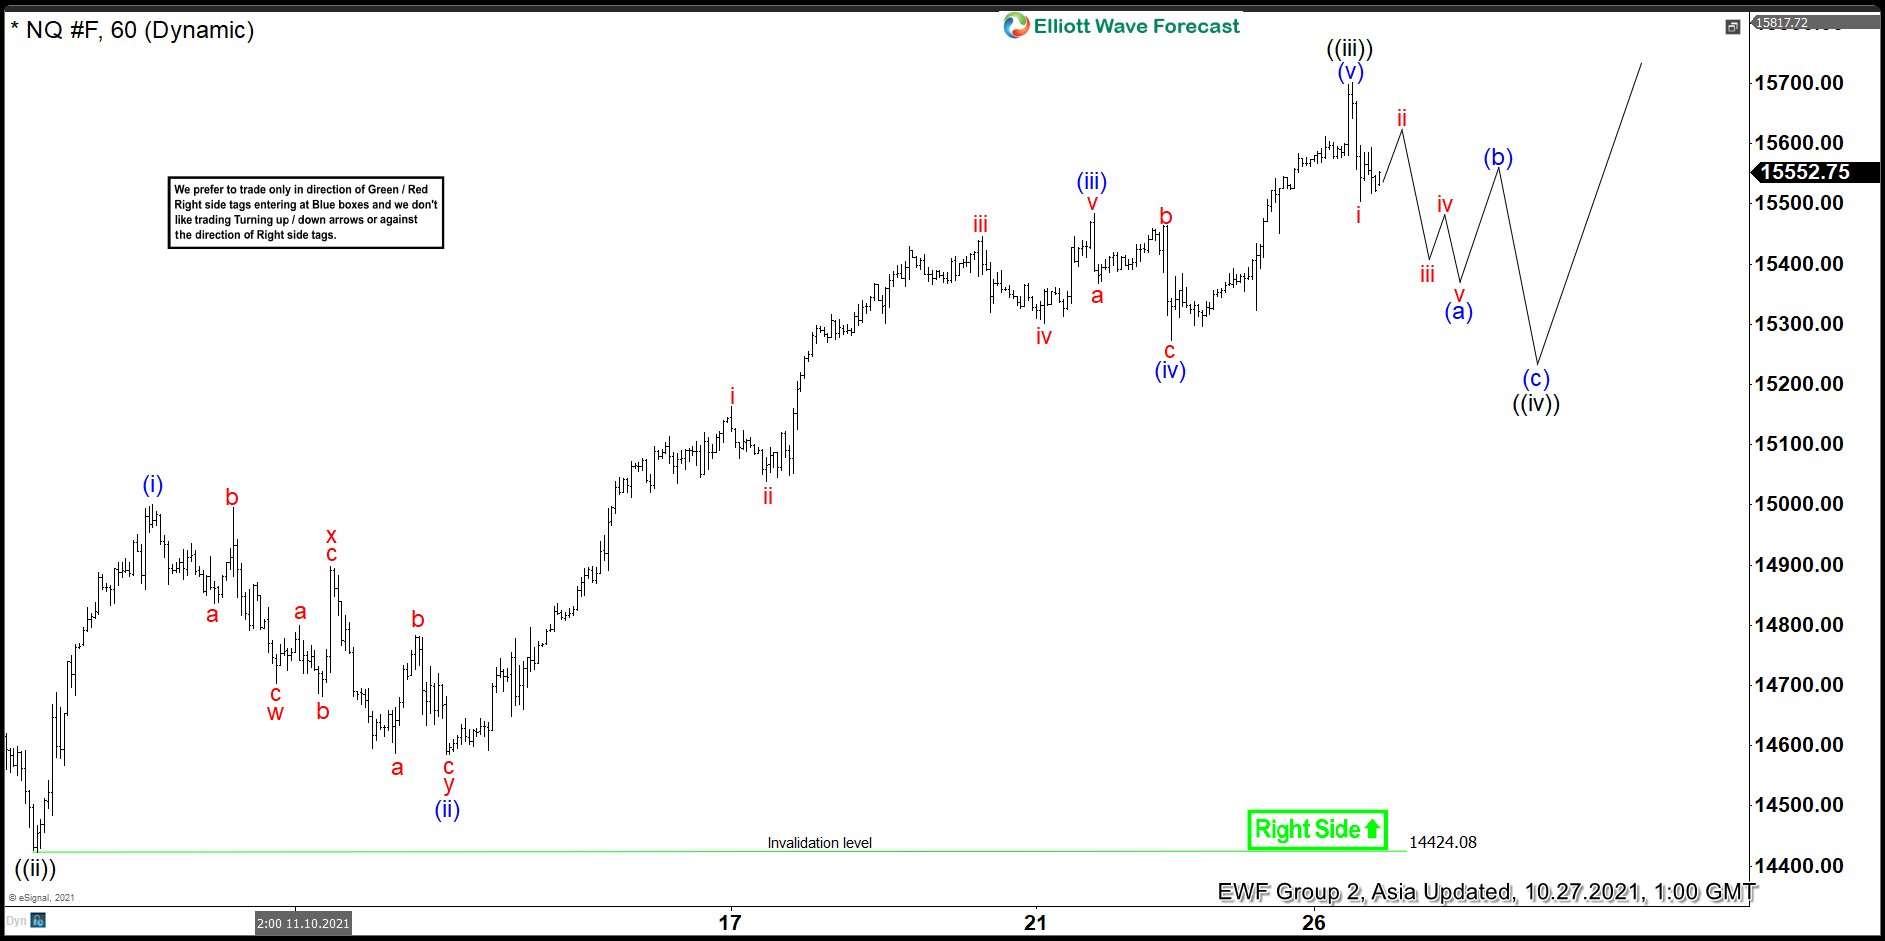
Elliott Wave View: Nasdaq (NQ) Should Continue Higher
Read MoreNasdaq (NQ) shows an impulsive structure from October 5 low, looking for more upside. This article and video look at the Elliott Wave path.
-
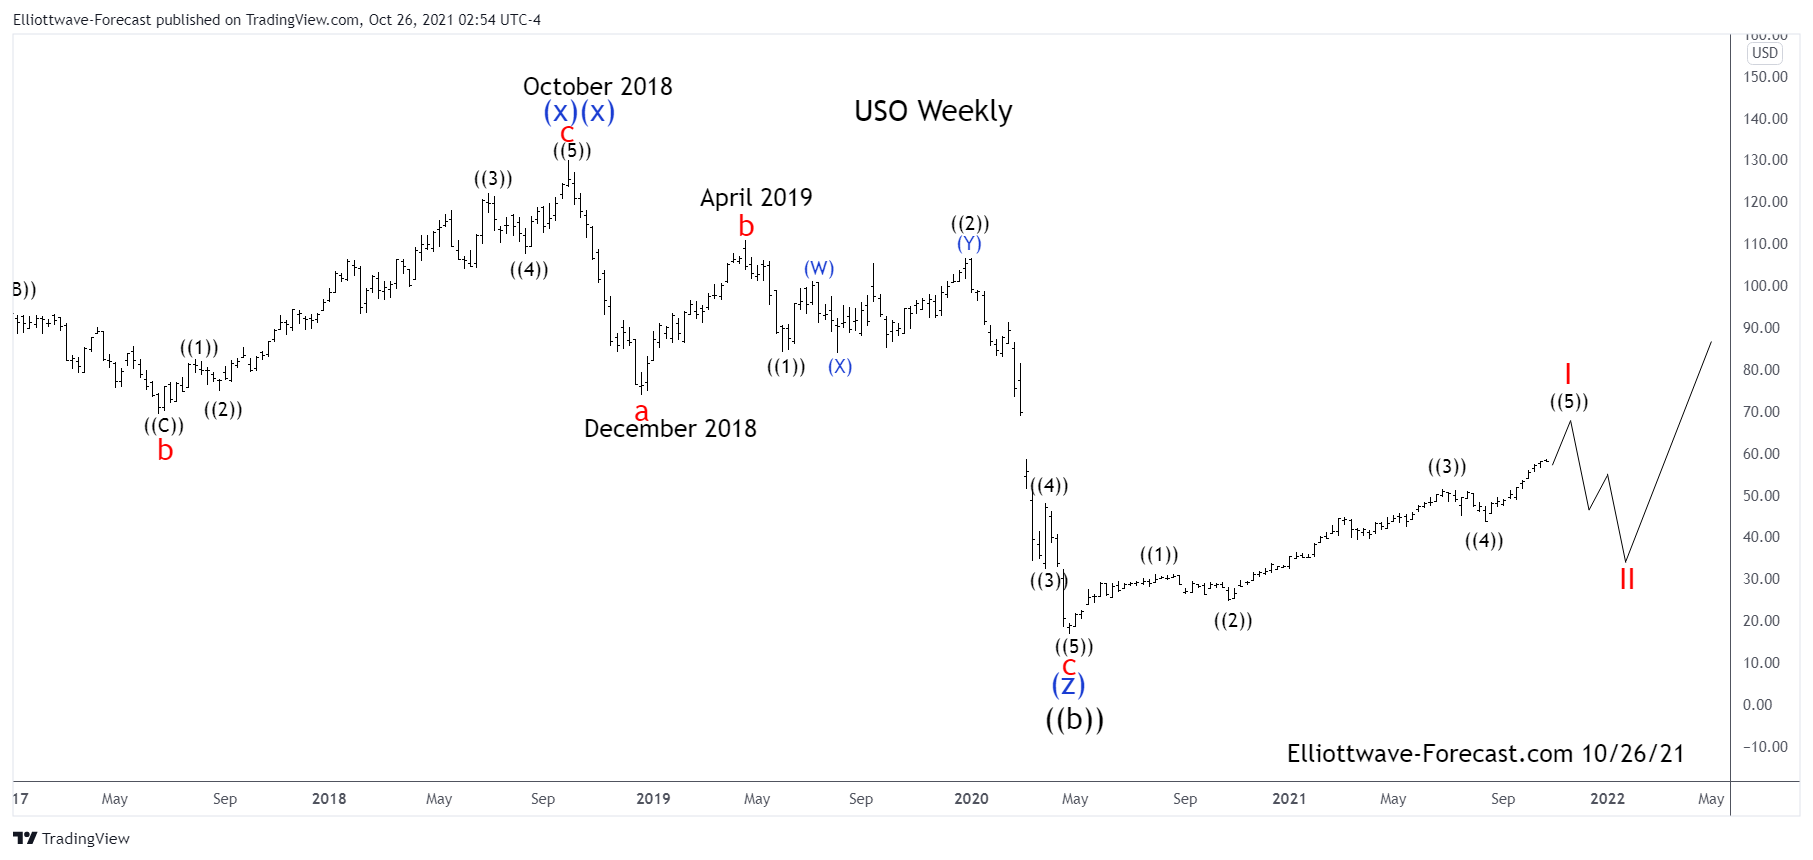
$USO United States Oil Fund Long Term Cycles & Elliott Wave Analysis
Read More$USO United States Oil Fund Long Term Cycles & Elliott Wave Analysis Firstly the USO instrument inception date was 4/10/2006. CL_F Crude Oil put in an all time high at 147.27 in July 2008. USO put in an all time high at 953.36 in July 2008 noted on the monthly chart. The decline from there into […]
-
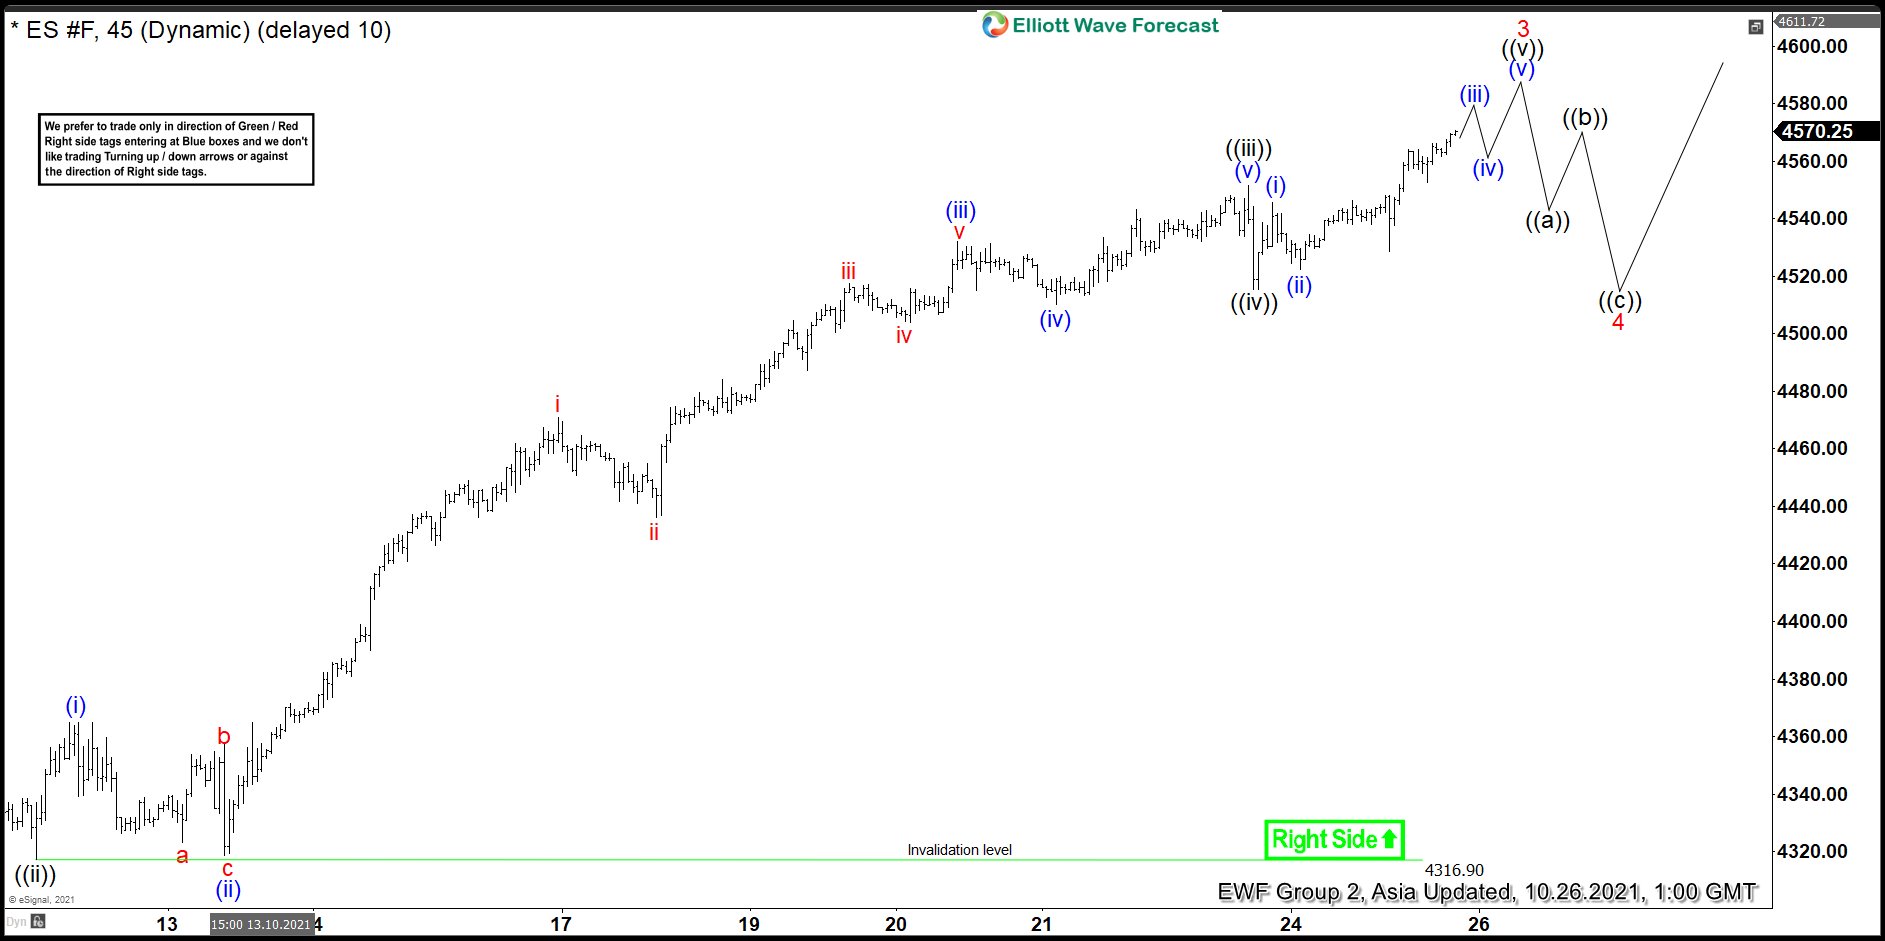
Elliott Wave View: S&P 500 Futures (ES) Breaking to New High
Read MoreS&P 500 Futures (ES) rally from October 1 low is in progress as an impulse and can see further upside. This article and video look at the Elliott Wave path.
-
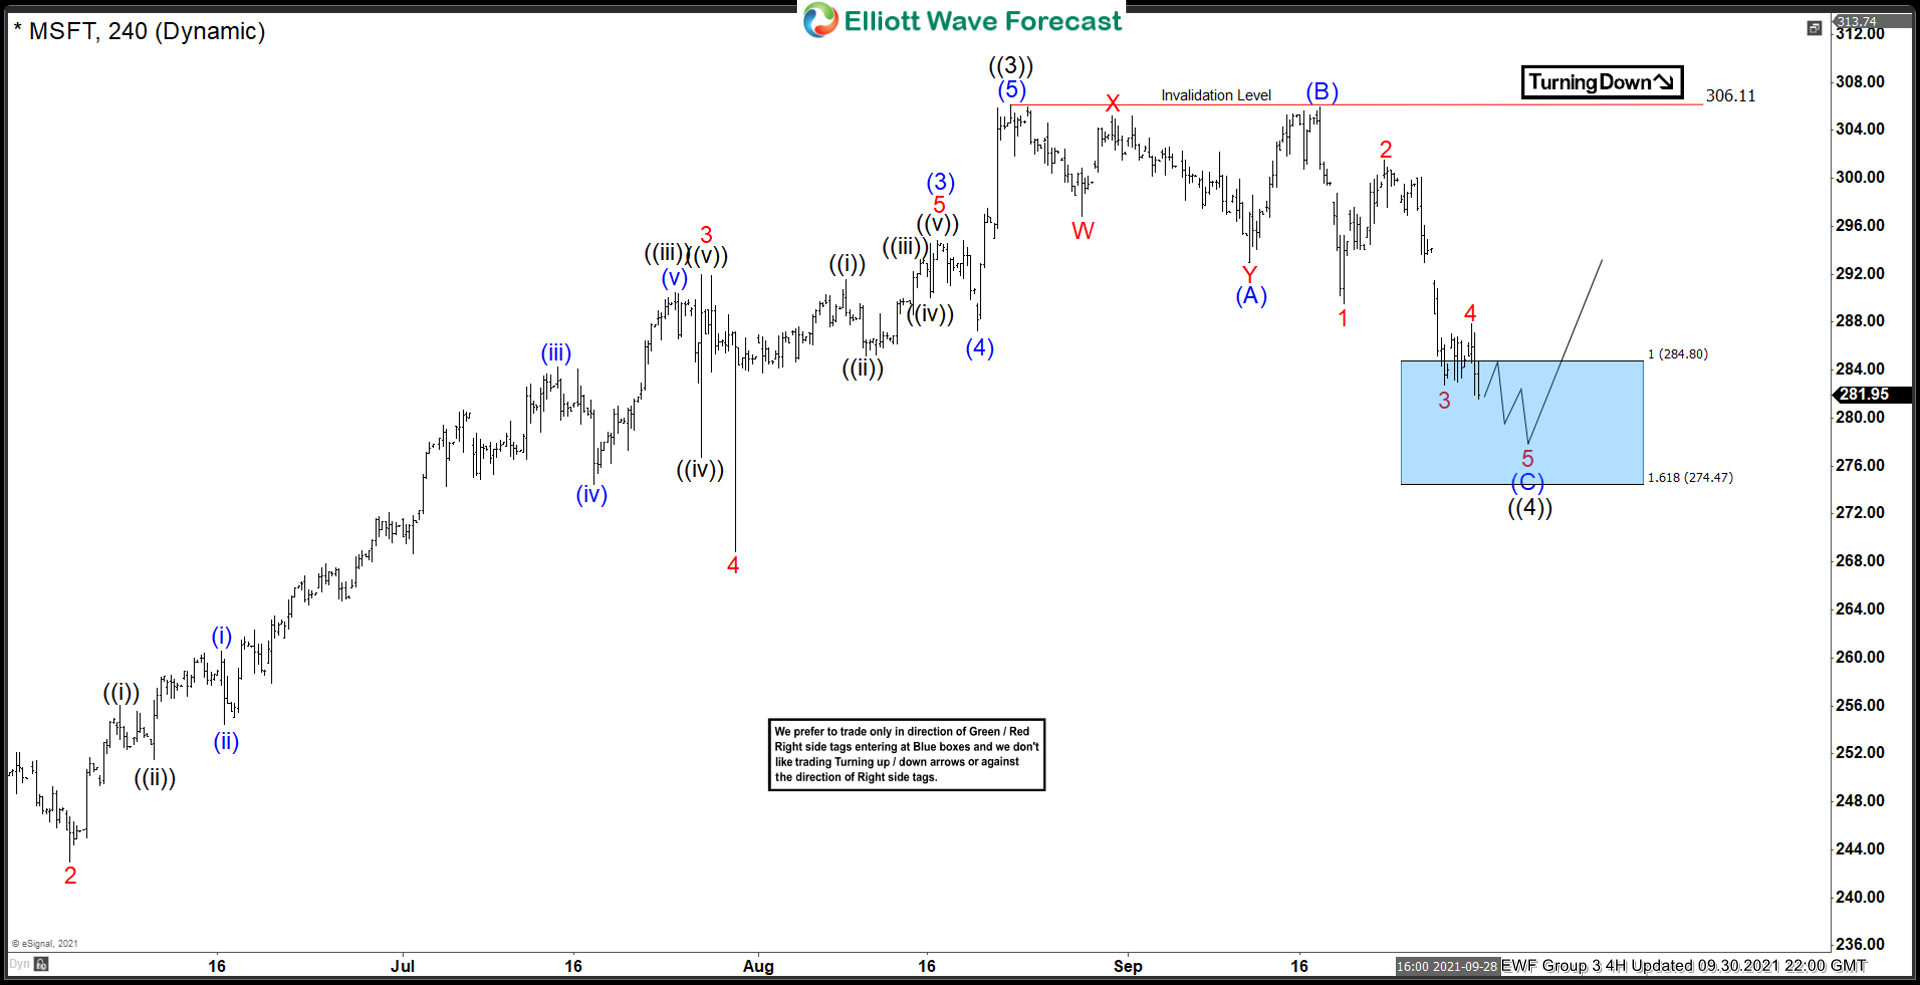
Microsoft $MSFT Impulsive Bullish Sequences Forecasting The Rally
Read MoreHello fellow traders. In this technical blog we’re going to take a quick look at the Elliott Wave charts of Microfost published in members area of the website. As our members know, Microsoft is showing impulsive bullish sequences and we’ve been calling rally in the Stock. $MSFT recently made ((4)) pull back. We expected the […]
-
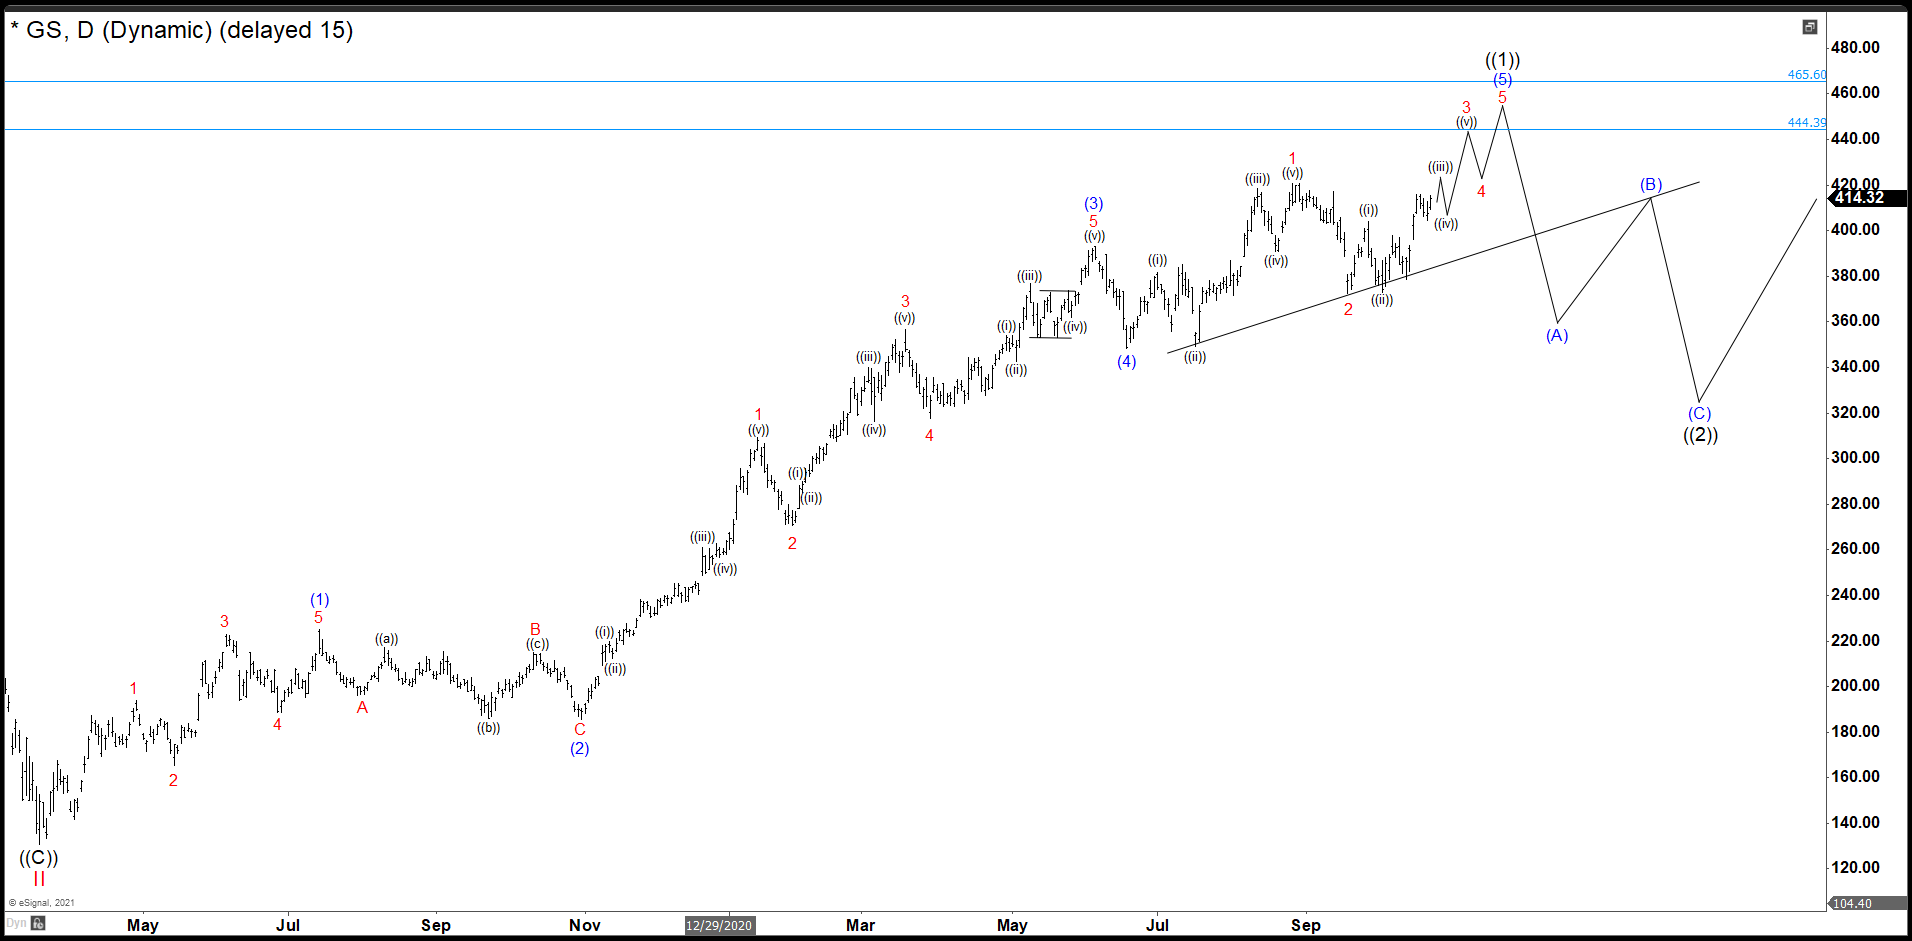
Goldman Sachs (GS) Still Looking Higher After Q3 Results
Read MoreThe Goldman Sachs Group, Inc. (GS) is an American multinational investment bank and financial services company headquartered in New York City. It offers services in investment management, securities, asset management, prime brokerage, and securities underwriting. Since March 2020 low, GS is moving with a bullish momentum. The structure of this movement in Elliott Theory we call a motive wave or impulse. If you want to learn more […]