

The Power of 3-7-11 and the Grand Super Cycle: How We Saw the Bullish Turn in April 2025 Back on April 9, 2025, while World Indices were dropping sharply and global sentiment had turned overwhelmingly bearish, we published an article that challenged the fear-driven narrative. We explained why selling was not the right approach and […]
-
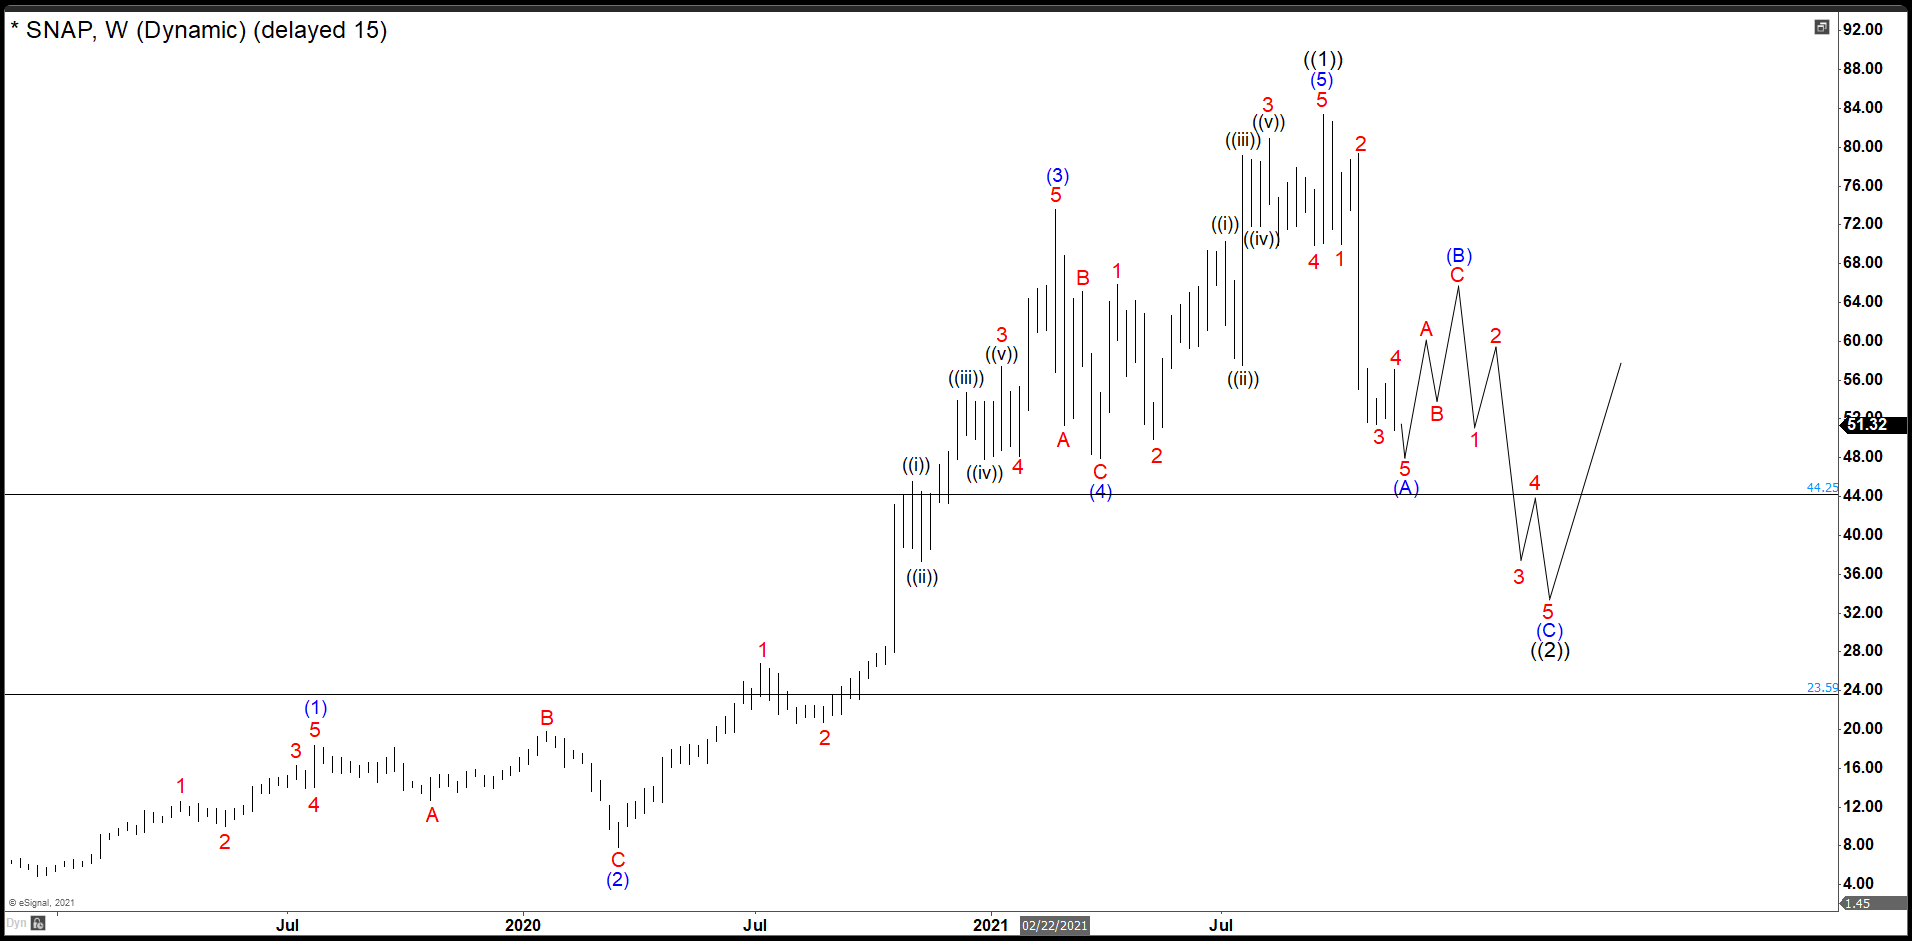
SNAP Closed A Market Cycle From 2018 And Entered In Correction Mode
Read MoreSnap Inc. is an American camera and social media company, founded on September 16, 2011, by Evan Spiegel, Bobby Murphy, and Reggie Brown based in Santa Monica, California. The company developed and maintained technological products and services, namely Snapchat, Spectacles, and Bitmoji. SNAP Daily Chart The market cycle began on December 2018 when SNAP found […]
-
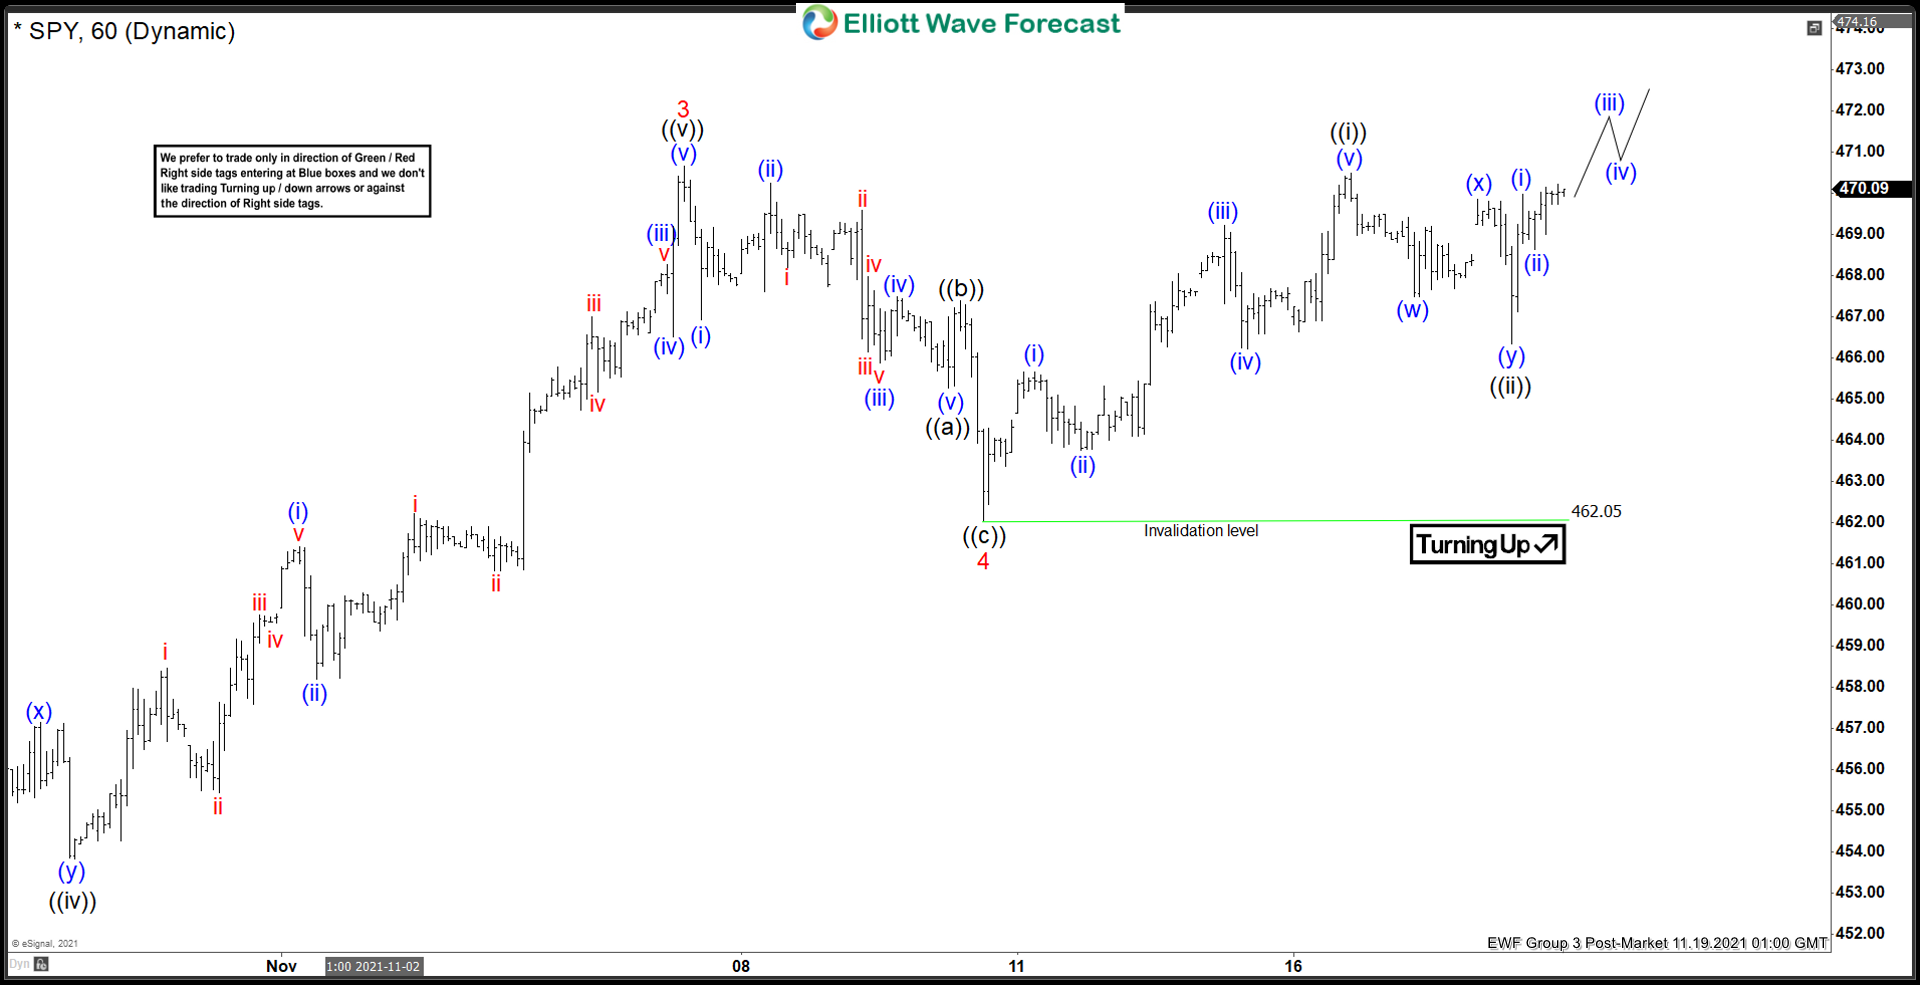
SPY Elliott Wave View: Should Extend Into New Highs
Read MoreSPY is showing an incomplete sequence from October 01 low favoring more upside. This article and video look at the Elliott Wave path.
-
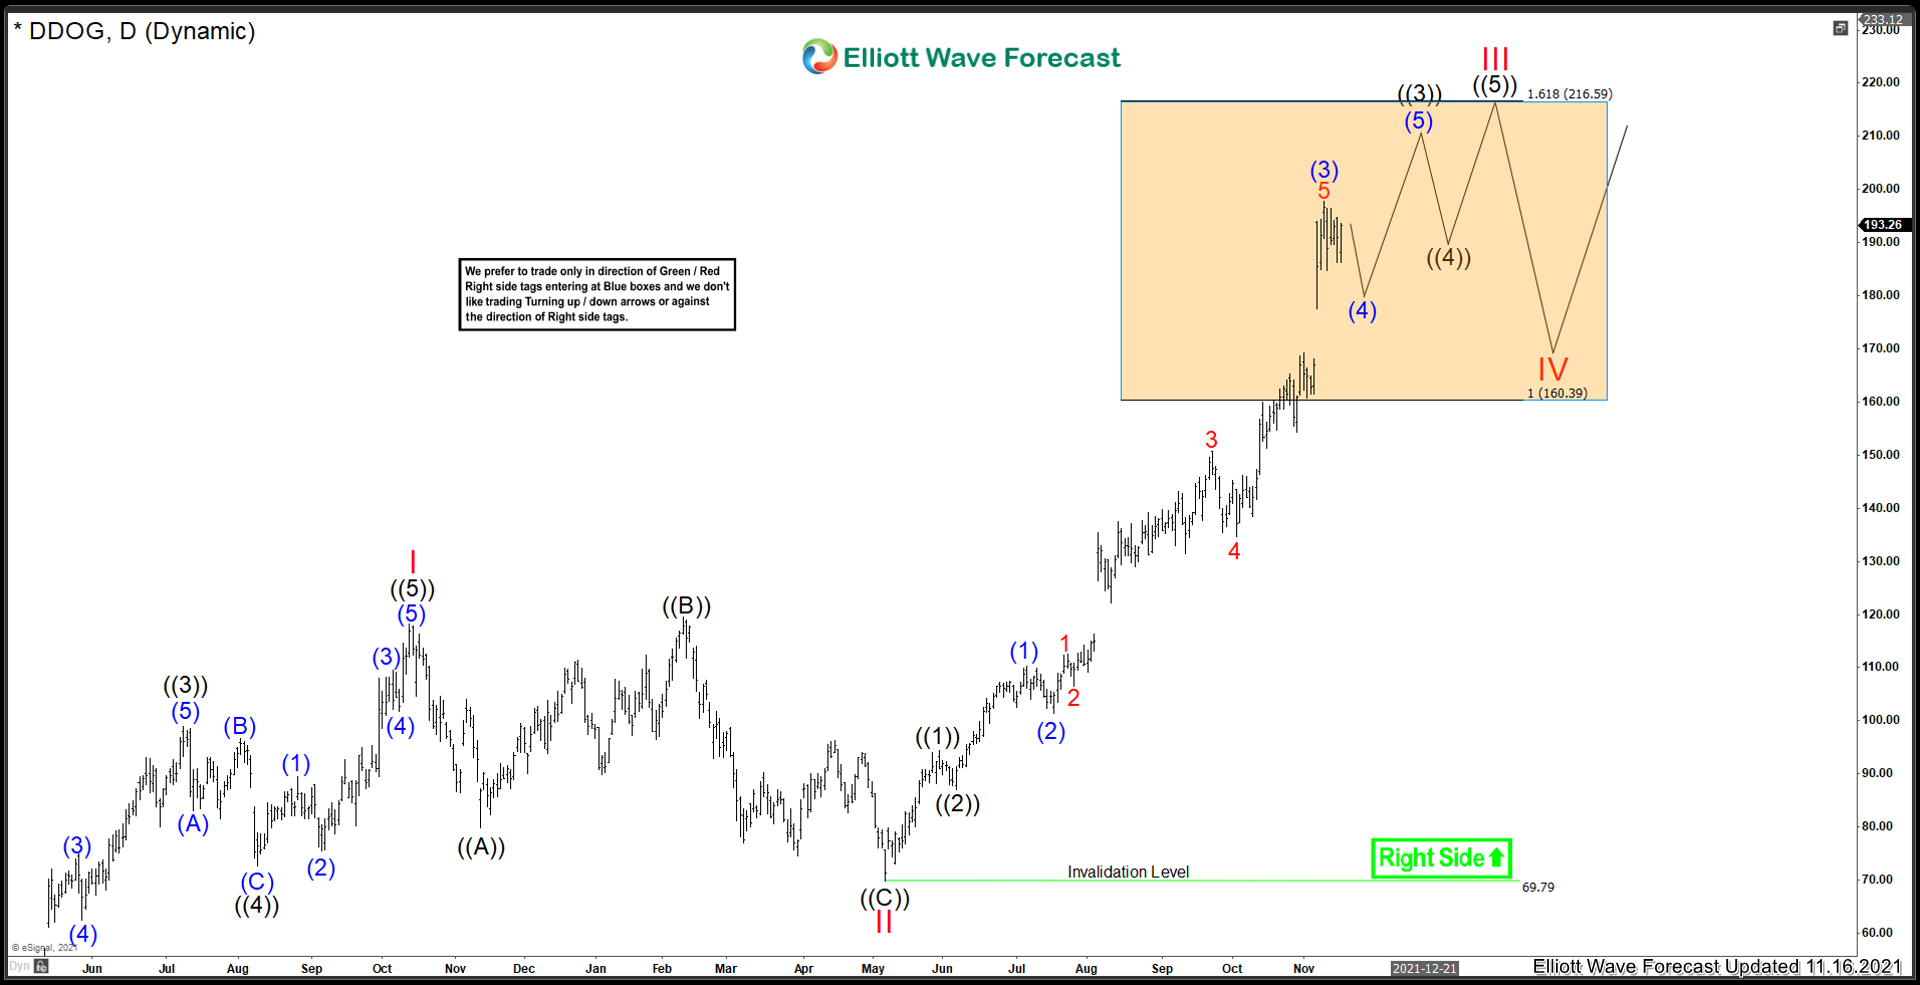
DataDog ($DDOG) Further Extension Higher Before Pullback
Read MoreThe last time I analyzed DataDog I favoured that the instrument had completed a major pullback in Red II. And this stock was ready to start moving higher within a wave III advance. This article can be viewed here. I wanted to revisit this stock and take a look at what has happened since July […]
-
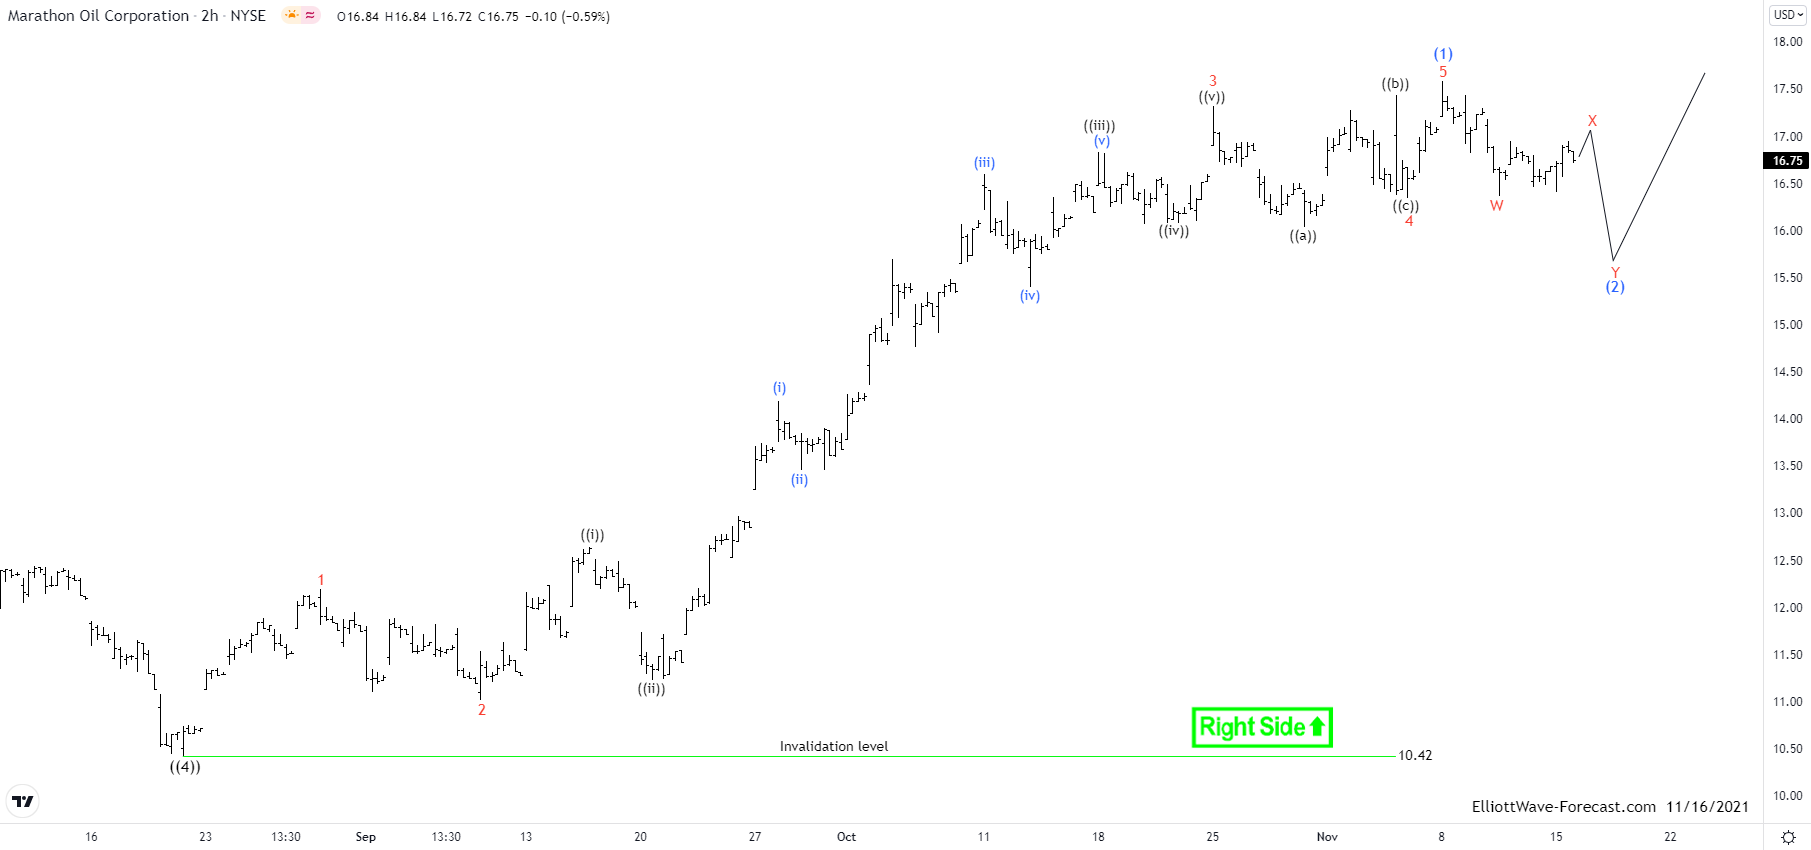
Elliott Wave View: MRO Should Pullback & Extend higher
Read MoreMarathon Oil Corporation (MRO) is the industry from Energy sector working as independent Oil & Gas Exploration & Production. It is headquartered in Houston, Texas & trades under MRO ticker at NYSE. This is a continuation article for Elliott Wave view, previously posted on 10/17/2021. In previous article, we expect it to extend higher in […]
-
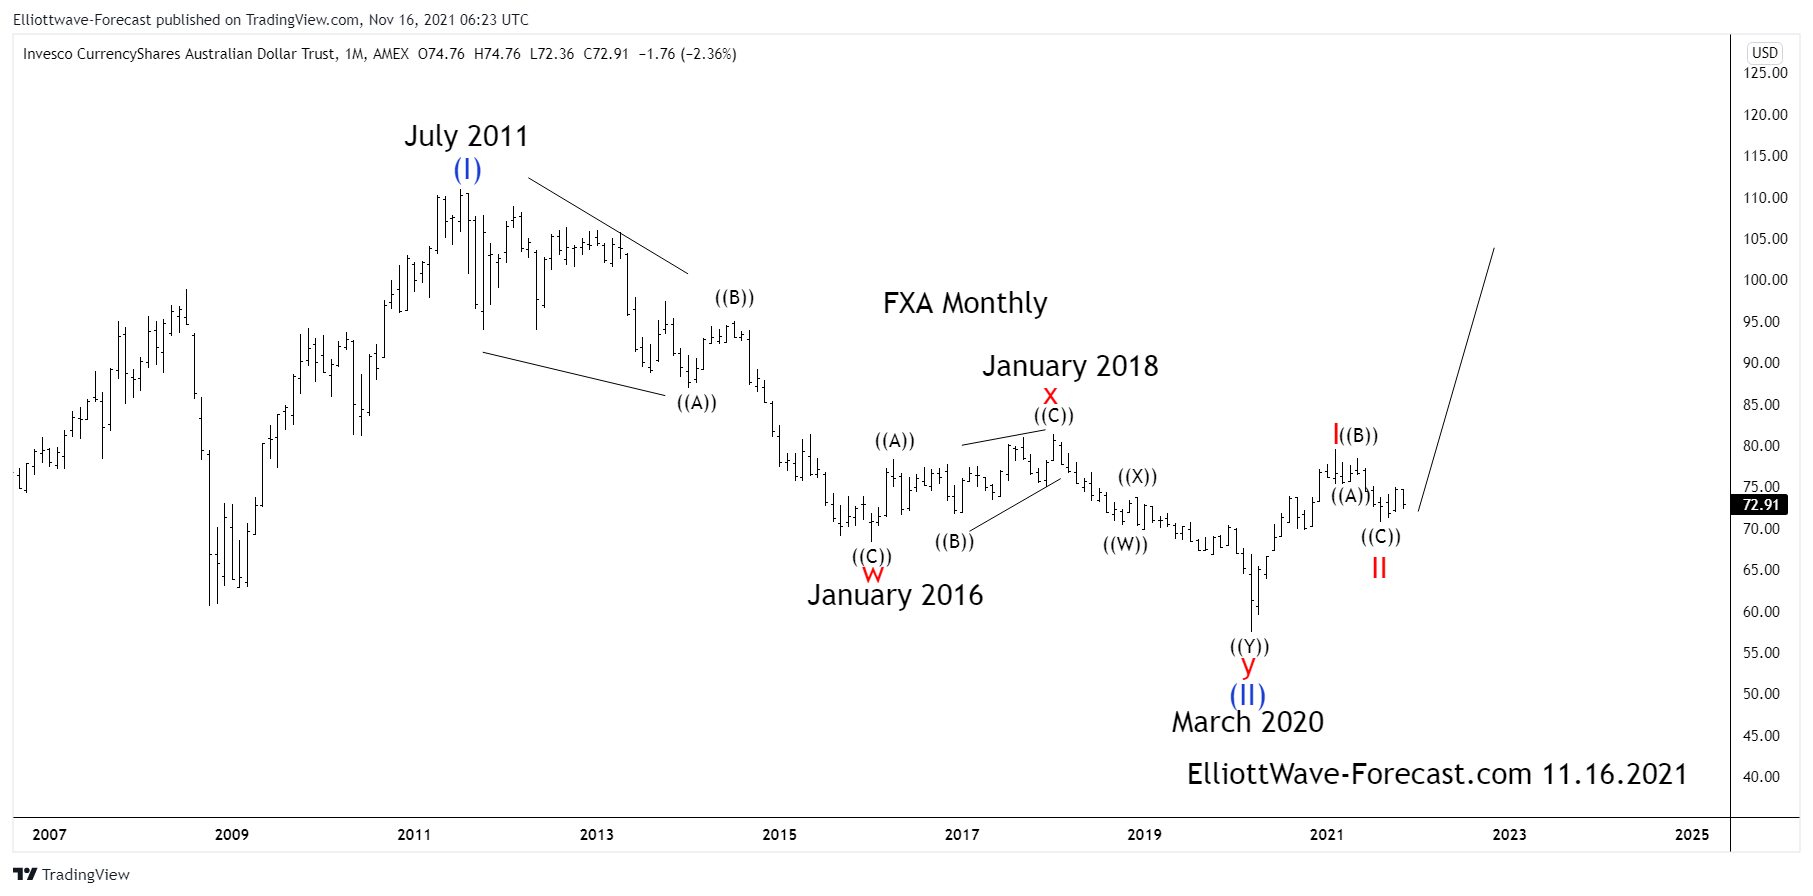
$FXA Currency ETF Long Term Cycles and Elliott Wave Analysis
Read More$FXA Currency ETF Long Term Cycles and Elliott Wave Analysis The FXA ETF fund is the Australian dollar tracking fund that has an inception Date of 06/21/2006. With that said the fund mainly reflects the currency spot price of the AUDUSD pair. The data available from the Reserve Bank of Australia at their website suggests the spot […]
-
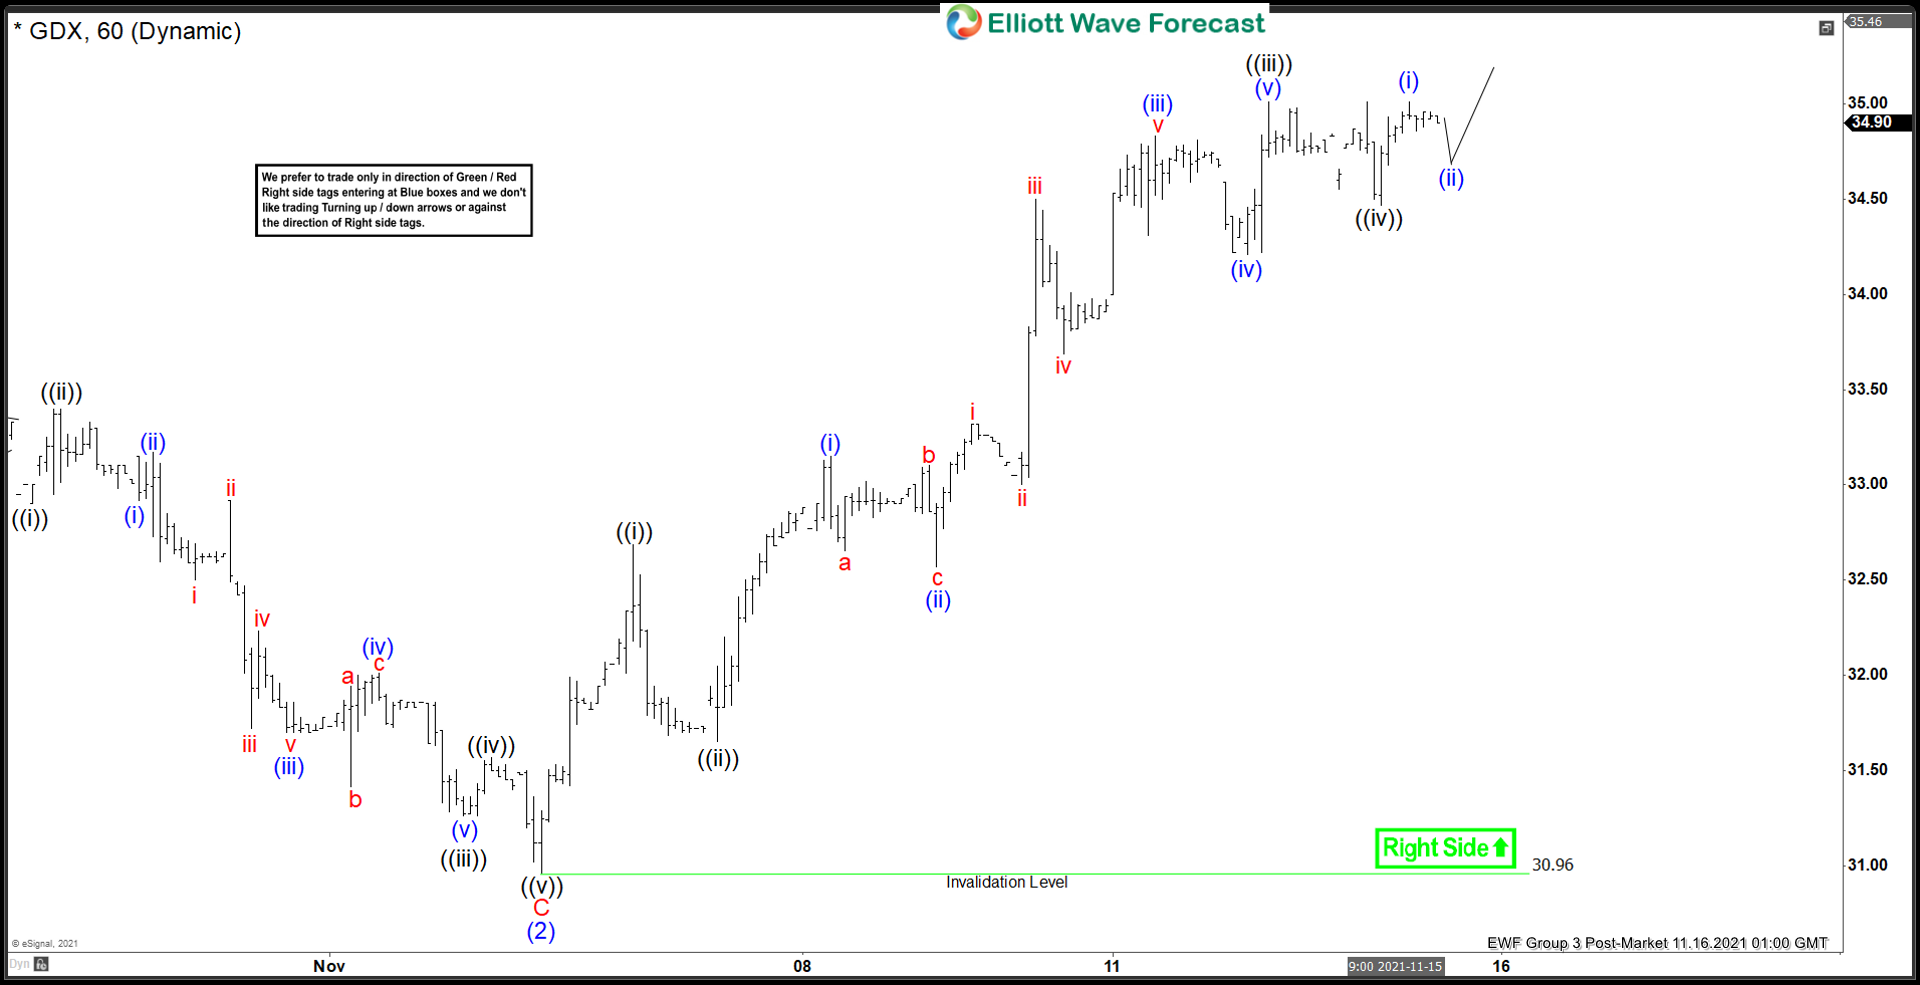
Elliott Wave View: GDX Starts New Bullish Cycle
Read MoreGDX shows incomplete sequence from October 4 low favoring more upside. This article and video look at the Elliott Wave path.