

The Power of 3-7-11 and the Grand Super Cycle: How We Saw the Bullish Turn in April 2025 Back on April 9, 2025, while World Indices were dropping sharply and global sentiment had turned overwhelmingly bearish, we published an article that challenged the fear-driven narrative. We explained why selling was not the right approach and […]
-
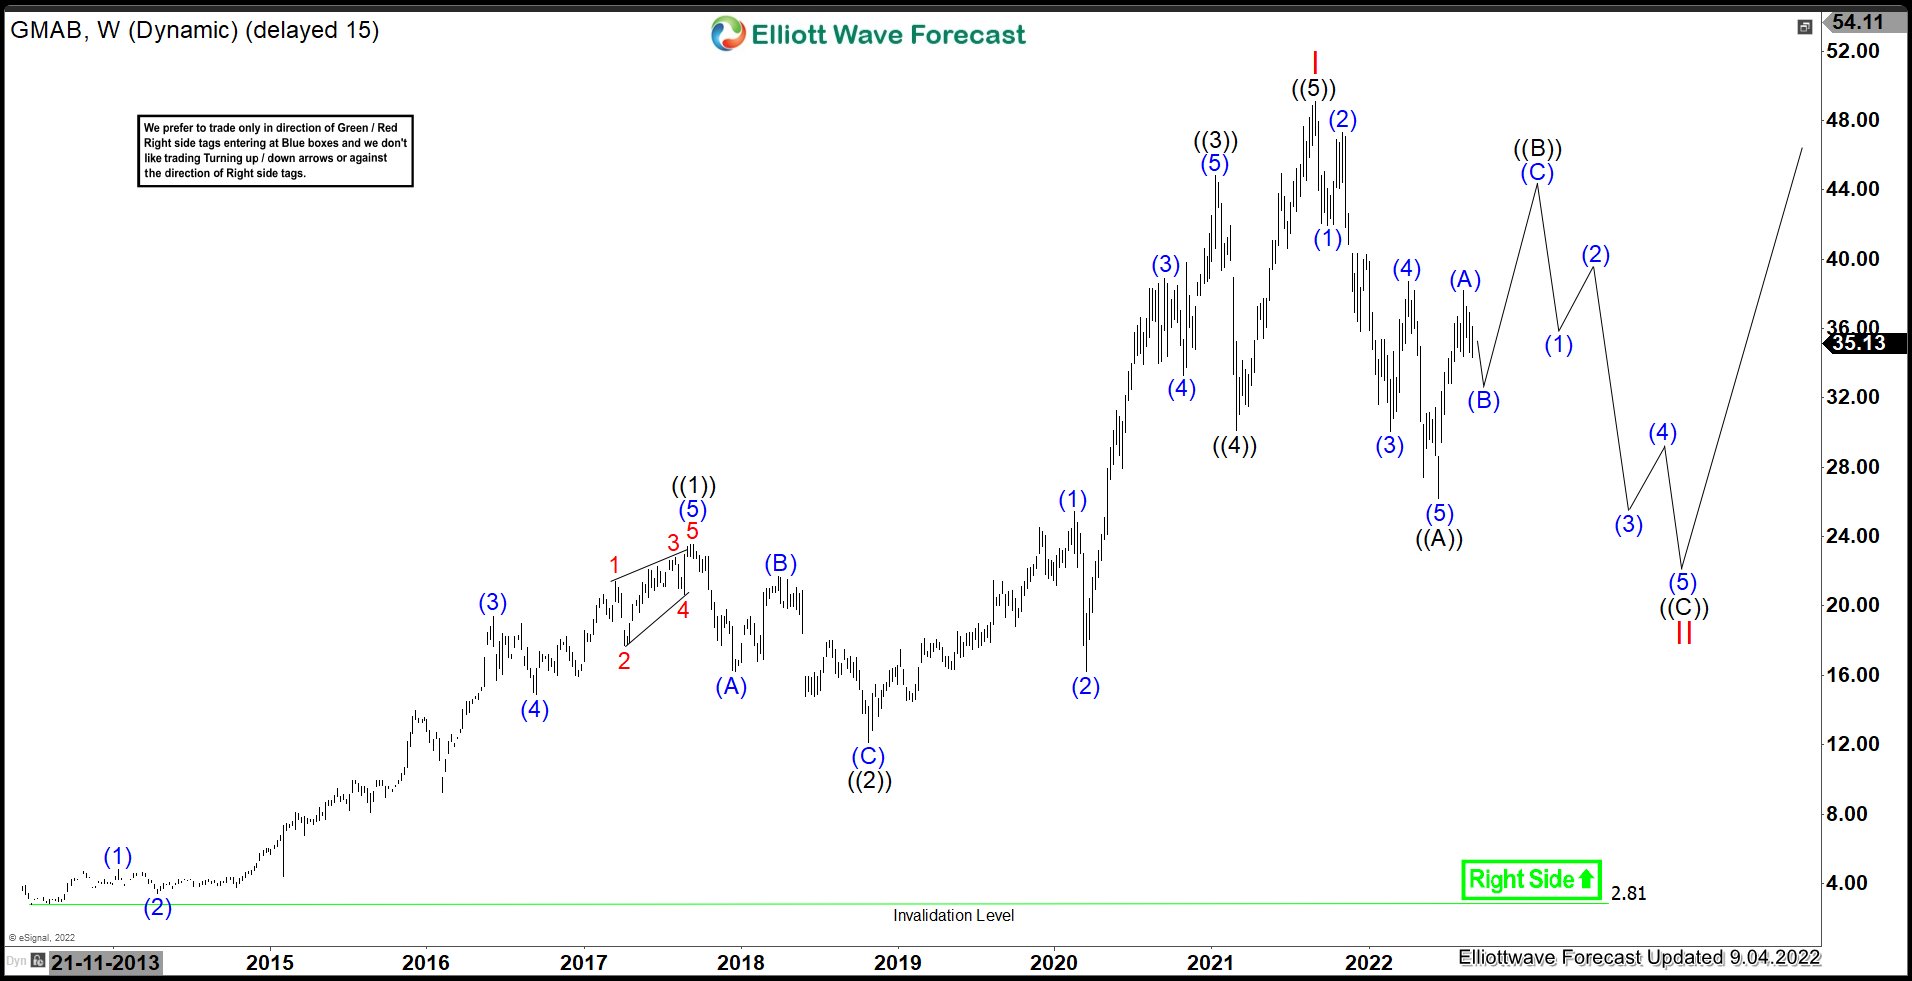
GMAB : Should Expect Sideways To Lower Before Upside Resumes
Read MoreGenmab A/S (GMAB) develops antibody therapeutics for the treatment of the cancer and other diseases. The company is based in Copenhagen, Denmark, comes under Healthcare – Biotechnology sector & trades as “GMAB” ticker at Nasdaq. GMAB made an all time high at $49.07 & currently favors correcting lower the sequence up since 2013 low. It […]
-
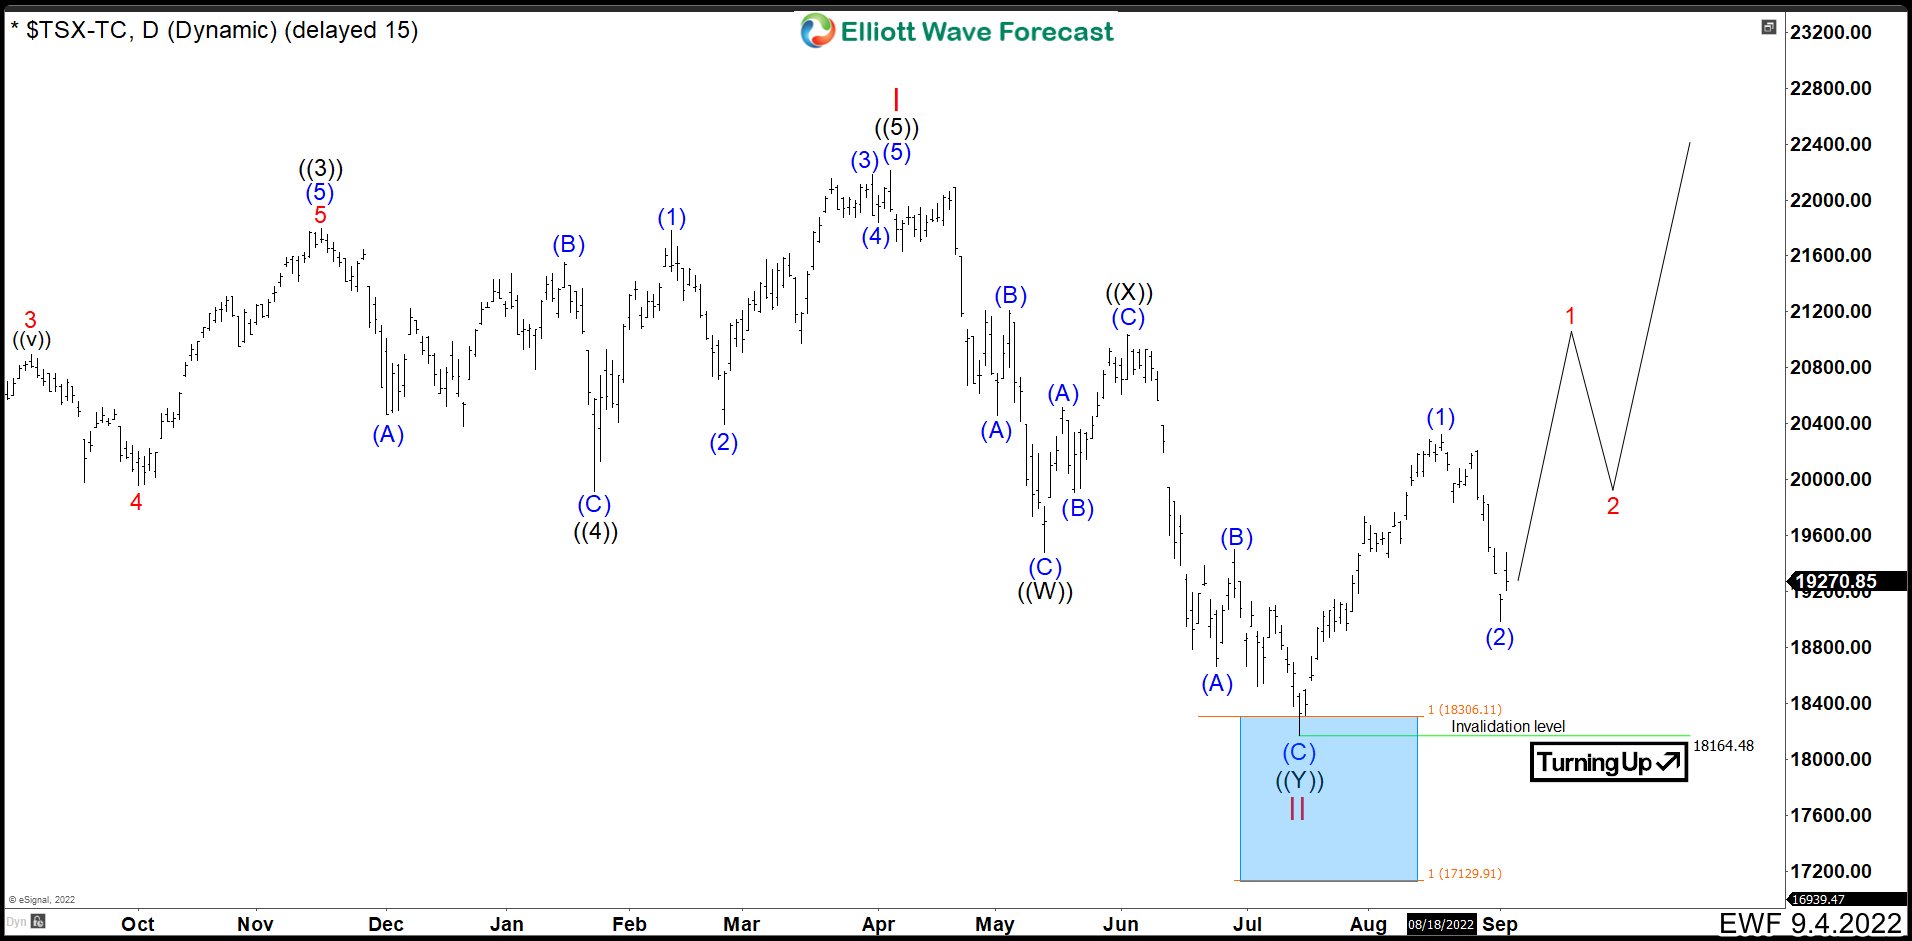
TSX Bounced From The Blue Box. What Is Next?
Read MoreS&P/TSX is a major stock market index which tracks the performance of largest companies by market capitalization on the Toronto Stock Exchange in Canada. It is a free float market capitalization weighted index. The index covers approximately 95 percent of the Canadian equities market. The S&P/Toronto Stock Exchange Composite Index has a base value of […]
-
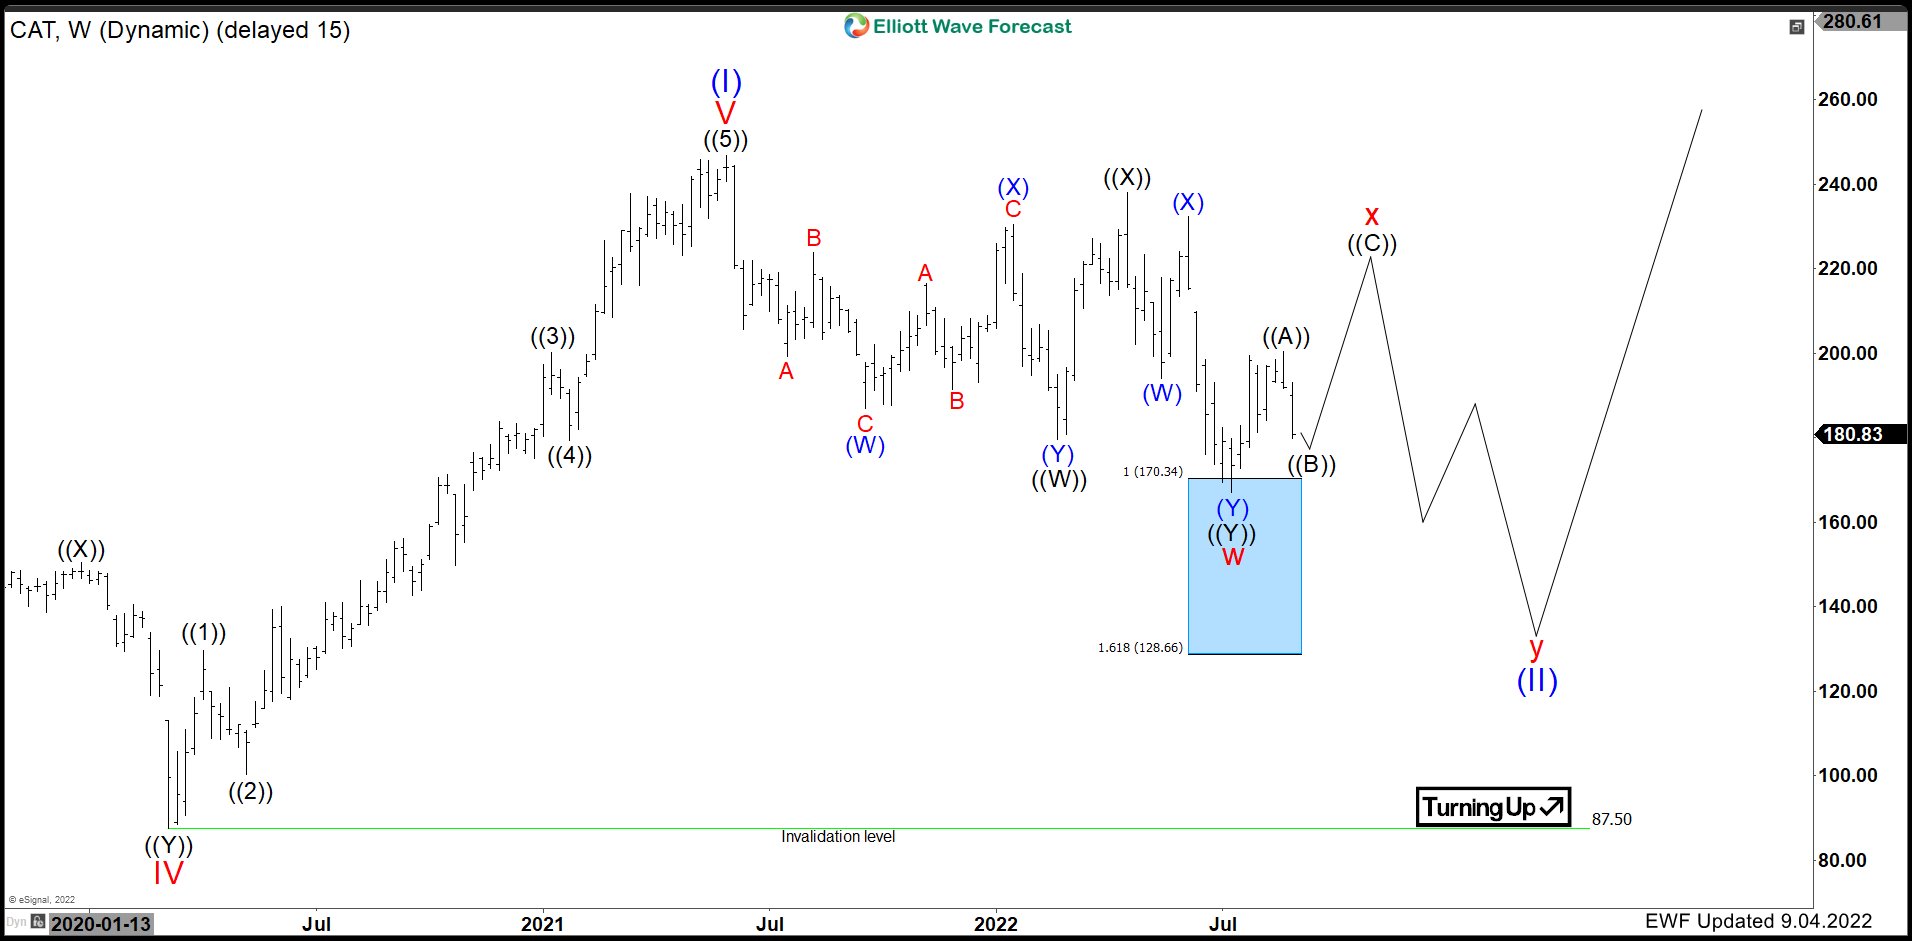
Caterpillar Inc. ($CAT) has reached inflection area. What’s next?
Read MoreCaterpillar Inc. ($CAT) is an American Fortune 100 corporation that designs, develops, engineers, manufactures, markets, and sells machinery, engines, financial products, and insurance to customers via a worldwide dealer network. It is the world’s largest construction-equipment manufacturer. Caterpillar stock is a component of the Dow Jones Industrial Average. Caterpillar ElliottWave September 2022 View (Weekly): The Weekly Chart above shows the cycle from March 2020 low unfold in […]
-
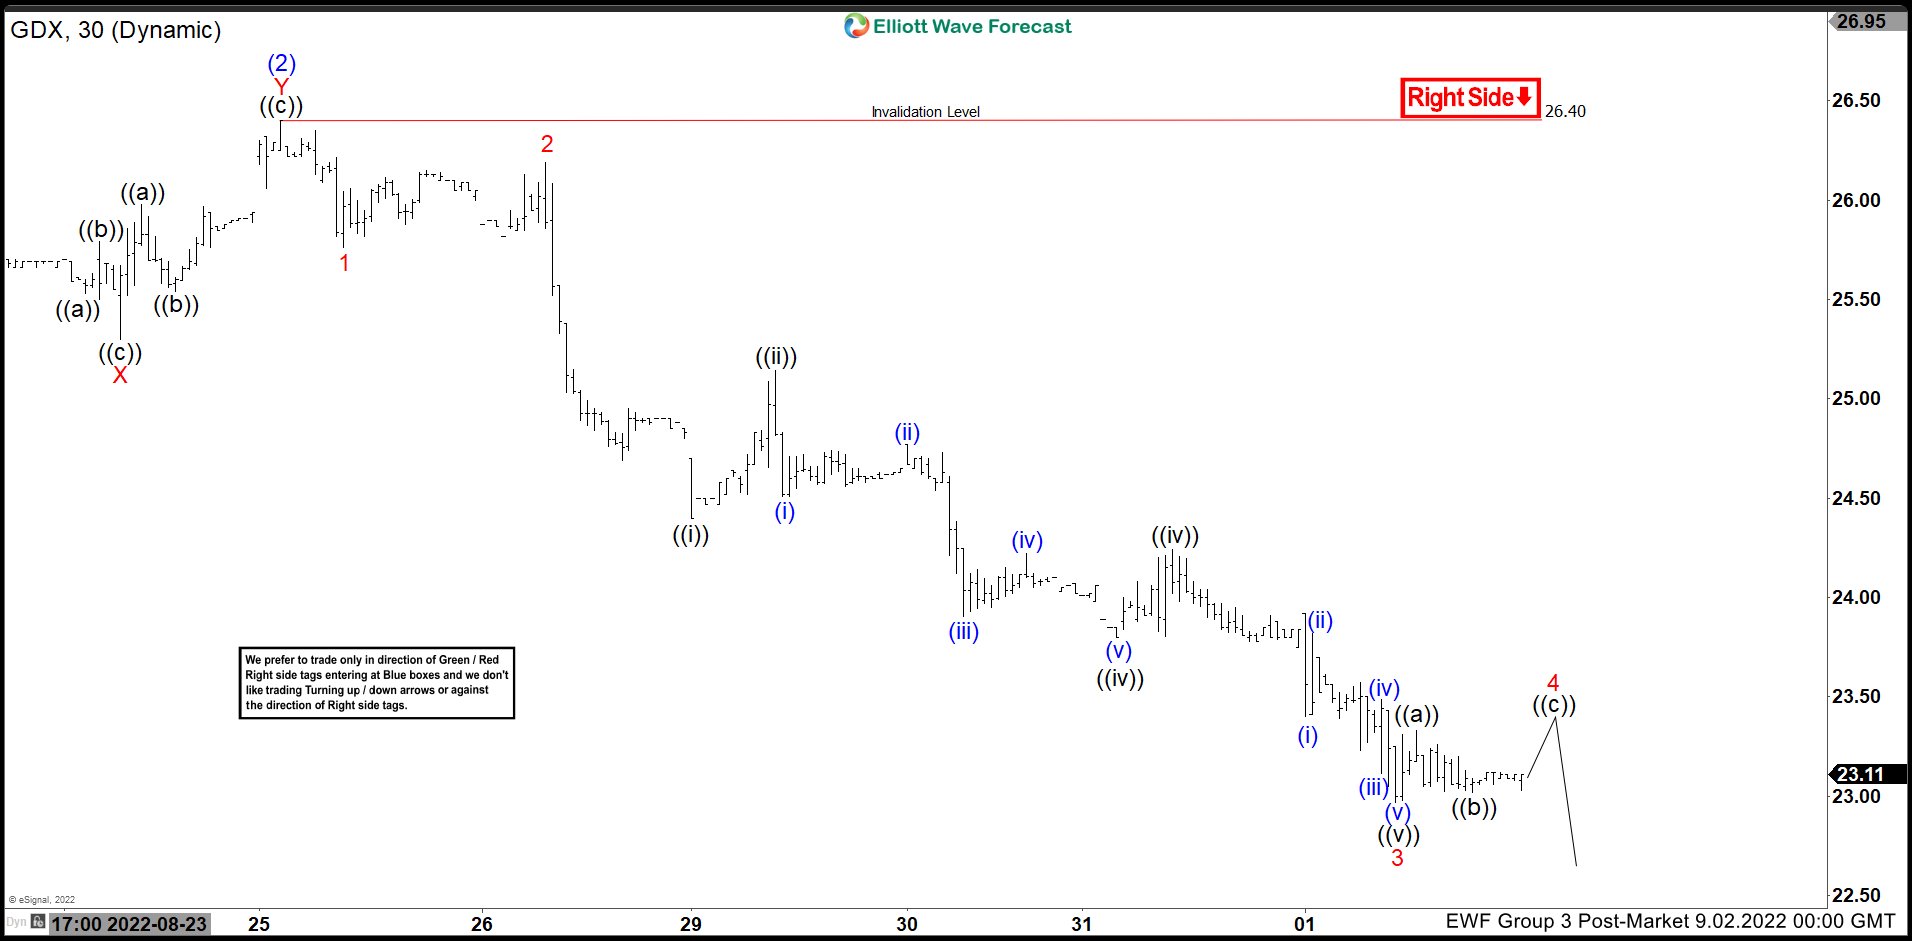
Elliott Wave View: Gold Miners ETF (GDX) Has Reached Inflection Area
Read MoreShort Term Elliott Wave View in GDX suggests rally to 26.40 ended wave (2). Wave (3) lower is in progress to complete a cycle from August 25th, 2022 high. Internal subdivision of wave (2) unfolded as a double three Elliott Wave structure. Up from wave (1), wave ((a)) ended at 25.23 and pullback in wave […]
-
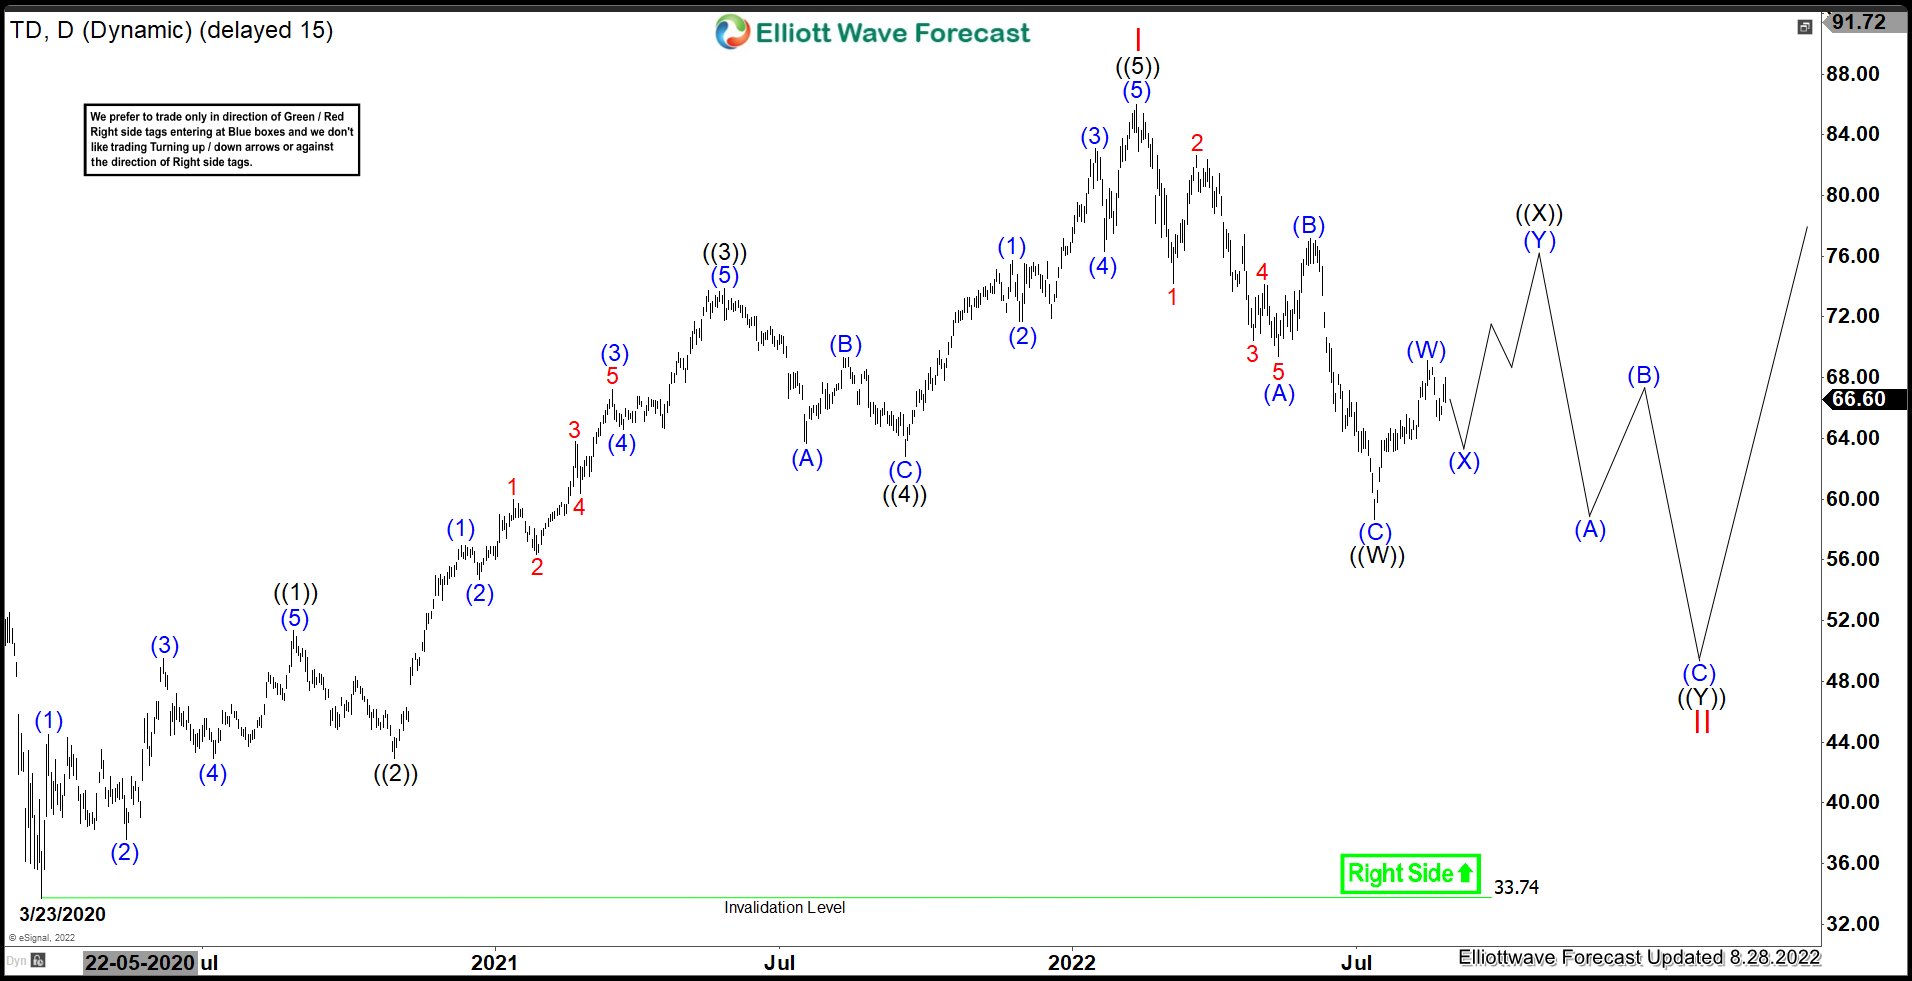
TD : Should Expect Sideways To Lower Before Upside Resumes
Read MoreThe Toronto-Dominion Bank (TD), together with its subsidiaries, provides various financial products & services in Canada, US & internationally. It operates through three segments: Canadian retail, US retail & Wholesale banking. It is based in Toronto, Canada, comes under Financial services sector & trades as “TD” ticker at NYSE. TD ended wave I at $86.02 […]
-
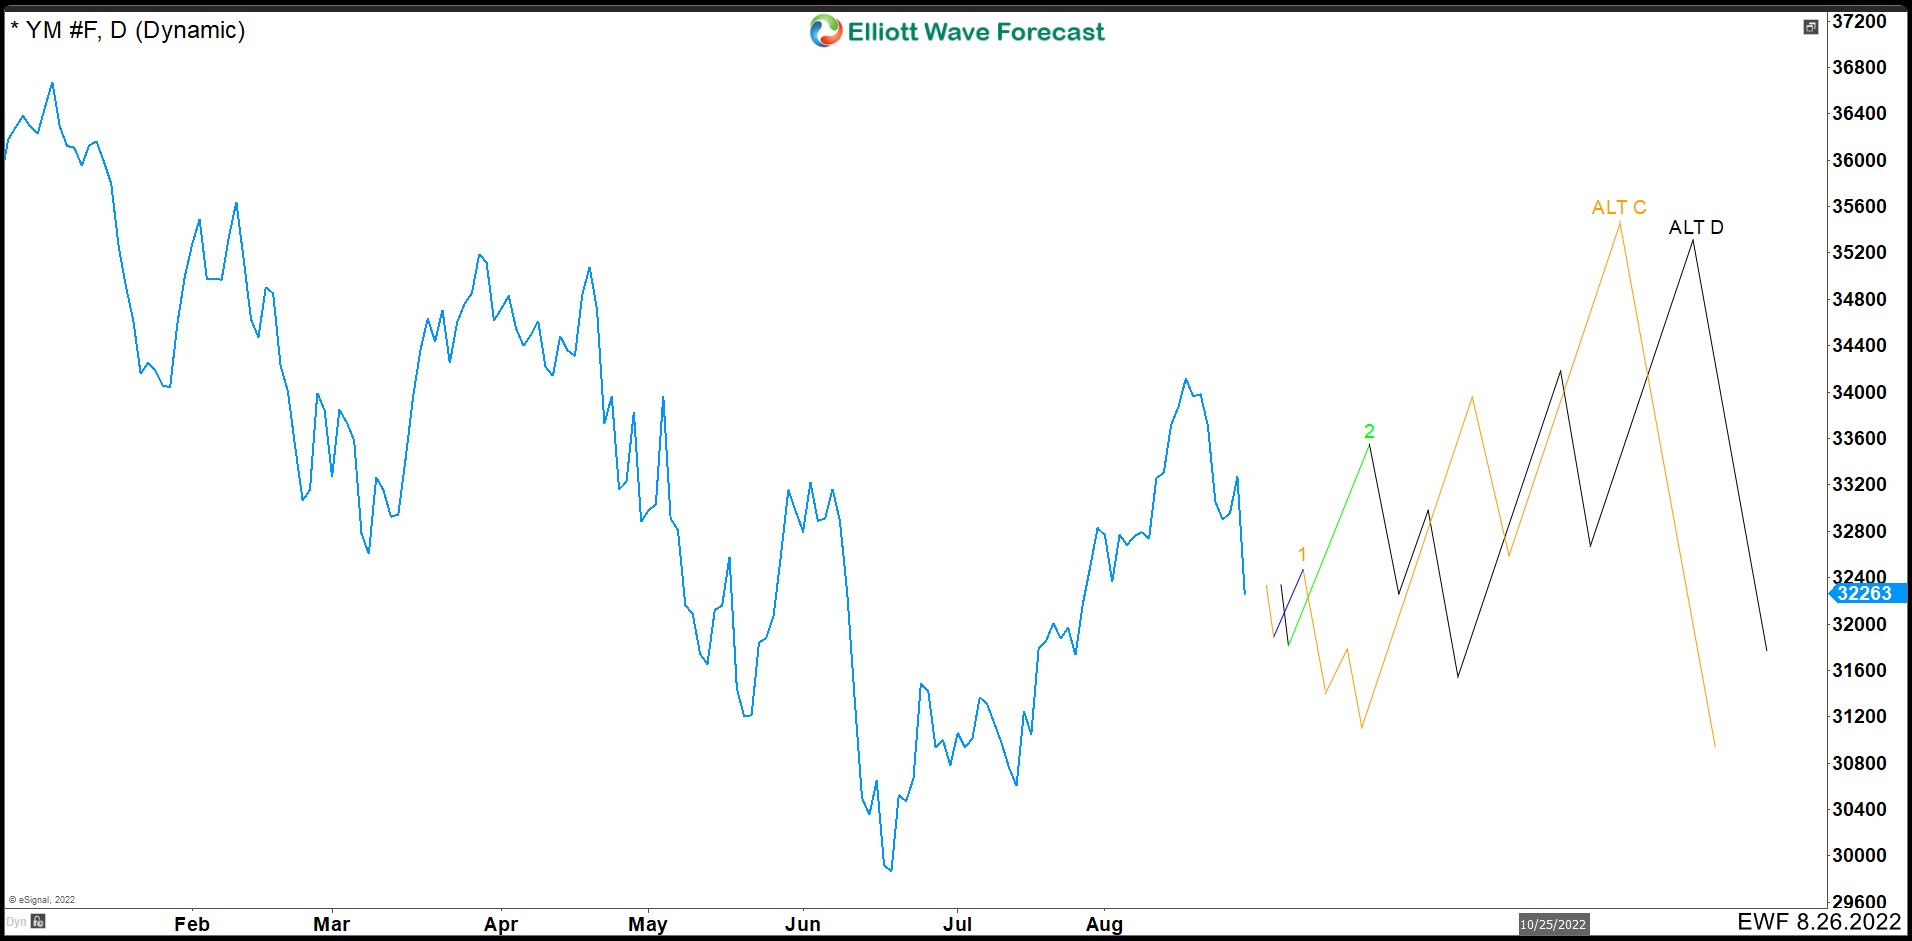
Forecasting Alternative Paths in Dow Jones Using UNH Stock
Read MoreUnitedHealth Group Incorporated (UNH) is an American multinational managed healthcare and insurance company based in Minnesota. It offers health care products and insurance services. This company is a component of the Dow Jones Index with a weight of more than 10% of the total index. In this blog we are going to analyze the UNH […]