

The Power of 3-7-11 and the Grand Super Cycle: How We Saw the Bullish Turn in April 2025 Back on April 9, 2025, while World Indices were dropping sharply and global sentiment had turned overwhelmingly bearish, we published an article that challenged the fear-driven narrative. We explained why selling was not the right approach and […]
-
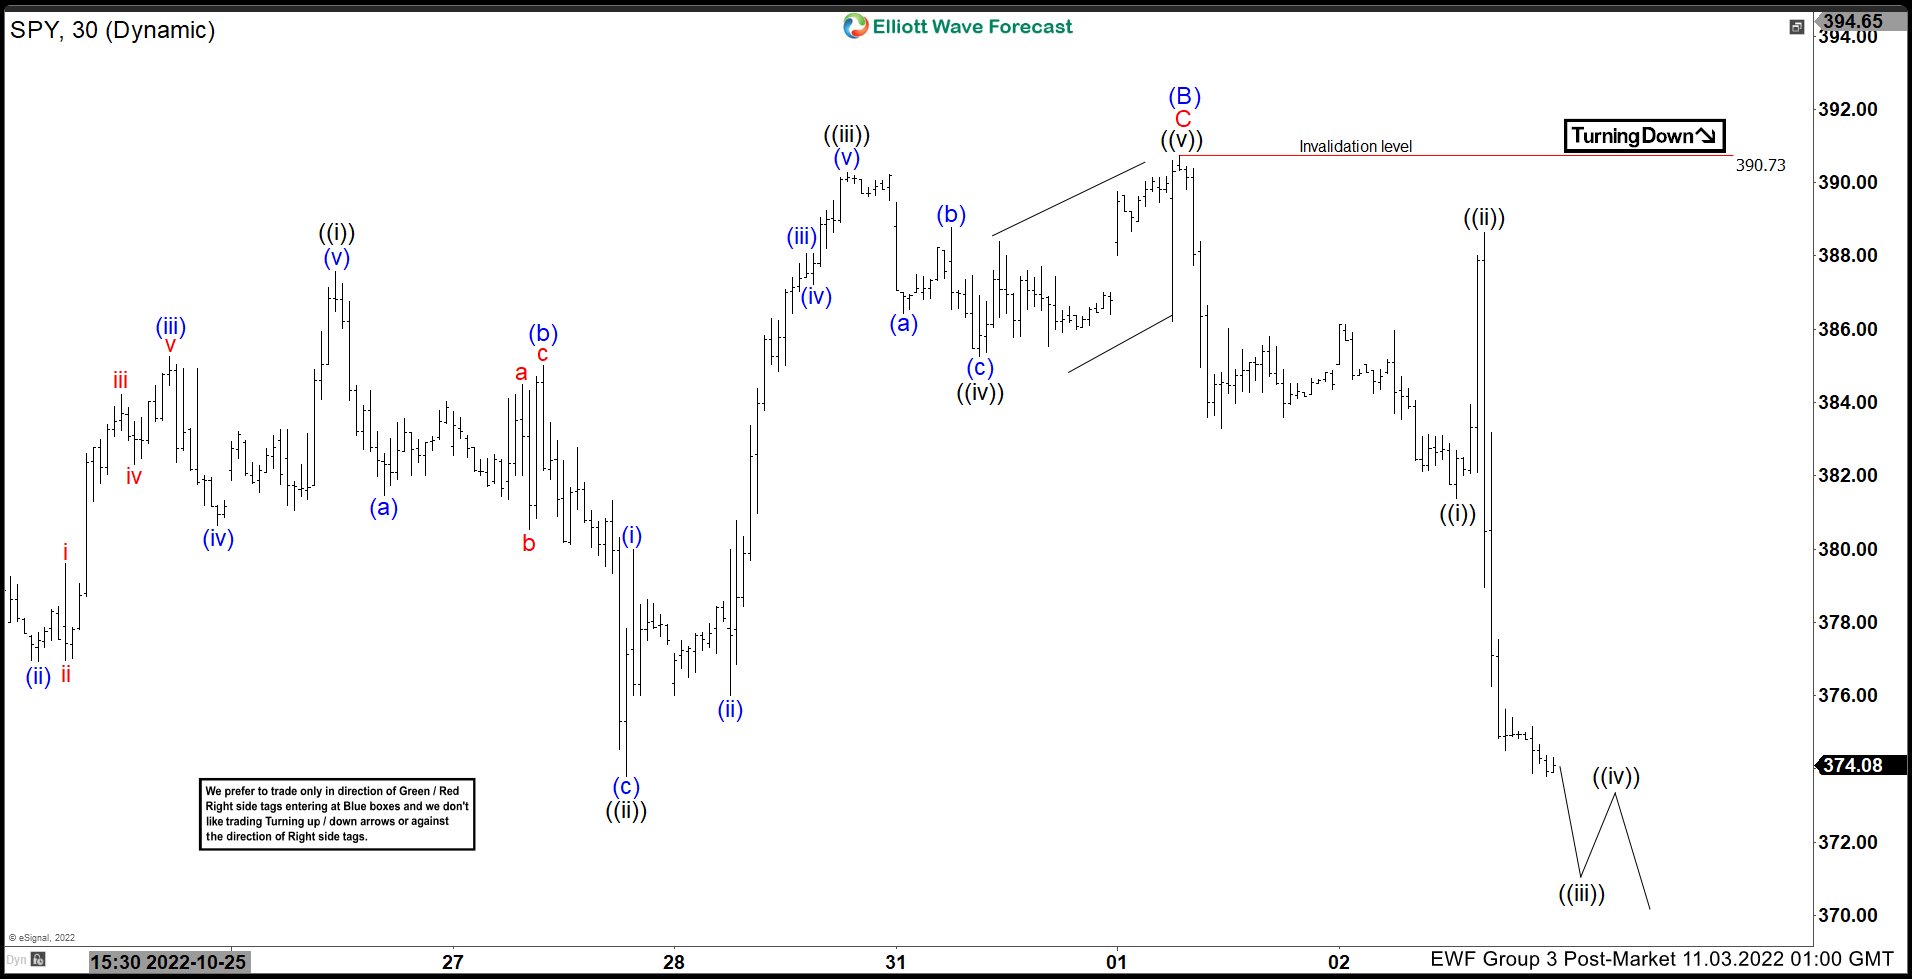
Elliott Wave View: SPY Looking to Resume Lower
Read MoreSPY shows incomplete sequence from 1.4.2022 high favoring more downside. This article and video look at the Elliott Wave path.
-
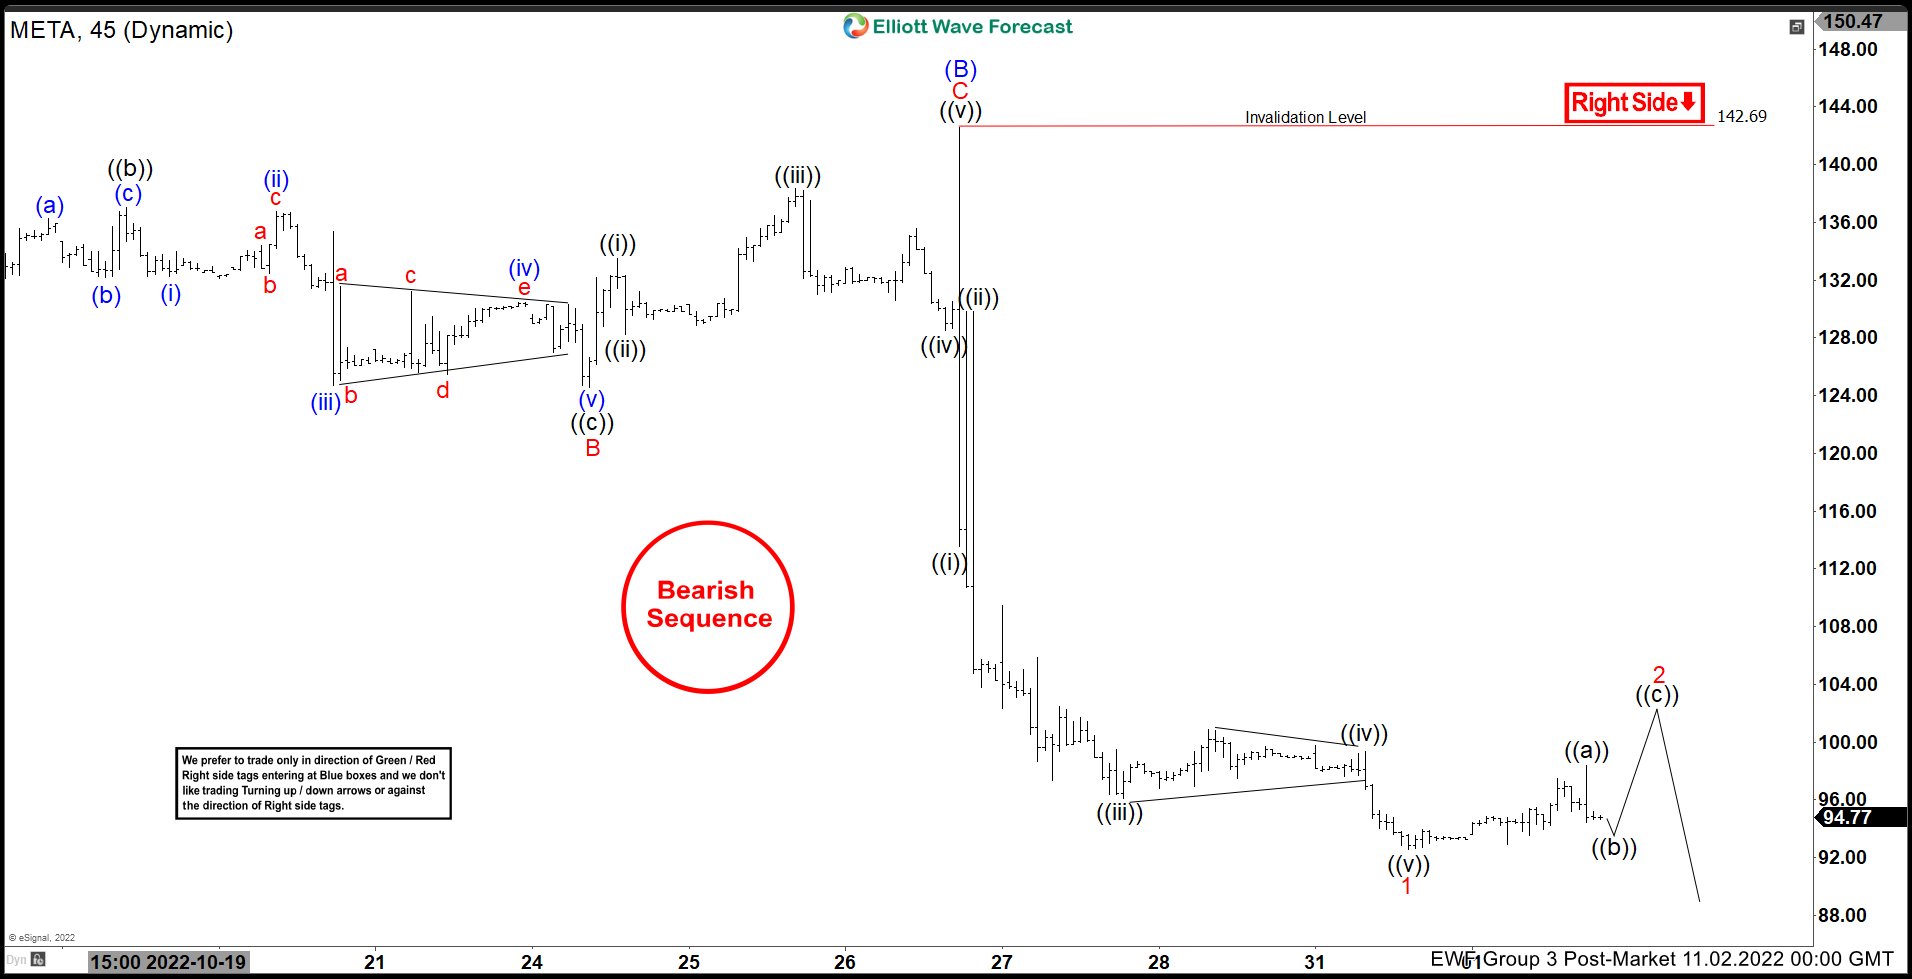
Elliott Wave View: META Should Continue Further Downside
Read MoreMETA shows a bearish sequence from 7.21.2022 high favoring more downside. This article adn video look at the Elliott Wave path.
-
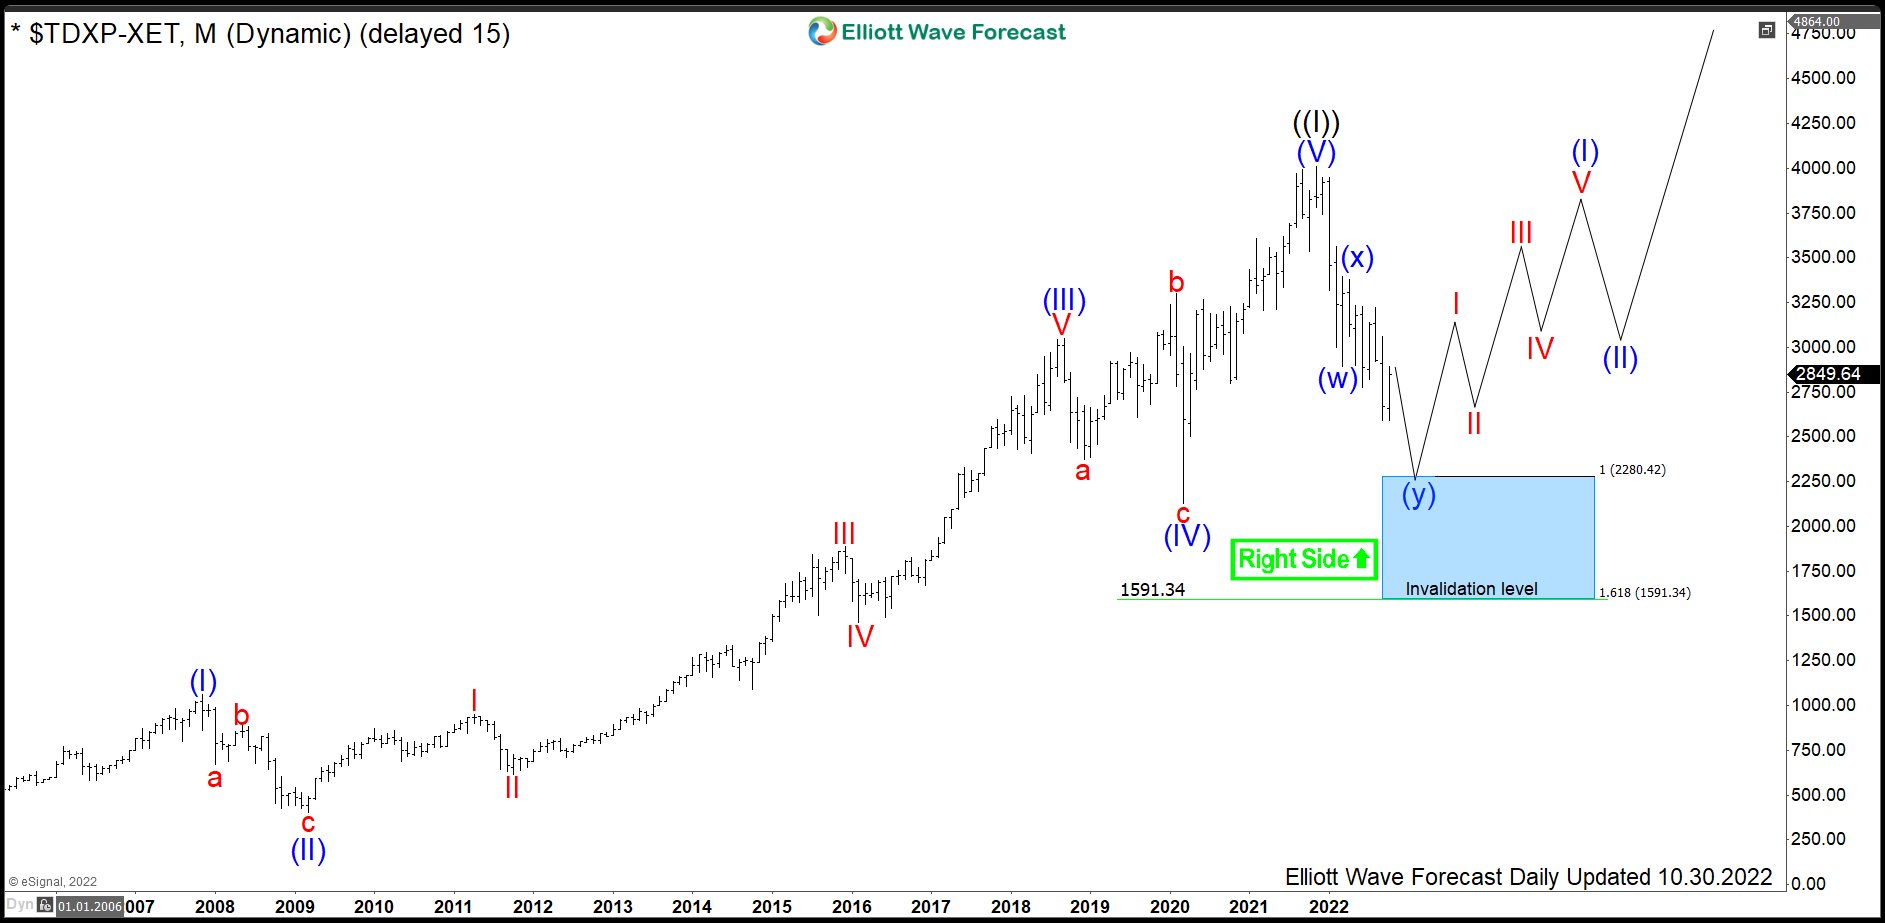
TecDAX: German Technology provides a Long Term Opportunity
Read MoreTecDAX is a stock index which tracks the performance of 30 largest German companies from the technology sector. Even though these enterprises are of a high economic importance, their market capitalization and the book order turnover are far below of that of the DAX index. The TecDAX is related to DAX in a similar way […]
-
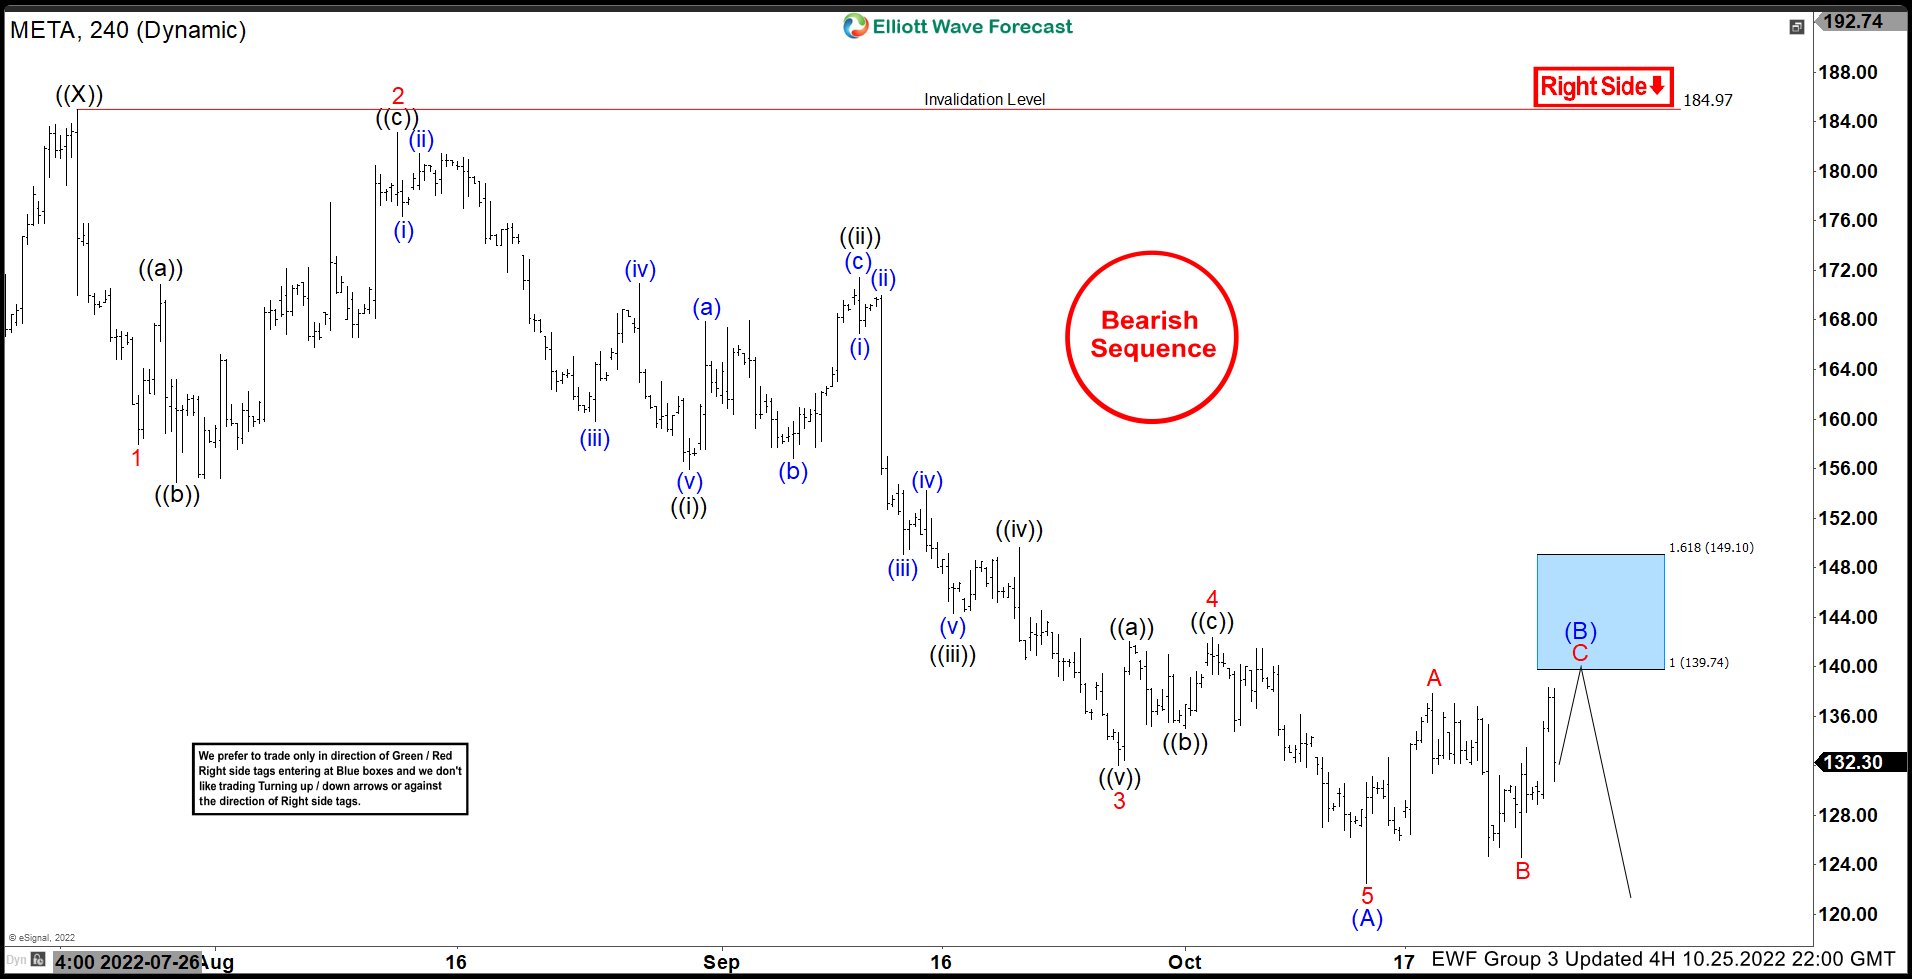
Meta ( Facebook ) Perfect Reaction Lower Taking Place
Read MoreIn this blog, we take a look at the past performance of Meta charts. In which, the stock provided a selling opportunity at the blue box area.
-
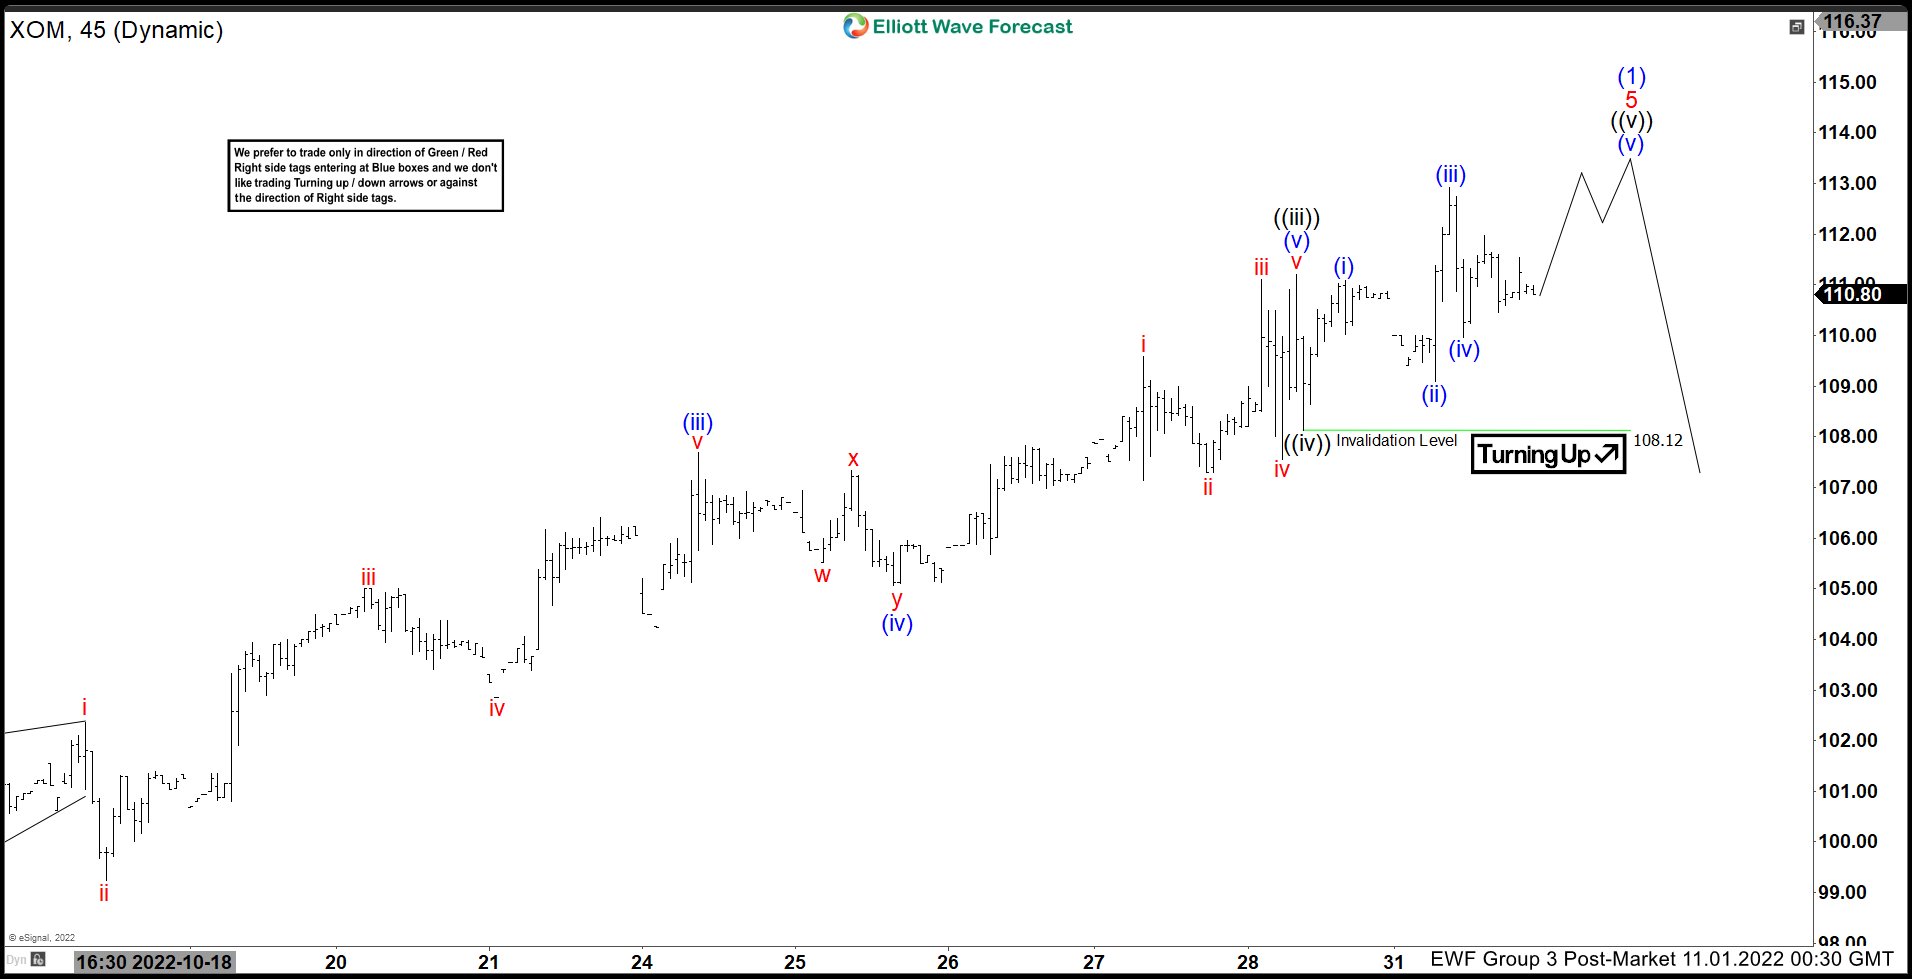
Elliott Wave View: Exxon Mobil (XOM) Looking to End 5 Waves Rally
Read MoreExxon Mobil (XOM) looks to end cycle from 9.26.2022 low as an impulse soon. This article and video look at the Elliott Wave path.
-
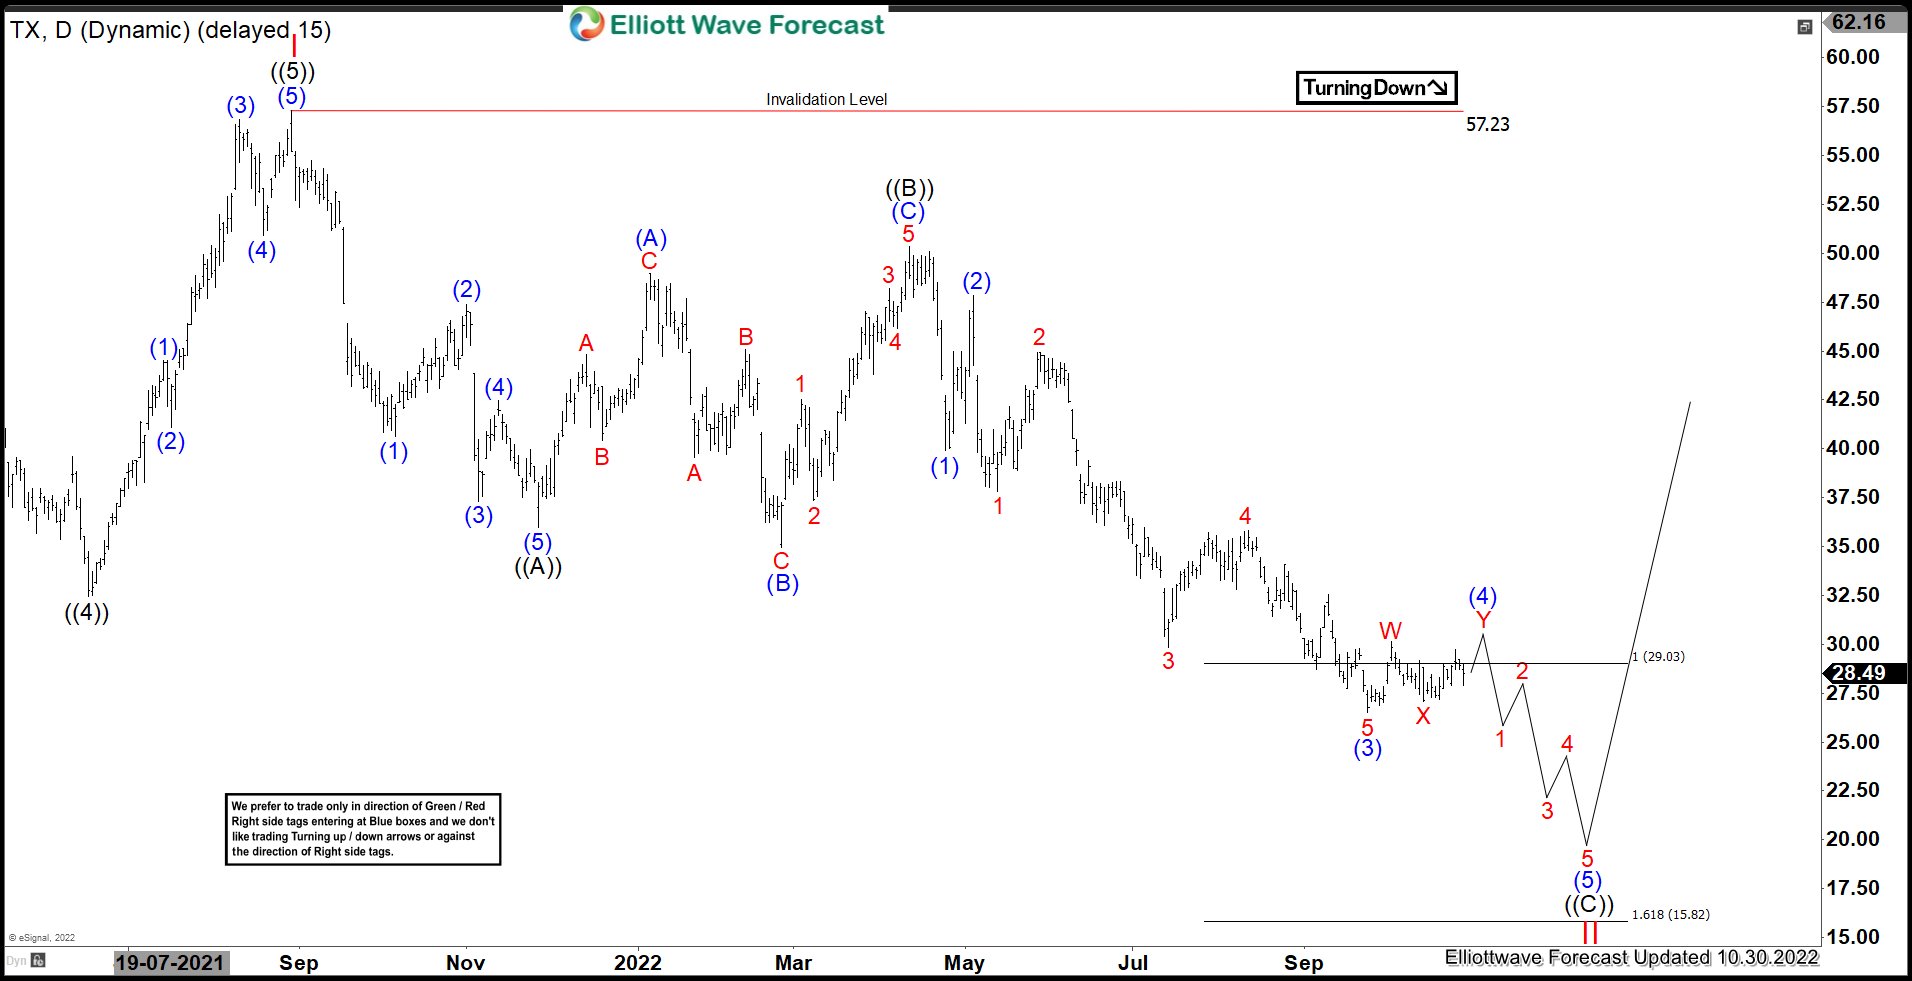
TX : Expect Correction To Extend Downside Before Turning Higher
Read MoreTernium S.A. (TX) through its subsidiaries, manufactures & processes various steel products in Mexico, Brazil, US & other countries. It operates through two segments, Steel & Mining. The company founded in 1961 & based in Luxembourg. It comes under Basic materials sector & trades as ‘TX’ ticker at NYSE. TX made low at $9.59 on […]