

The Power of 3-7-11 and the Grand Super Cycle: How We Saw the Bullish Turn in April 2025 Back on April 9, 2025, while World Indices were dropping sharply and global sentiment had turned overwhelmingly bearish, we published an article that challenged the fear-driven narrative. We explained why selling was not the right approach and […]
-
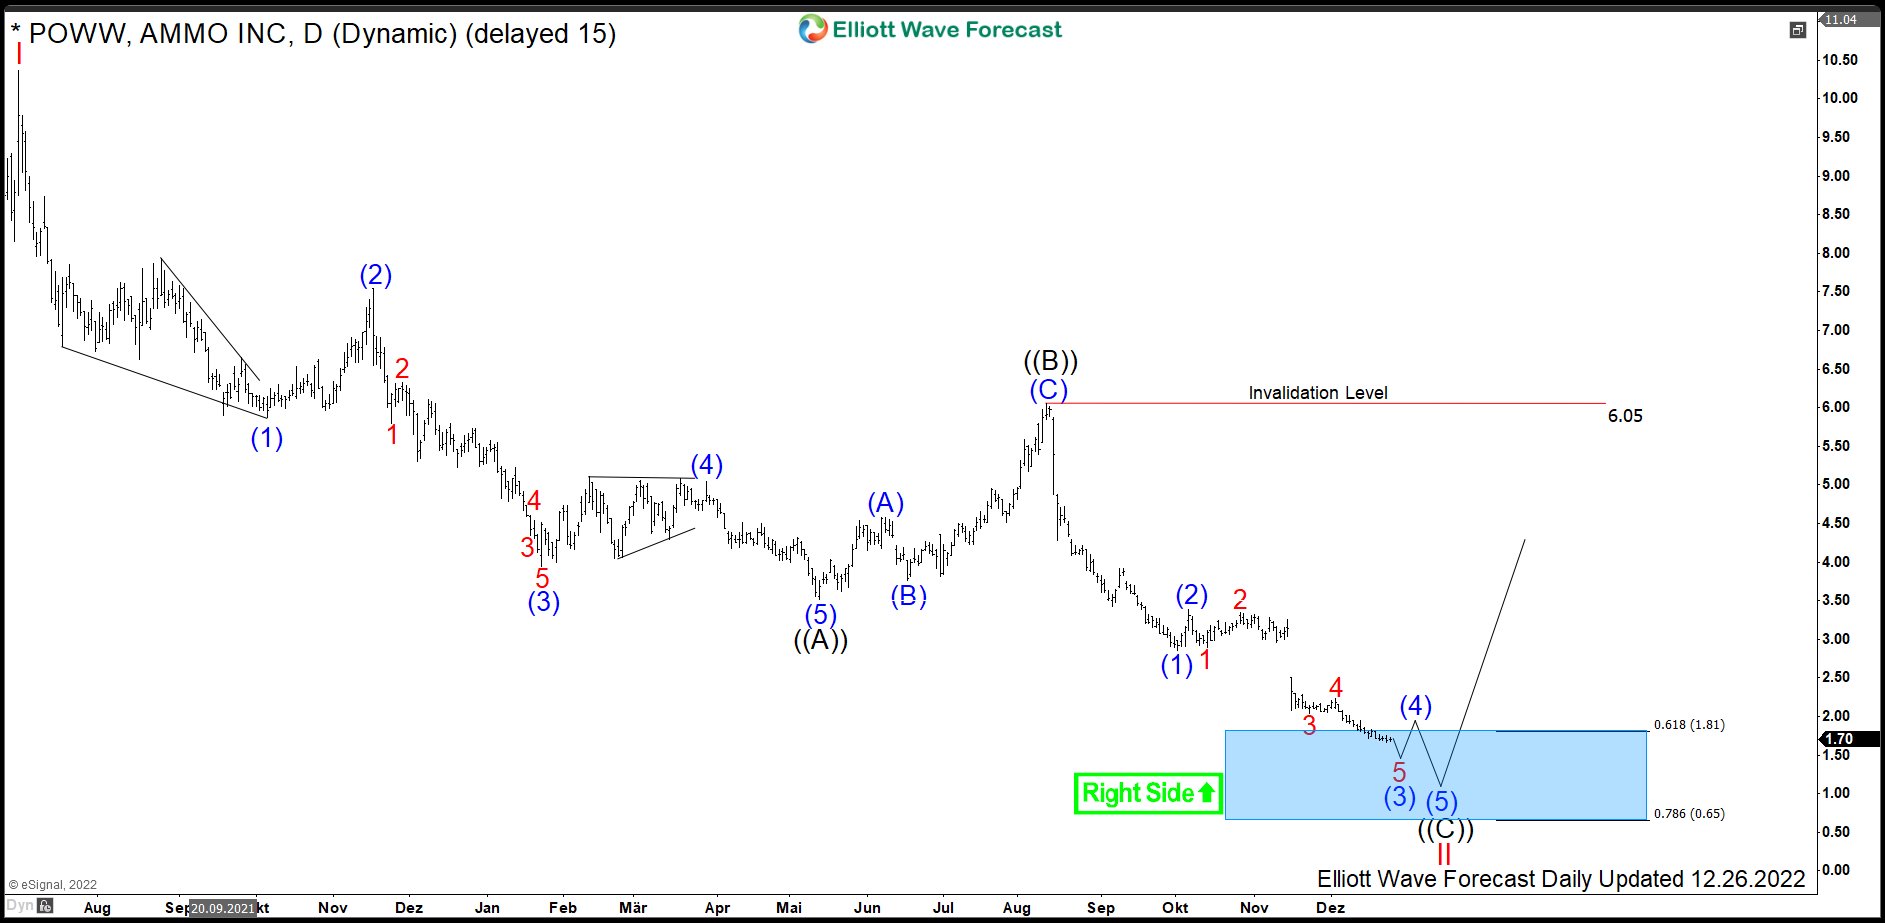
$POWW : How Close Can Be Bottom in Ammo Incorporated?
Read MoreAmmo Incorporated is an U.S. American defense company producing high-quality ammunition. The company owns STREAK (R), HyperClean and military ammunition technologies. Headquartered in Scottsdale, Arizona, USA, Ammo can be traded under the ticker $POWW at Nasdaq. In the article from October 2021, we have expected a 3rd swing within a correction from June 2021 to see a […]
-
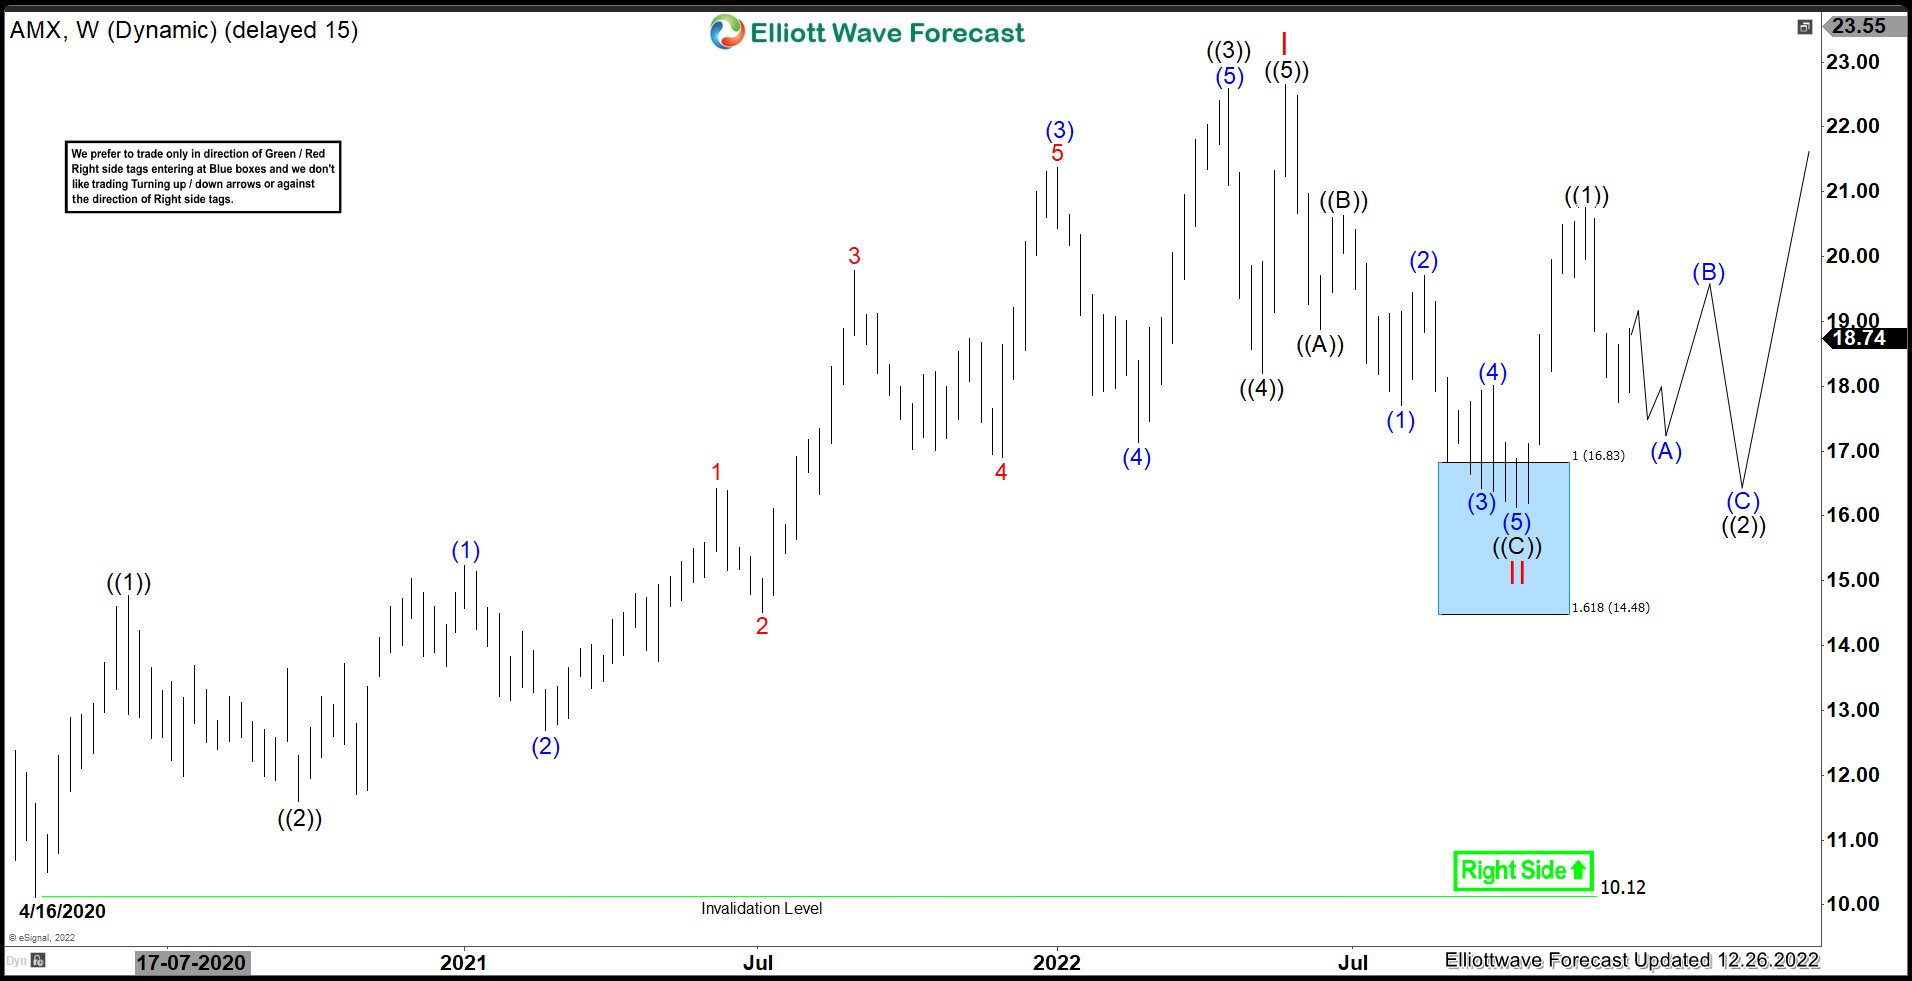
AMX: Should It Be Ready For Next Rally ?
Read MoreAmerica Movil, S.A.B. de C.V. (AMX) provides telecommunication services in Latic America & internationally. The company offers wireless & fixed voice services, including local, domestic & international long-distance services & network interconnection services along with data services. It is based in Mexico, comes under Communication services sector & trades as “AMX” ticket at NYSE. As […]
-
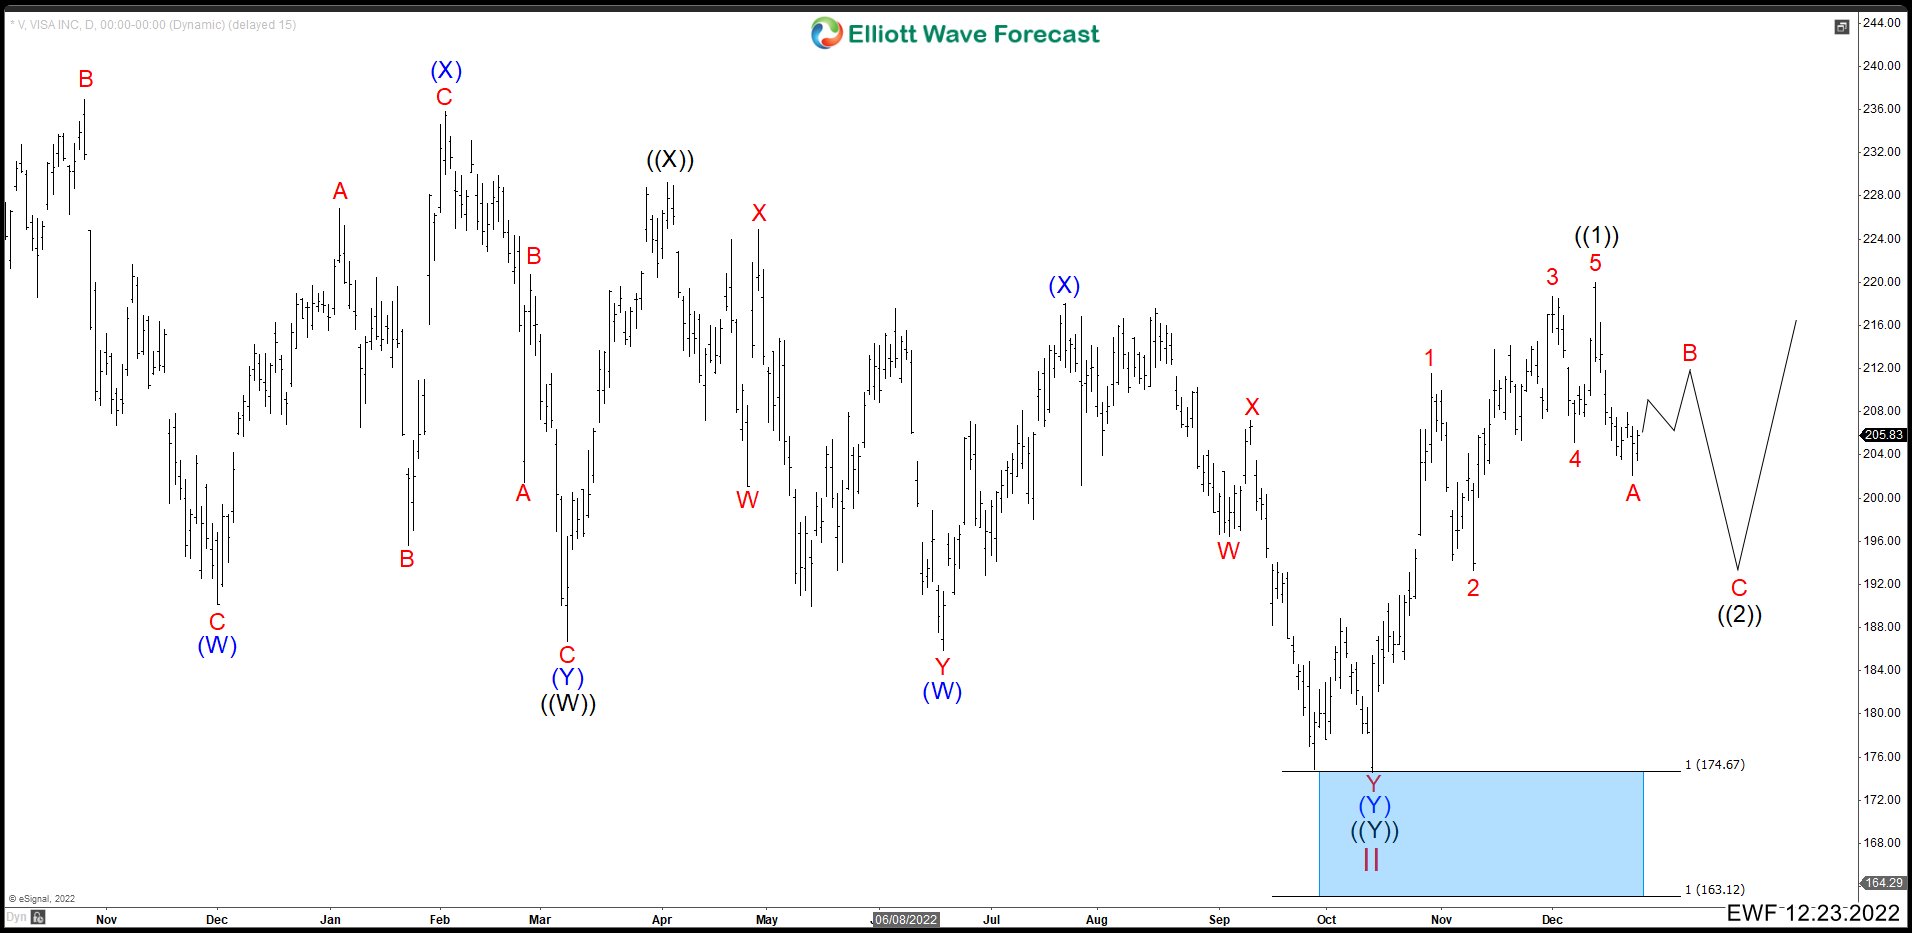
VISA (V) Completed A Double Correction And Rally
Read MoreVisa Inc. (V) is an American multinational financial services corporation headquartered in San Francisco, California. It facilitates electronic funds transfers throughout the world, most commonly through Visa-branded credit cards, debit cards and prepaid cards. Visa is one of the world’s most valuable companies. VISA (V) Daily Chart From September 2022 Visa (V) ended an important market cycle in July 2021 that started in March 2020. The rally reached […]
-
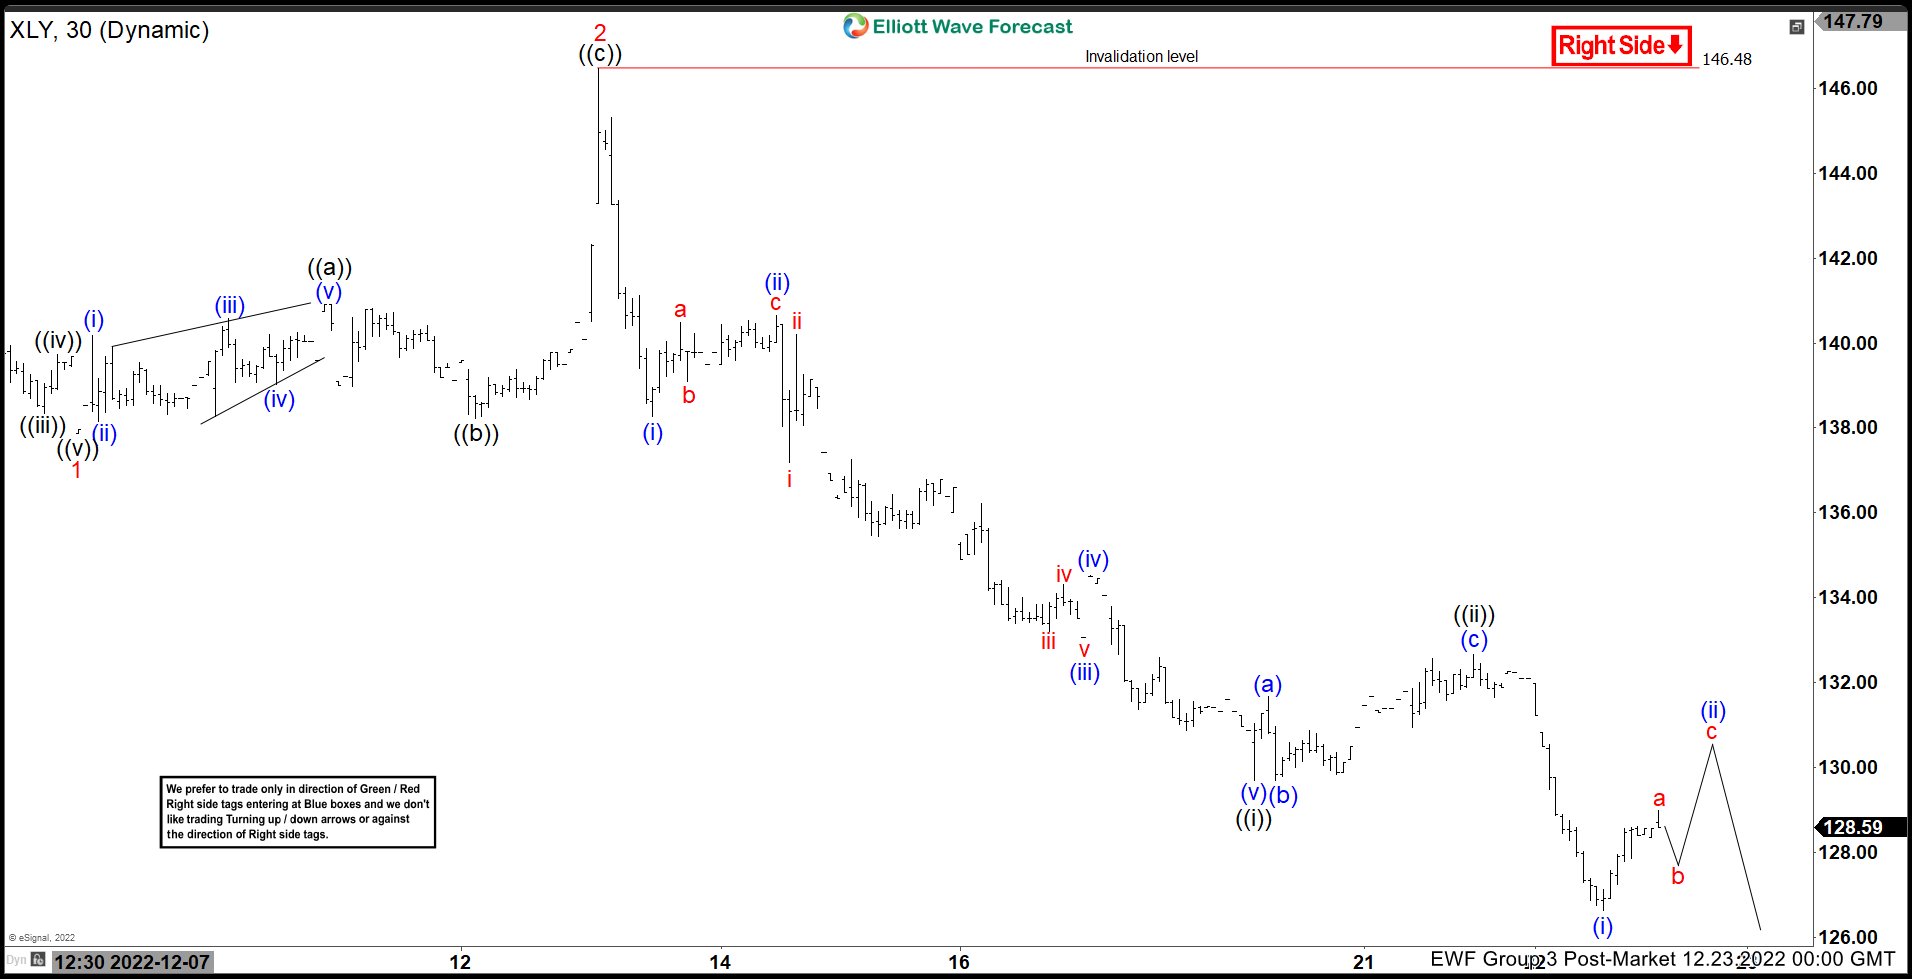
$XLY Forecasting the Decline and Selling The Rallies at Blue Box
Read MoreHello Everyone! In this technical blog, we are going to take a look at the Elliott Wave path in Consumer Discretionary ETF ($XLY). We keep telling members that $XLY is showing an incomplete bearish sequence in the higher timeframes and any rallies can be sold in 3 or 7 swings at blue boxes for more downside. […]
-
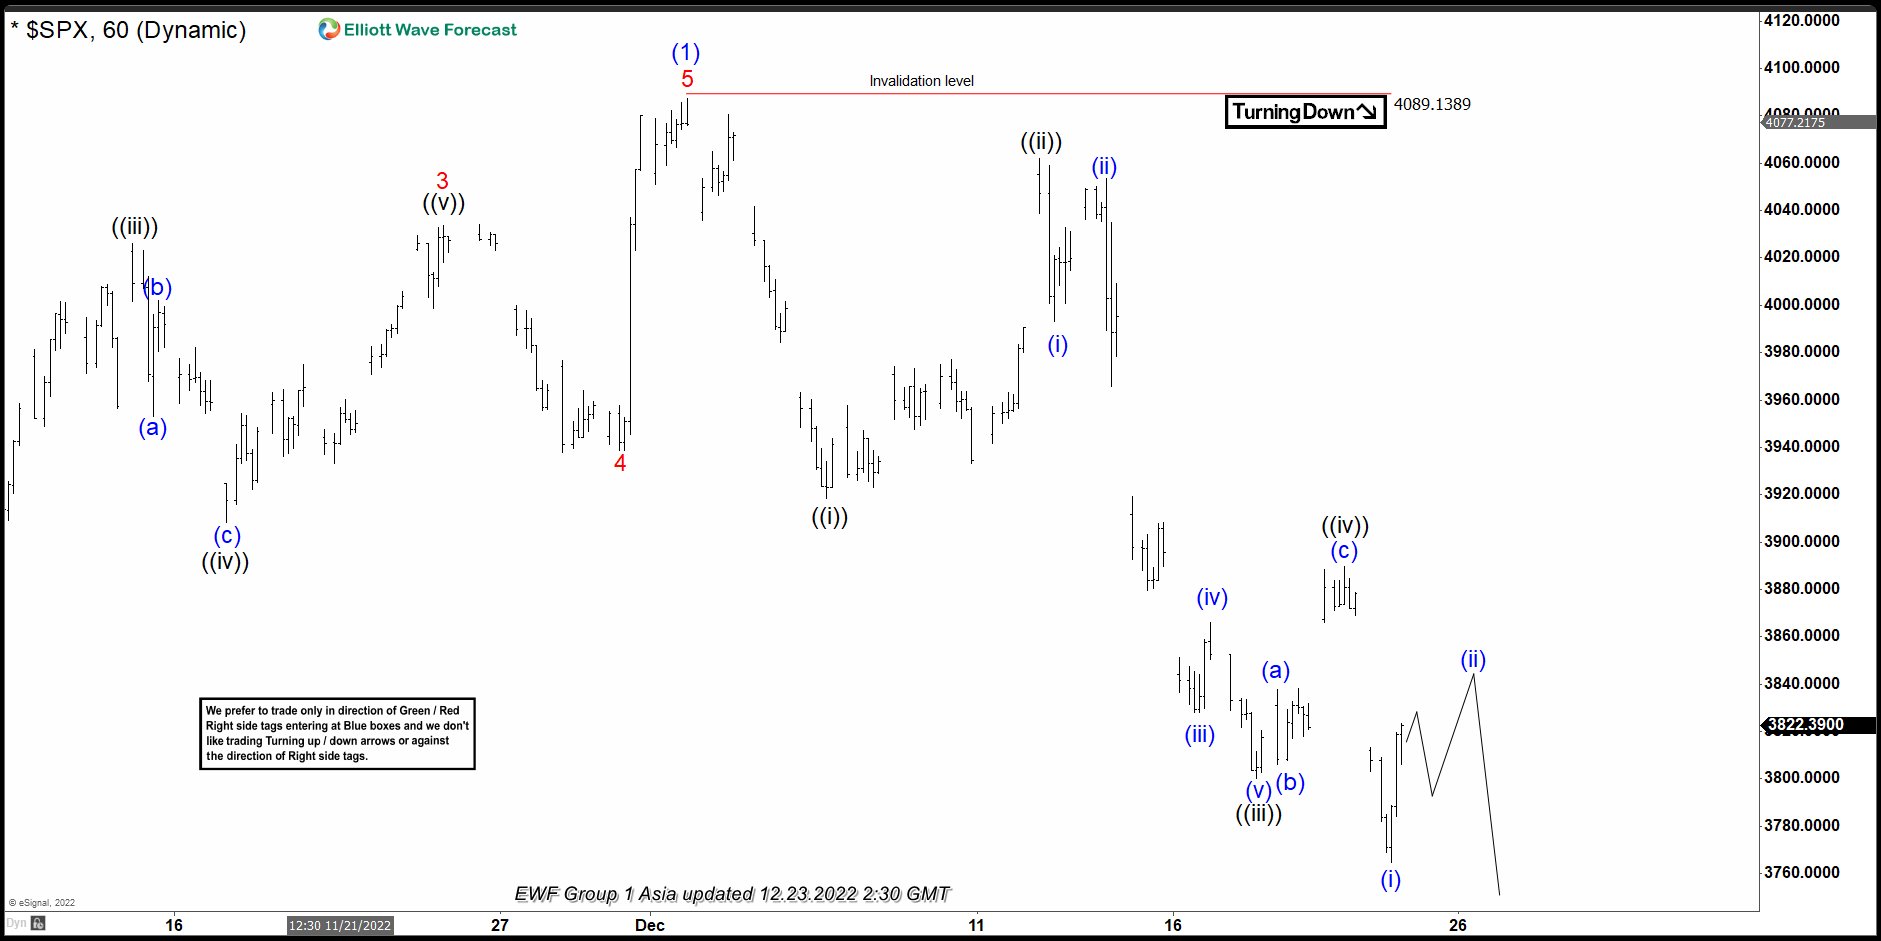
Elliott Wave View: S&P 500 (SPX) Expect Short Term Weakness To Continue
Read MoreShort term, Elliott wave view in S&P 500 (SPX) showing 5 swing sequence lower from 12.01.2022 peak of 4087.3 as the part of correction lower in (2) against 10.13.2022 low. Ideally, (2) expects to unfold in 3, 7 or 11 swings and should hold above 10.13.2022 low to turning higher. Below 4087.3 high, it starts […]
-
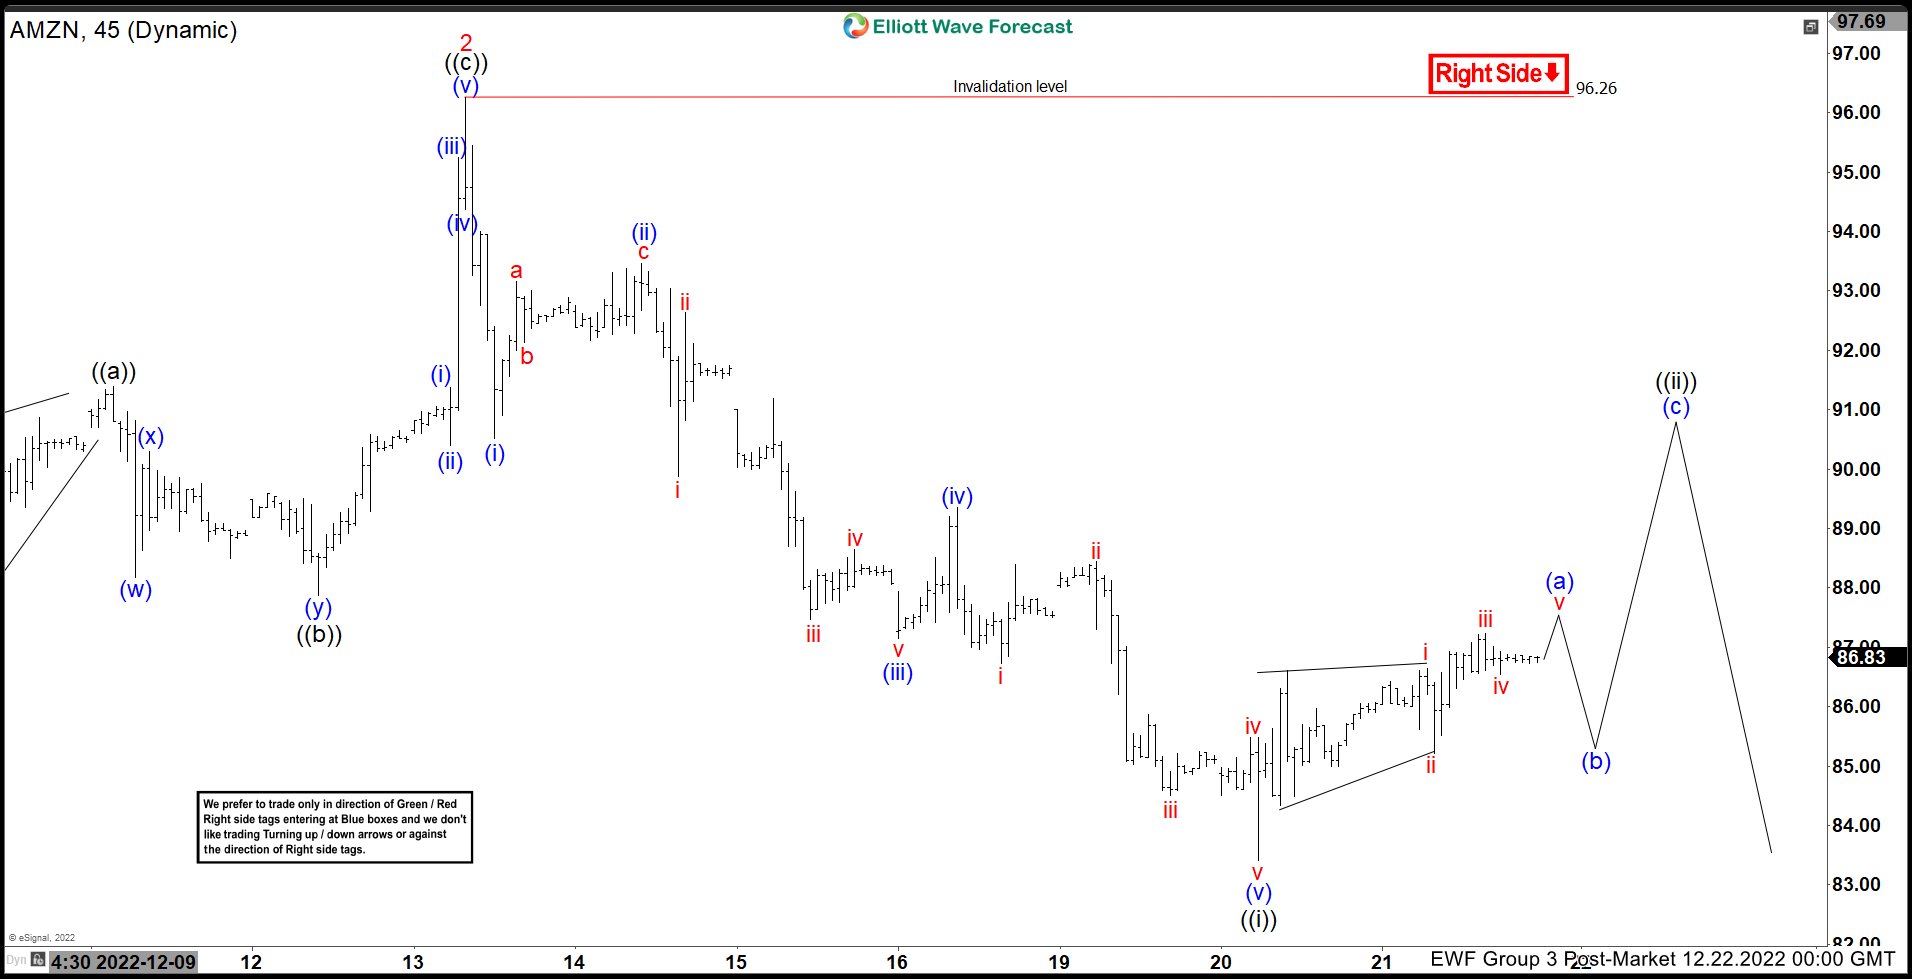
Elliott Wave View: Amazon (AMZN) Should Bounce Before Downside Resumes
Read MoreShort term Elliott wave View in Amazon (ticker; AMZN) suggests the decline from 12.13.2022 peak in 45 min chart, was clear 5 swings impulse lower, which ended ((i)) as the part of wave 3. The current sequence lower is the part of (3) of ((A)) in higher degree started from 11.15.2022 peak. It already confirms lower […]