NexGen Energy (NXE) is a Canada-based company with a focus on acquisition, exploration, and development of Canadian uranium projects. The company owns a portfolio of prospective uranium exploration assets in Athabasca Basin, which are some of the largest in the world. The stock has dropped 80% from its 2017 high to $0.50 / share at the March 2020 low. However, since then it has rallied 10x higher. It is speculative as it’s not yet producing uranium, but its potential and also the bullish uranium market prove to be supportive of the stock.
Nuclear Energy Production
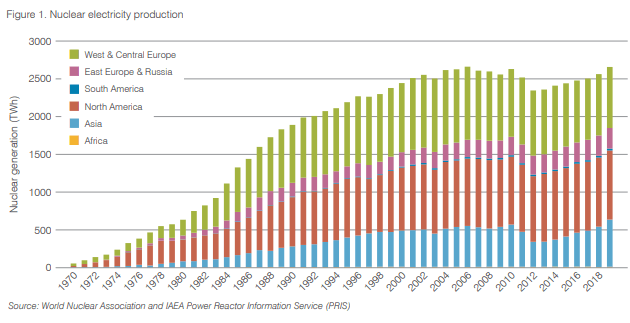
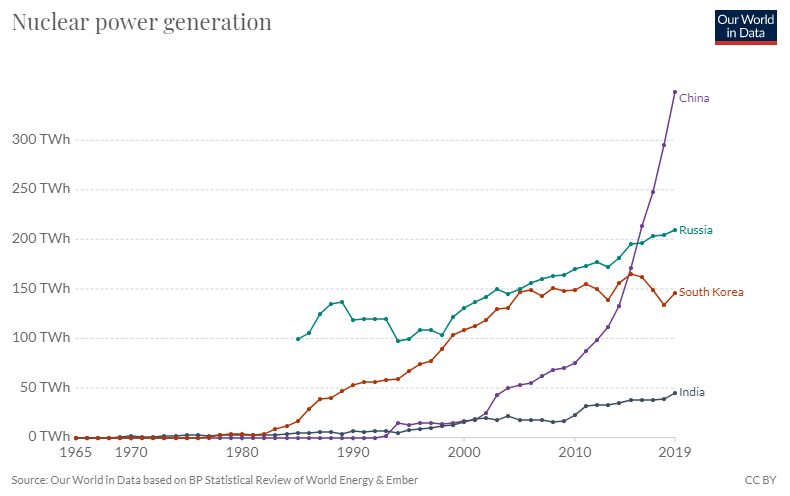
The chart above shows 50 years of nuclear energy production which is a good proxy for uranium demand. After the Fukushima disaster in 2011, many nuclear power plants came offline. However, we have seen a pickup in the demand again. Most of the growth in nuclear power plants came from emerging markets as the chart below shows:
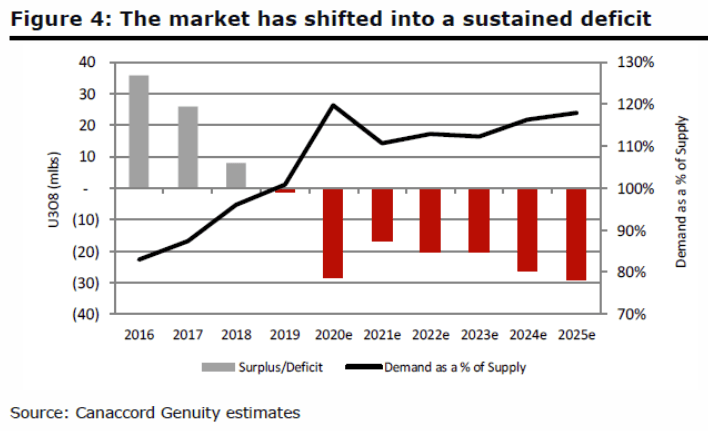
Supply on the other hand continues to decline starting from 2016 due to the low Uranium price. It has created a demand-supply imbalance. The Covid-19 further exacerbates the deficit and between demand and supply.
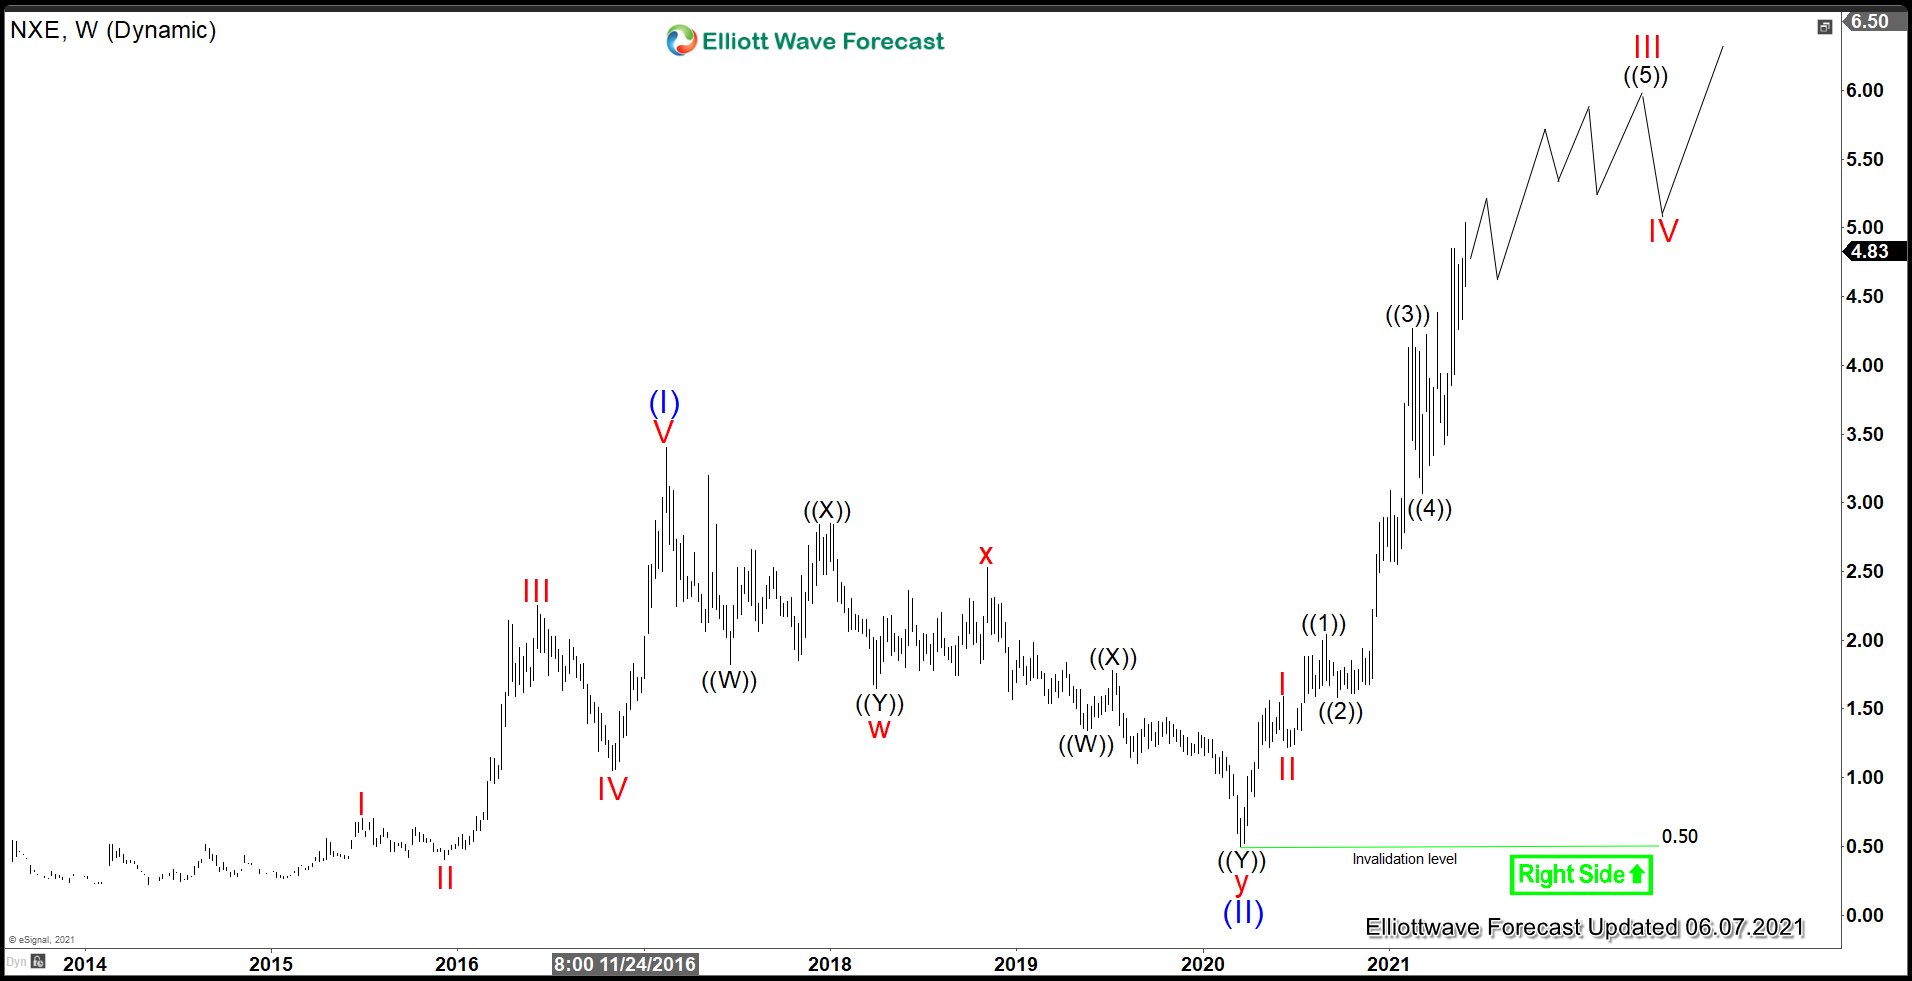
$NXE Weekly Elliott Wave Chart
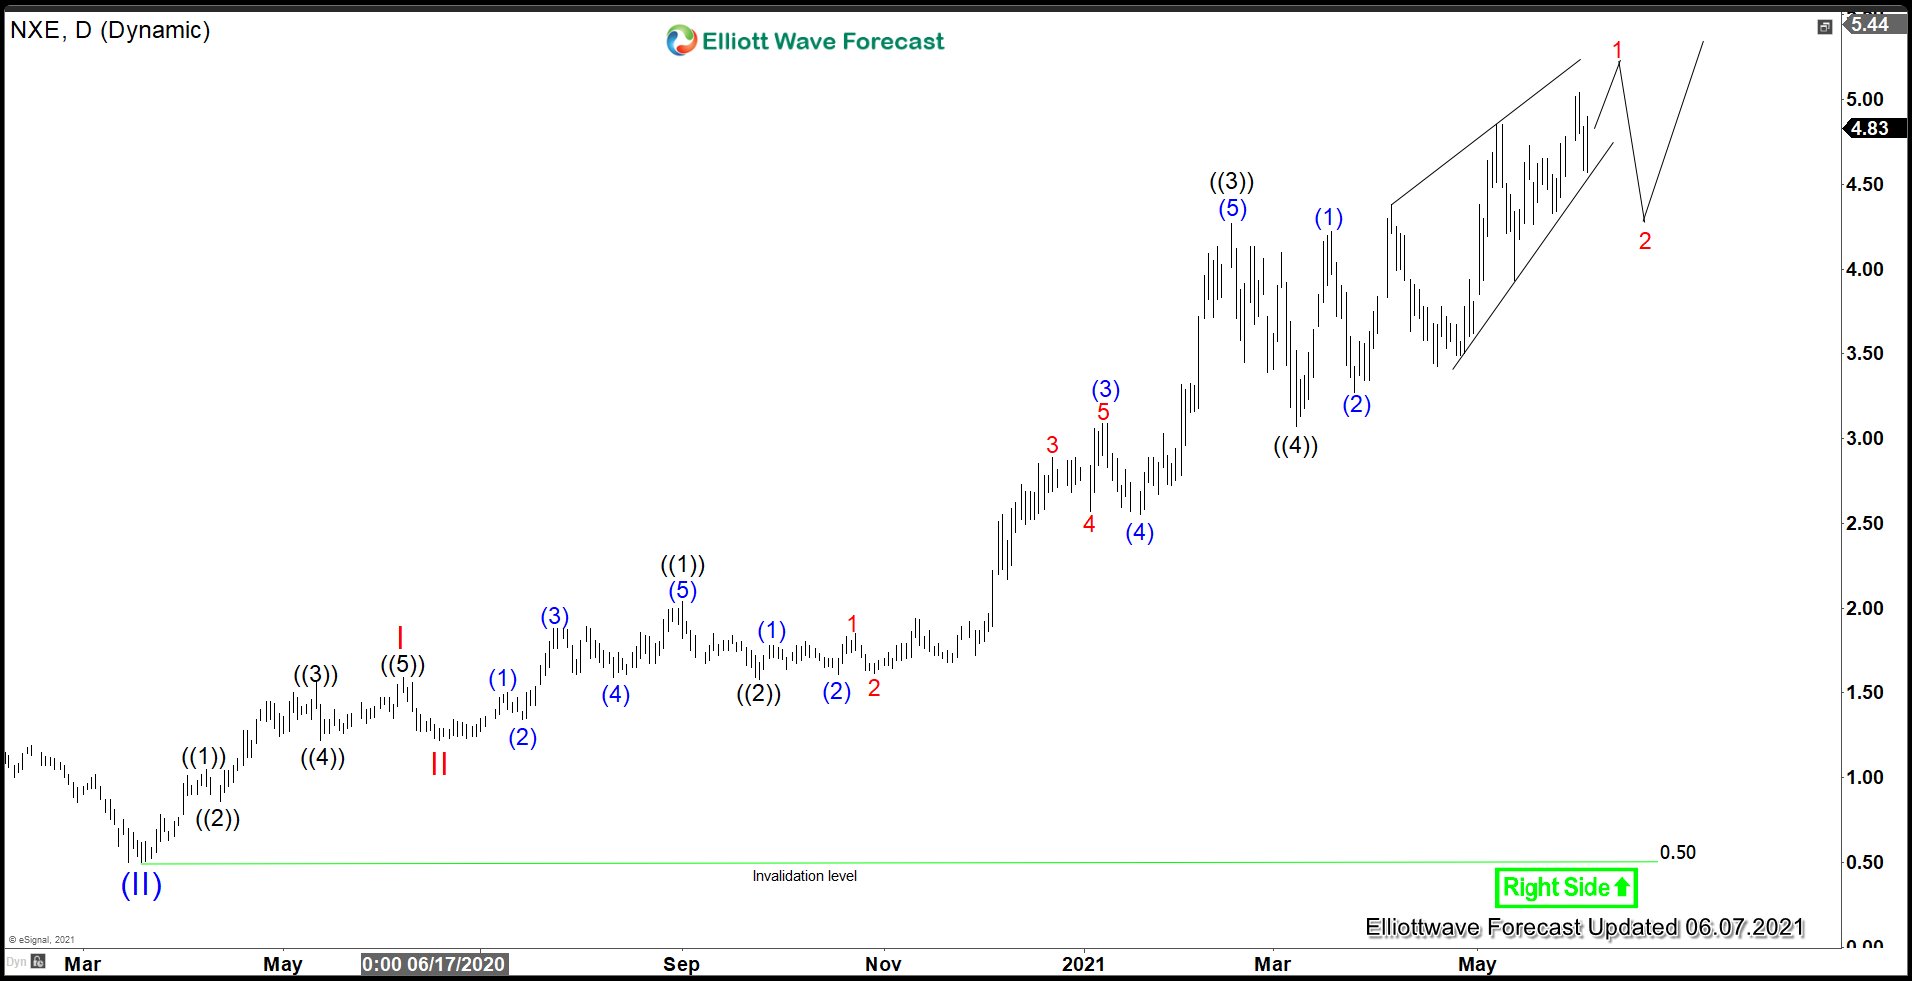
Weekly chart above shows the rally from all-time low unfolding as a 5 waves impulse Elliott Wave structure. Wave (I) ended at $3.04, and dips in wave (II) ended at $0.50. Wave (III) is currently in progress and unfolding as another impulse in lesser degree. Up from wave (II), wave I ended at $1.59 and pullback in wave II ended at $1.22. Expect the stock to remain supported and dips to find support in 3, 7, 11 swing for further upside.
$NXE Daily Elliott Wave Chart
We provide Elliott Wave charts for 78 instrument divided in 3 groups. We cover forex, Indices, commodities, U.S. stocks and ETF. If you’d like to know more about our service, please feel free to check our trial here –> 14 days FREE Trial
Back
