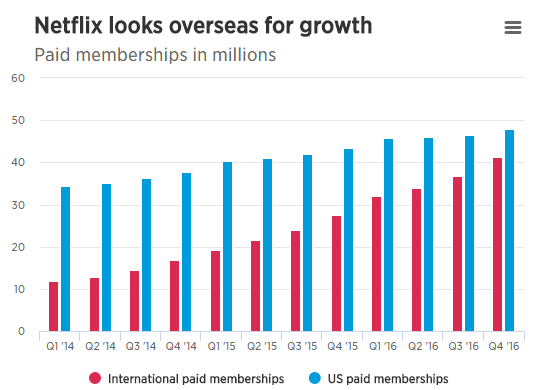
Netflix (NFLX) is an American multinational entertainment company that specializes in streaming media , film and television production , as well as online distribution and DVD by mail. Last week , the company posted its biggest-ever quarterly subscriber growth with 7.05 million new subscribers beating its own expectations of 5.2 million . As we can see in the chart below that Netflix international memberships is the one increasing rapidly helping the company to grow with the recent 5.12 million addition overseas compared to 1.93 million in the United States .
The streaming leader has a total of 93.8 million members , that’s slightly bigger than the audience for the 11 largest pay-television providers in the U.S. ( represents about 95% of the market ) , putting it far ahead of its competitive threat Amazon (AMZN) which announced in last December that it was expanding its Prime Video service to 200 countries, a less than a year after Netflix’s own international push to 130 additional countries .
After last weak Q4 announcement , Netflix shares surged as much as 9 percent after-market to make new all time highs reaching $145 . So is the bullish trend strong enough to continue the rally to new levels or the bulls will soon get tired and reverse the move to the downside ?
Netflix Elliott Wave Technical Analysis
NFLX move from the all time lows to recent new highs is counted as 5 swings and depending on the nature of the subdivision we can then define the whole structure . In this case , each swing is subdivided as Zigzag abc forming a Diagonal structure which means the stock is already in the final stage of ending multi-year cycle .
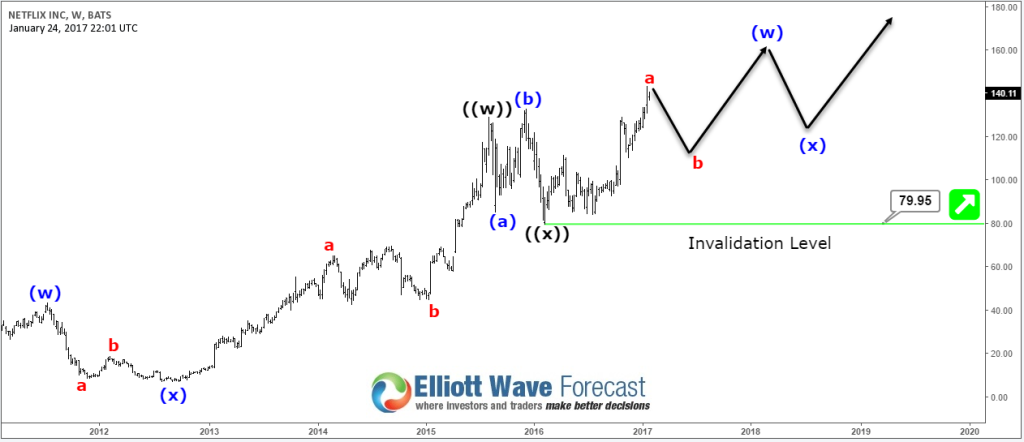
Looking at the weekly chart , the stock is entering the extreme area to end the 5th wave and the final target would be around $160 – $170 , which can be seen either in the coming years if NFLX currently starts correcting 2016 cycle before resuming higher or it can be reached later this year if the stocks only do a shallow pullback then continue higher .
NFLX Weekly Chart Scenario (1)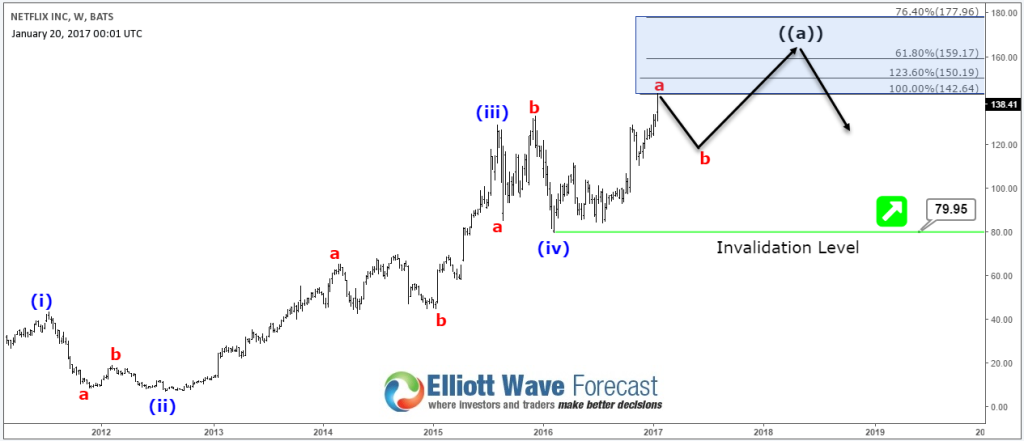
NFLX Weekly Chart Scenario (2)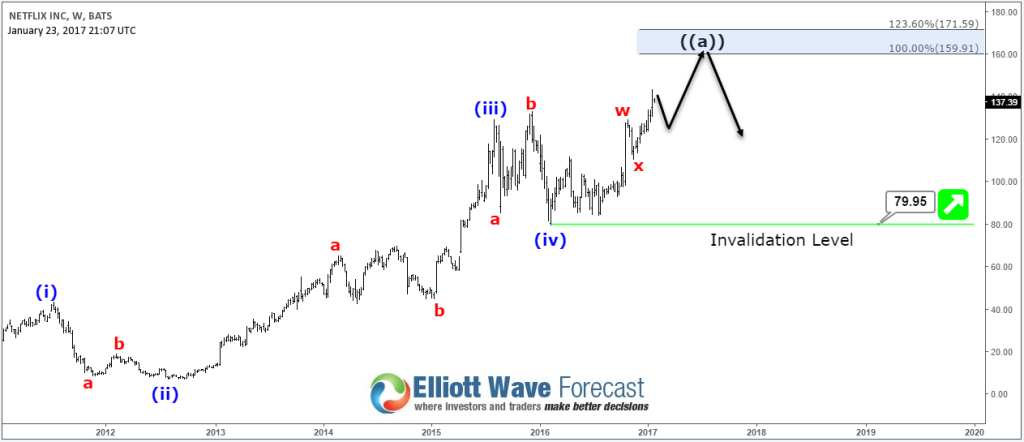
After ending the 5th wave higher , a larger 3 waves pullback should happen which will take the stock back below $100 . However , at EWF , we believe that market can also advance in a corrective structure and we don’t try to force 5 waves move in the market unless it’s the case . That’s why we don’t try to to pick a top or bottom and we don’t fight against the main trend which is currently bullish for NFLX , we let the market guide us with movements and we adjust to changes .
Consequently , we consider Netflix doing a Double Three wxy structure and the stock is showing 5 swings incomplete bullish sequence with divergence , which means that it should remain supported and pullbacks can be bough in 3 , 7 or 11 swing while the pivot at $79.95 low keeps holding looking for a target above $200.
The agressive bullish view for Netflix would be a double a three from February 2016 low with a connector in place in the November 2016 pullback , so as long as $110.68 pivot is holding , the stock should find buyers after a corrective pullback looking for a target at equal legs area $159.9 – $171.5 or at least a 3 waves bounce.
NFLX Weekly Chart Scenario (1)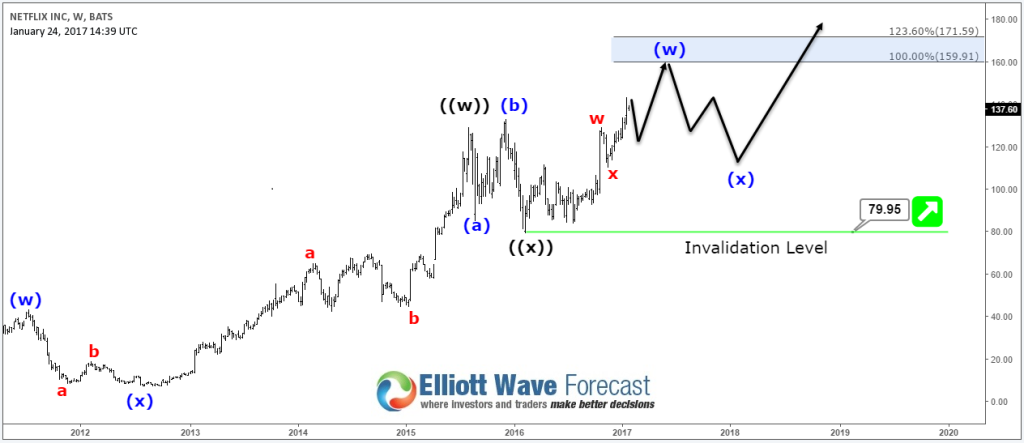
NFLX Daily Chart Scenario (1)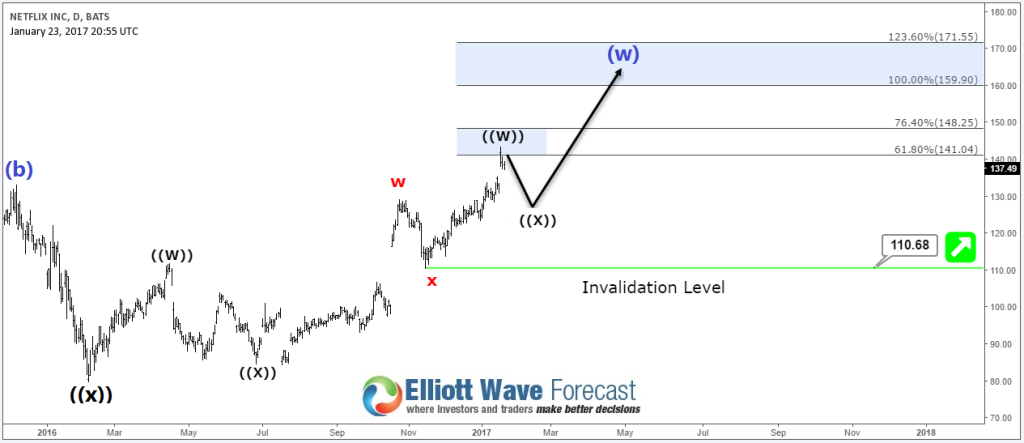
The less agressive view would take place if November pivot $110.68 gives up , so in that case Netflix would have ended the 2016 rally as 5 waves diagonal and should see a pullback to around 50%-61.8% area ( $111.6 – $104.1 ) where the stock should aslo find buyers as long as pivot at $79.95 is holding looking again for $159 area or 3 waves bounce at least .
NFLX Weekly Chart Scenario (2)
NFLX Daily Chart Scenario (2)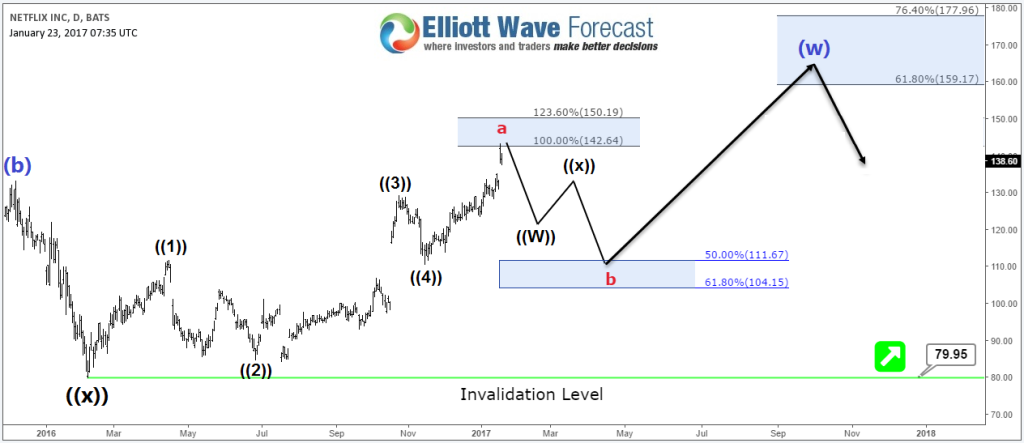
Recap
Since going public in 2002 , Netflix surged from few cents to the recent highs at $143 so overall it’s considered as one a the best investment in the recent decade . The technical picture showing more upside to come in both scenario ( Diagonal or Double Three ) so bulls are still hungry for new highs and the market will always provide a trading opportunities .
If you enjoyed this article, feel free to take a look at our Technical Blog and also check the Chart of The Day .
For further information on how to trade forex, indices, commodities and stocks using Elliott Wave technique , try us 14 days for FREE . You will get access to our Professional Elliott Wave analysis in 4 different time frames, Daily Elliott Wave Setup Videos , Live Trading Room and 2 Live Analysis Session done by our Expert Analysts every day, 24 hour chat room support, Weekly Technical videos and much more so if you are not a member yet, use this opportunity and sign up to get your FREE trial .
