Nasdaq futures dropped from a peak of 15710.42 on September 6, 2021 to a low of 14711 on September 29, 2021 which is a drop of 997.75 points in just over 3 weeks and reflects a 6.36% drop. In this blog, we will look at how we forecasted the decline in Nasdaq Futures (NQ #F) based in it’s Elliott wave structure. We will also show the next blue box area which is the next swing trading area and should produce 3 waves reaction at least.
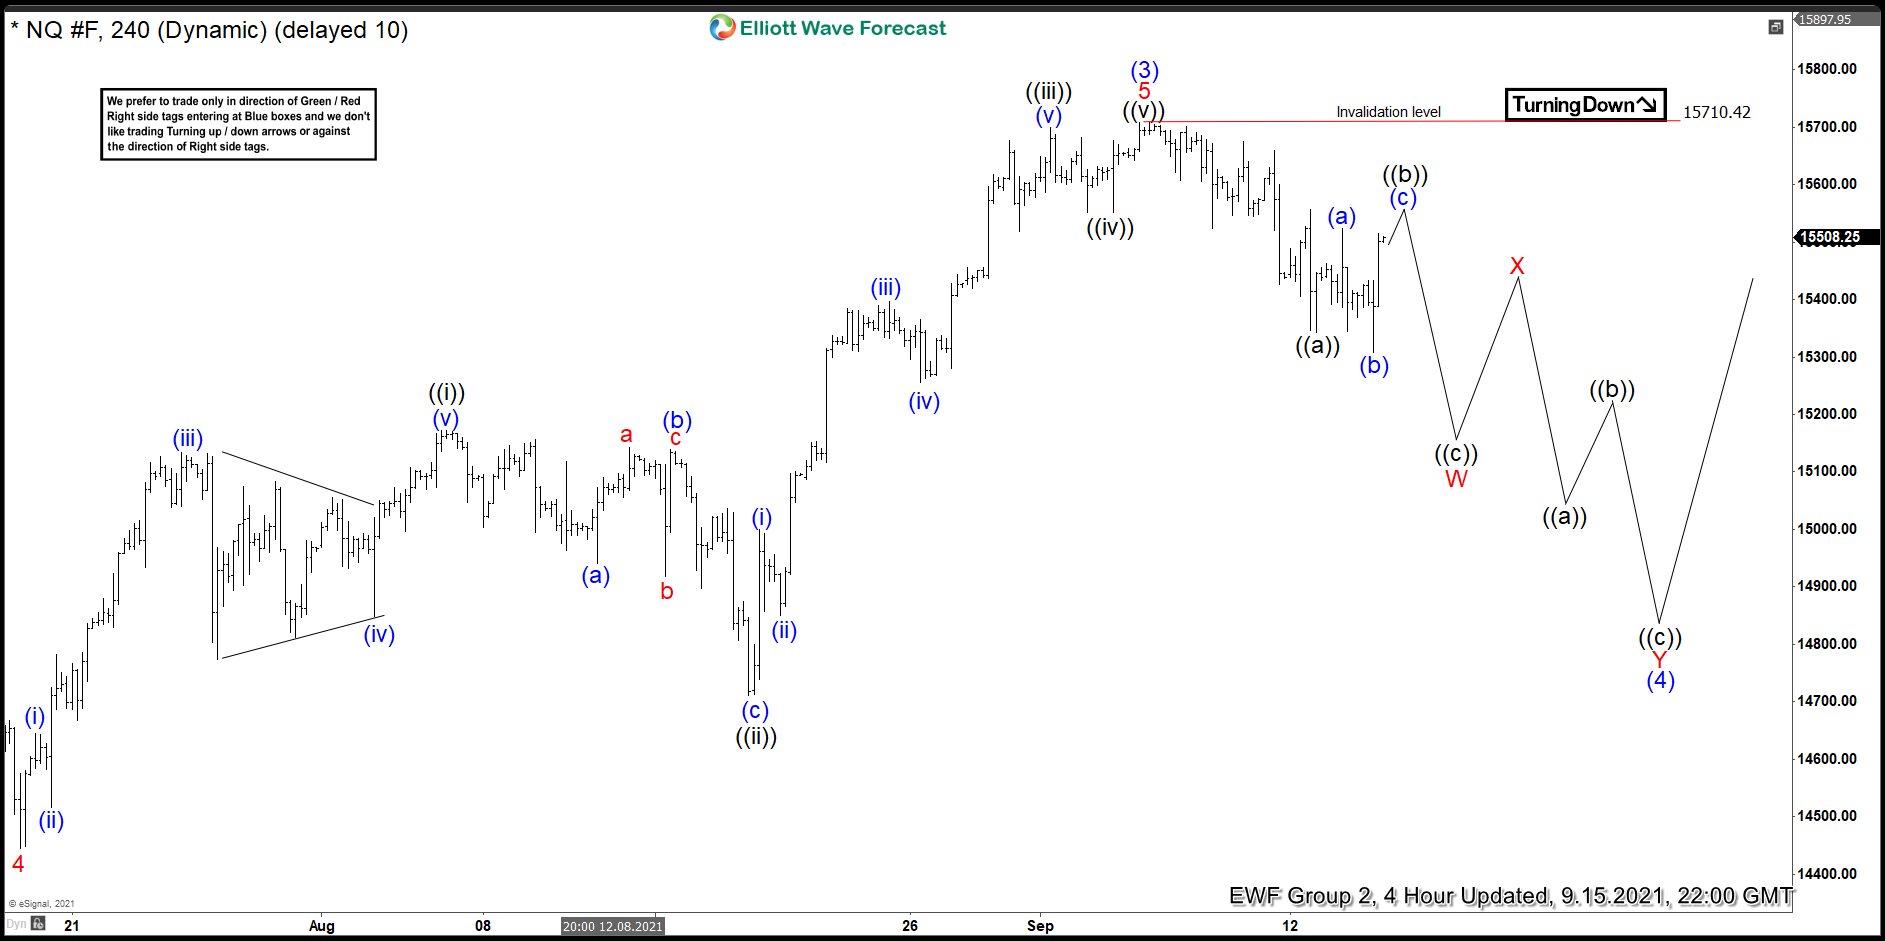
Nasdaq Futures 4 Hour Elliott Wave Analysis September 15, 2021
4 Hour Elliott Wave Analysis from September 15, 2021 showed wave (3) had completed at 15710.42 on September 6, 2021 and a pull back in wave (4) had started. Decline from 15710.42 was in 5 swings which was labelled as wave ((a)) so we expected bounces to fail below 15710.42 peak for 1 more leg down to complete wave W. Even though 3 swings would have been enough to call wave (4) correction completed but based in market correlation and incomplete bearish sequence in Nikkei Index (not shown), we went with the idea of a double correction lower in wave (4).
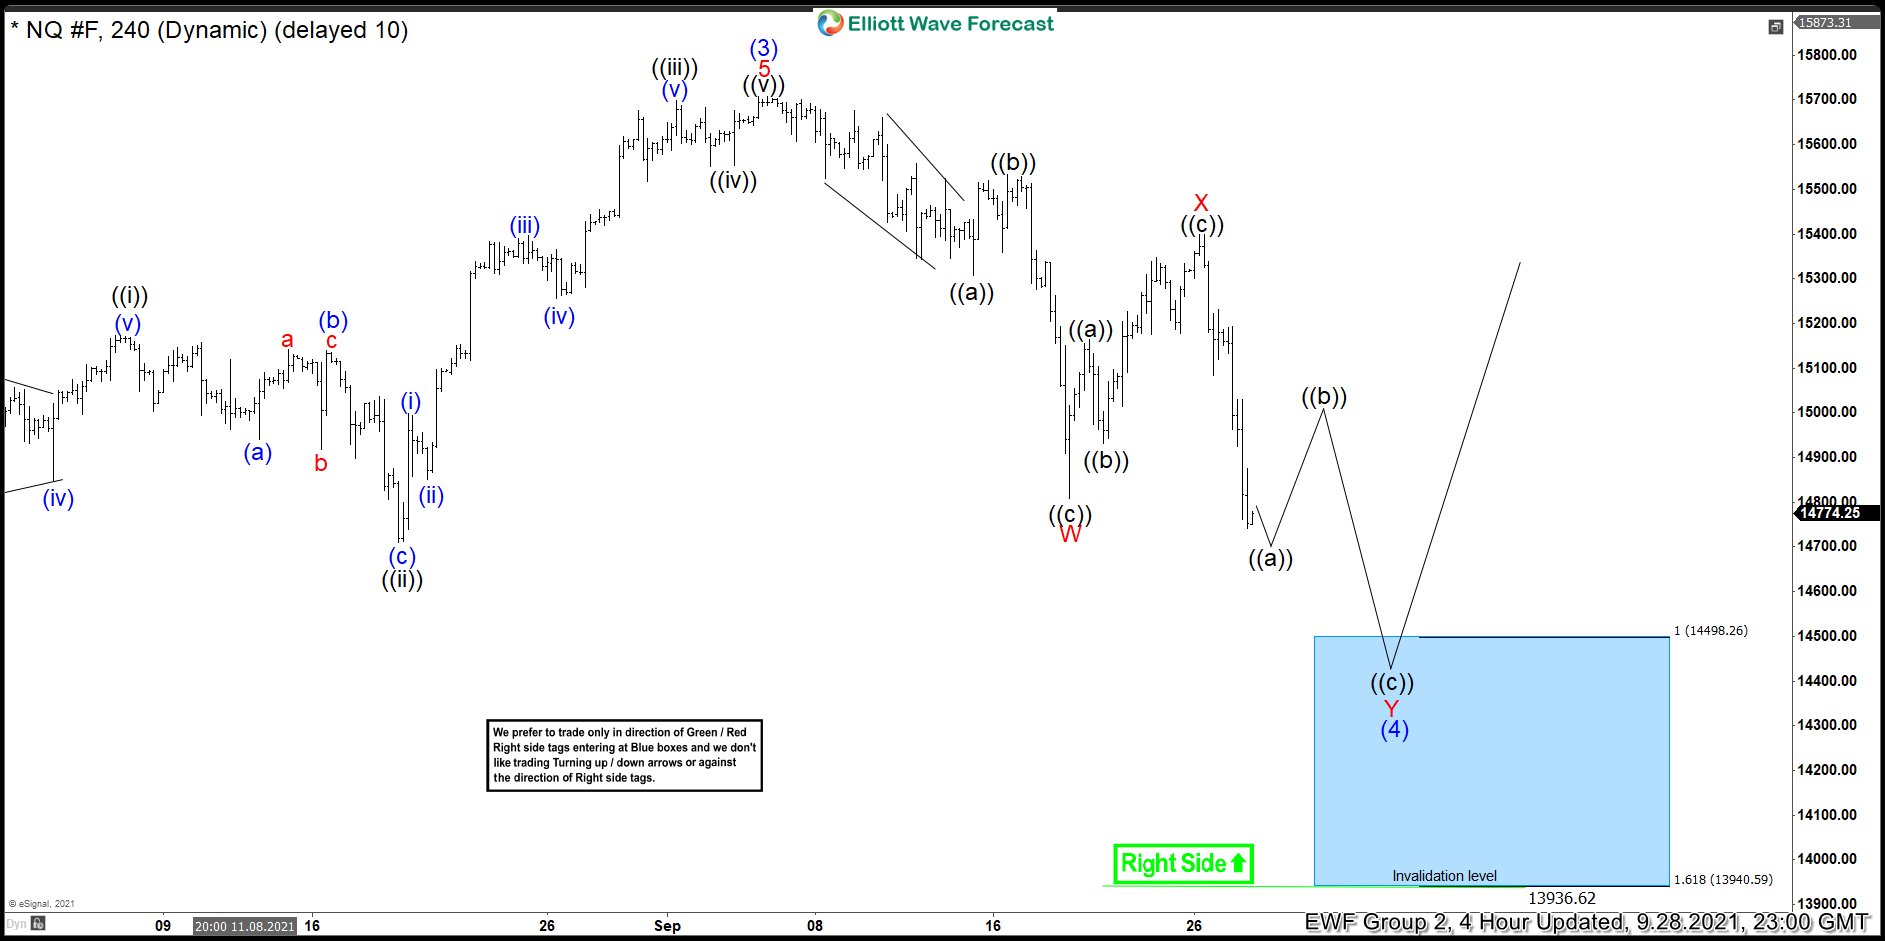
Nasdaq Futures 4 Hour Elliott Wave Analysis September 28, 2021
Nasdaq Futures made a push lower to complete wave W at 14807.50 (September 20, 2021) and bounce strongly but the bounce failed to make a new high stopping at 15399.25. After this, Index futures turned lower again and made a new low below September 20, 2021 low which makes it a 5 swings Elliott wave sequence. Since decline from September 6, 2021 peak is corrective and 5 is part of an impulsive sequence, this means sequence from September 6, 2021 peak is incomplete and we need at least 7 swings to complete the sequence. Therefore, we expect bounces to fail below 15399.25 wave X high for another extension lower towards 14498.26 – 13940.59 to complete 7 swings sequence down from September 6, 2021 peak. We have marked this area with a blue box because we expect buyers to appear in this area to either resume the rally for a new high above 15710.42 or for a larger 3 waves reaction higher at least.
Back


