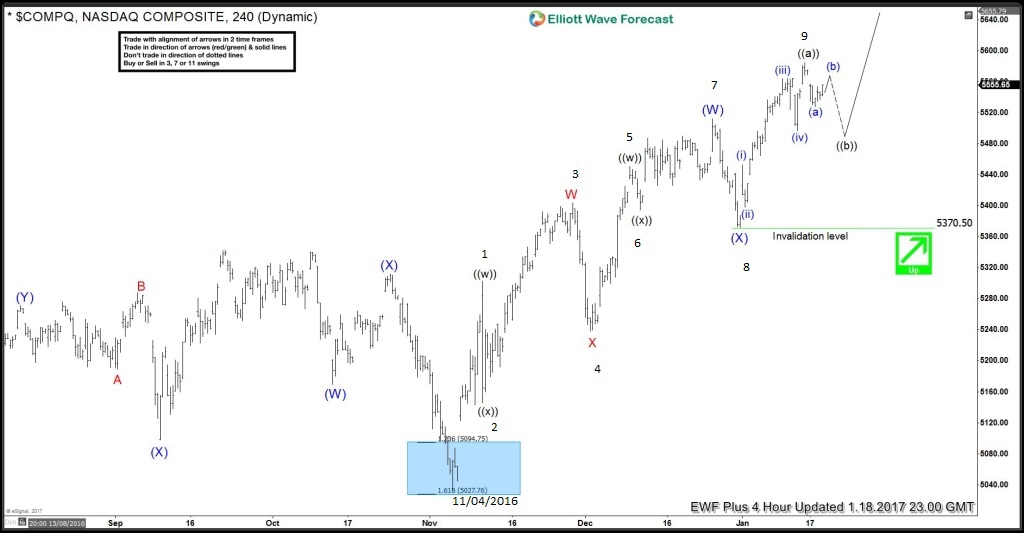
in this technical blog, we are going to take a quick look at past performance of NASDAQ Composite charts from January 2017, which we presented to the clients at elliottwave-forecast.com. Below is the 4 hour chart from January 18,2017, showing the sequence of higher highs in the index from November 04,2016 lows. Also if we count the swing sequence, we can clearly see that the price action from November lows looks to be in 9 swings or 5 swing sequence, which needed some more upside to reach the extreme from that low. Hence with that bullish sequence in the index, our strategy was to buy any dip in sequence of 3, 7 or 11 swings against December 30 low (5370) in first degree for more upside extension.
NASDAQ 4 hour chart from 1/18/2017
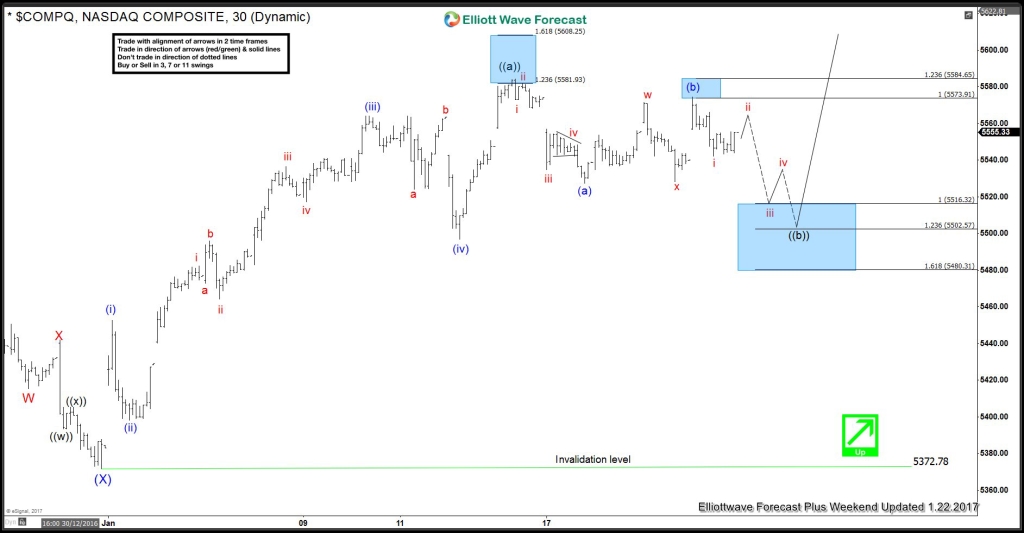
Below is the 1 hour weekend updated chart showing the 5 waves movement from 5370 lows labeled as ((a)) higher, which was another bullish sequence in the index, as elliott wave theory suggest that after 5 waves move there should be a 3 swing pullback & afterwards another 5 wave move should happen in the direction of previous leg, which is also known as zigzag (5,3,5) structure. Similarly the index was doing 3 swing pullback to correct the cycle from 5370 low in wave ((b)) pullback towards 5516-5502 blue box area before finding buyer’s again.
NASDAQ 1 hour weekend updated chart from 1/22/2017
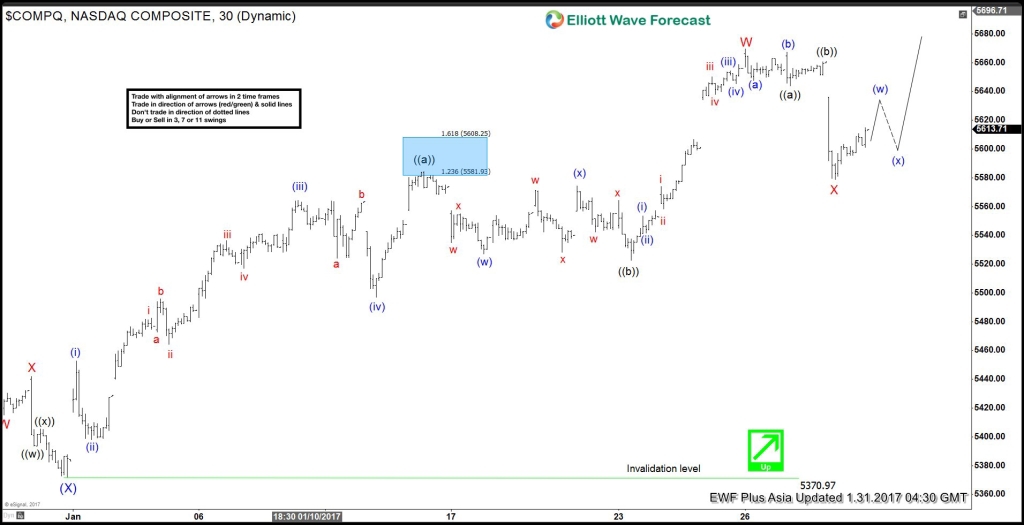
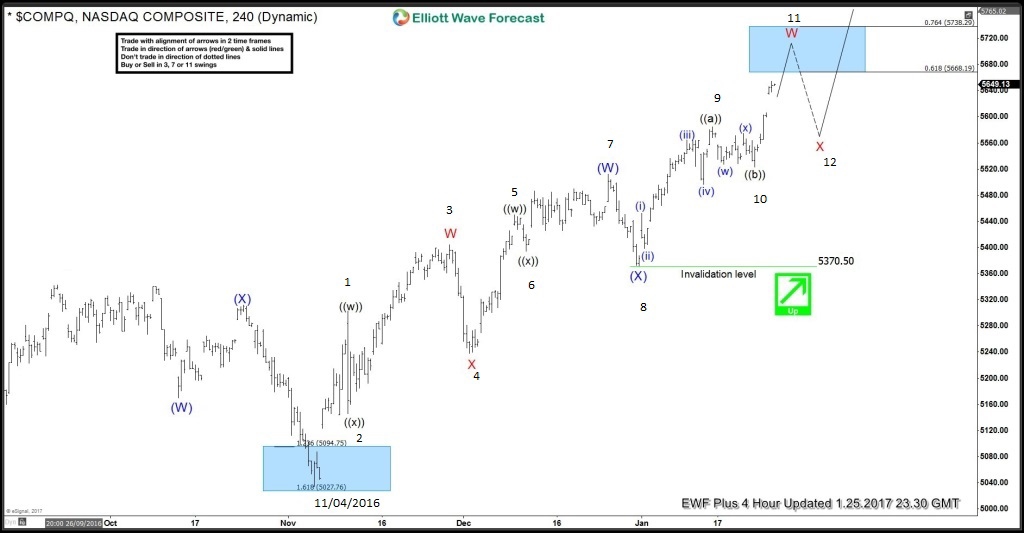
Since then index found the buyer’s as expected, as can be seen in 4 hour chart from January 25, 2017. Which reaches the initial target area at (5668-5738) 0.618-0.764% fib ext area of (W)-(X) within wave W in red higher to end the cycle from 5370 low, afterwards index was expected to see another 3 swing pullback to correct that cycle before further upside was seen to complete the bullish sequence in the index.
NASDAQ 4 hour chart from 1/25/2017
 The index made another 3 swing pullback from above mentioned area as expected in wave X in red pullback to correct the cycle from 5370 low, which ended as irregular correction at January 31 low (5577). As the pullback was too shallow & appeared to be a flat correction, we didn’t got the chance to buy the instrument again. However we advised our clients the longs from previous lows, should put on hold with initial profit taking at 5668-5738 area.
NASDAQ 1 hour updated chart from 1/31/2017
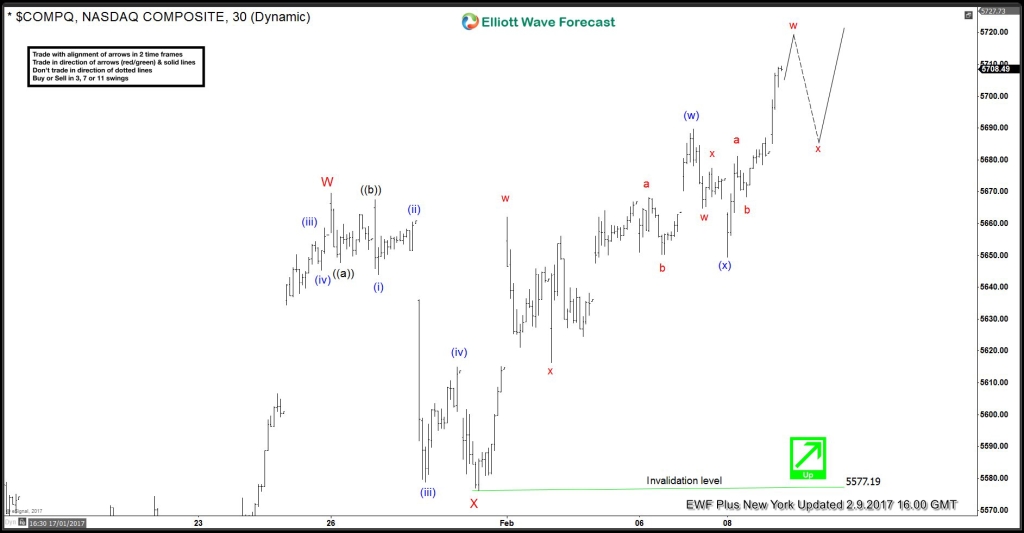
Here’s the latest 1 hour chart from February 9, showing the price action after the completion of red wave X. Since then index has rallied to new highs & looking for higher targets as far as trading against 5577 low.
NASDAQ 1 hour NY updated chart from 2/09/2017
Keep in mind that the market is dynamic and the view could change in the mean time. Success in trading requires adequate risk and money management, as is the understanding of Elliott Wave theory, cycle analysis and correlation. We have developed a very sensitive trading strategy that defines entry, stop loss and take profit levels with high accuracy and allows you to take risk free position shortly after taking it by protecting your wallet. If you want to learn all about it and become a professional trader, register now and get Free 14 day trial.
Back