Morgan Stanley (MS), a financial holding company provides various financial products & services to corporations, governments, financial institutions & Individuals in the Americas, Europe, Middle East, Africa & Asia. It operates through Institutional Securities, Wealth Management & Investment management services. It is based in New York, US, comes under Financial services sector & trades as “MS” ticker at NYSE.
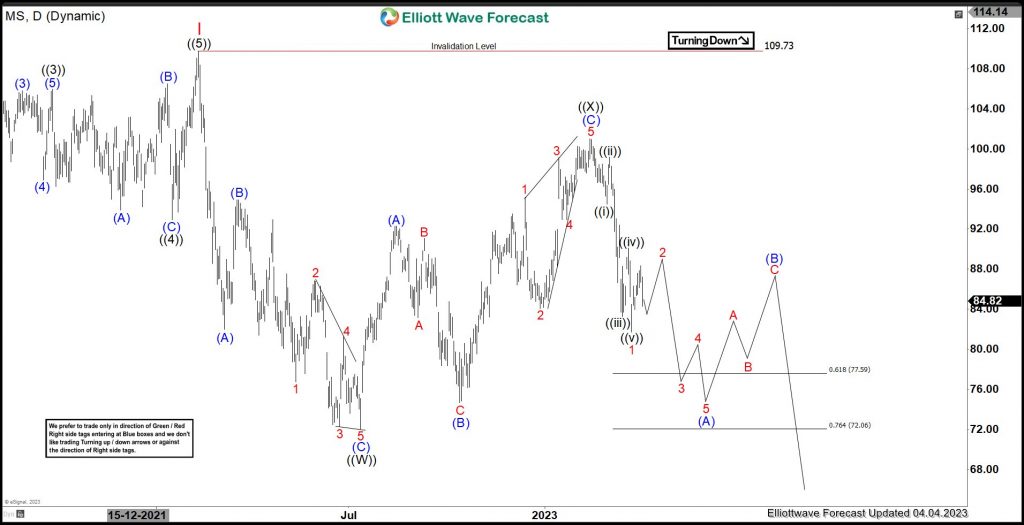
As mentioned in previous article, MS favors weakness in (A) of ((Y)) in wave II correction & expect weakness to continue below wave 2 high of $91.82. It favors lower in wave 3 of (A) & expect sideways to lower.
MS – Elliott Wave View From 04.04.2023:
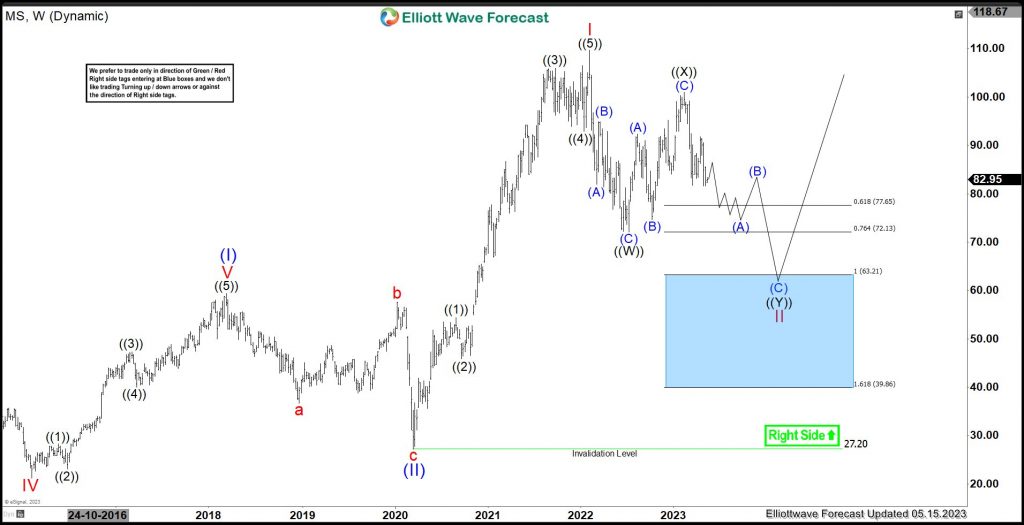
From October-2008 low, it ended (I) as impulse at $59.38 high & (II) at $27.20 low in Super Cycle. It placed I at $109.73 high in Cycle degree & favors pullback in ((Y)) of II in double correction in weekly before upside resumes in III of (III). Below wave I high, it placed ((W)) at $72.05 low in 3 swing sequence. It placed ((X)) at $100.99 high on 2.14.2023 in 3 swing bounce. Below ((X)) high, it favors lower in ((Y)) leg, which confirms, when breaks below ((W)) low & extend lower towards $63.21 – $39.86 area as weekly blue box to finish II correction before upside resumes.
MS – Elliott Wave Latest Weekly View: 
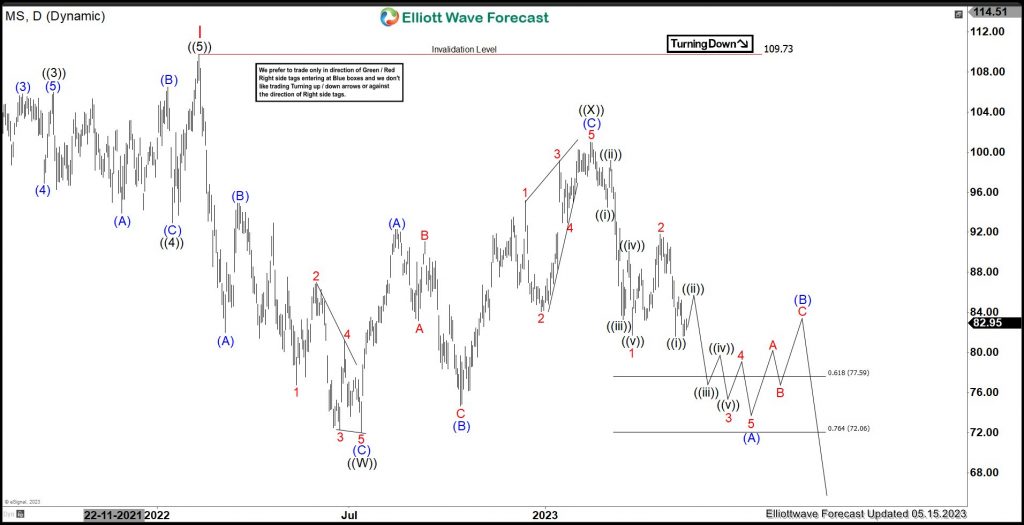
It placed 1 of (A) at $81.72 low & 2 at $91.82 high. Below there, it favors lower in wave 3. It placed ((i)) at $81.61 low & favors bounce in ((ii)), which fail below wave 2 high to resume lower in ((iii)) of 3. It expects (A) to finish between $77.59 – $72.06 area before start bouncing in (B) of ((Y)). Alternatively, it may unfold as (W) instead of (A) in 3 swings sequence from ((X)) high as double correction in ((Y)) wave. (W) also expects to find support between $77.59 – $72.06 area before a bounce in (X). Later, it resumes lower in (Y) of ((Y)) towards weekly blue box area to finish II correction. In either the case, it expects weakness to continue.
MS – Elliott Wave Latest Daily View: 
Elliottwave Forecast updates 1-hour charts four times a day & 4-hour charts once a day for all our 78 instruments. We do a daily live session, where we guide our clients on the right side of the market. In addition, we have a chat room where our moderators will help you with any questions you have about what is happening in the market at the moment. You can try us for 14 days for only $9.99.
Back
