Huya Live is a Chinese video live streaming service. The site is one of the largest of its kind in China. Globally, it operates as Nimo TV. The primary focus of the service is on video game live streaming. Also, it broadcasts other genres like traditional sports, cooking and other streams. Huya Live has been launched 2014 by YY.com which is a subsidiary of JOYY Inc. Today, the majority vote of Huya Live belongs to Tencent with minority to JOYY. One can trade the stock of the company under the ticker $HUYA at Nasdaq.
Huya Weekly Elliott Wave Analysis 1.3.2023
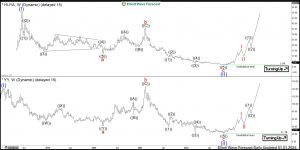
The upper part of the weekly chart below shows the Huya Live shares $HUYA traded at Nasdaq. From the lows, the stock price has developed an initial cycle higher in blue wave (I) of super cycle degree towards 80.82 all-time highs in June 2018. From there, a correction lower in blue wave (II) is unfolding as an Elliott wave zigzag pattern being 5-3-5 structure.
Firstly, red wave a of blue wave (II) has printed a low at 11.78 in March 2020. Then, a bounce has set a connector wave b at 36.33 highs in February 2021. Later on, the price has broken 11.78 lows opening up a bearish sequence. However, 100% extension of the wave c based on the length of the wave a is in the negative area. Obviously, it cannot be reached. Based on both the RSI readings and price action, $HUYA might have ended red wave c of blue wave (II) at 1.64 lows in October 2022. While above there, a new bullish cycle in blue wave (III) might have started and is now in the initial stages. The target for wave (III) will be 52.61-84.07 area and even higher.
Joyy Weekly Elliott Wave Analysis 1.3.2023
For comparison, the lower part of the weekly chart below shows the JOYY Inc. shares $YY traded at Nasdaq. From the lows, the stock price has developed an initial cycle higher in blue wave (I) of super cycle degree towards 142.97 highs in January 2018. From there, a correction lower in blue wave (II) is unfolding as an Elliott wave expanded flat structure being 3-3-5 structure.
Firstly, red wave a of blue wave (II) has printed a low at 41.33 in March 2020. Then, a bounce has set a connector wave b at 148.88 new all-time highs in February 2021. Later on, the price has broken 41.33 lows confirming the expanded flat structure. Similar to $HUYA, both the RSI readings and price action favor the low of wave (II) to be in place at 21.38 lows in October 2022. While above there, wave (III) can reach towards 165.06-235.91 area and even higher.
One can see how the expanded flat structure in $YY correlates with the zigzag structure in the $HUYA and how the end of the flat in JOYY Inc. can mean the end of the zigzag correction in the stock of Huya Live.
Get more insights about Stocks and ETFs by trying out our services 14 days . You’ll learn how to trade the market in the right side using the 3, 7 or 11 swings sequence. You will get access to our 78 instruments updated in 4 different time frames, Live Trading & Analysis Session done by our Expert Analysts every day, 24-hour chat room support and much more.
Back

