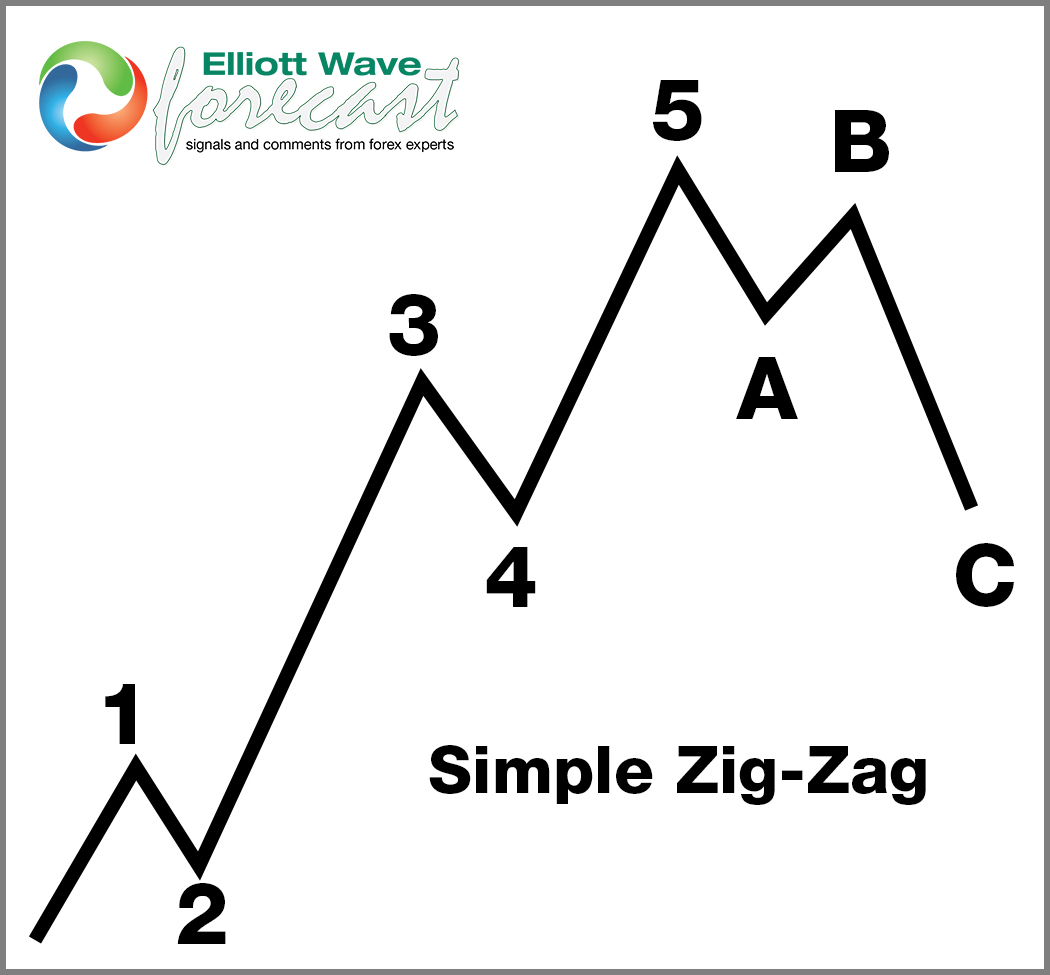
Hello Traders! In this technical blog we are going to take a look at the Elliott Wave path in Invesco Commodity Index Fund ($DBC) and explain why the ETF should see more downside in a ZigZag ABC correction towards a Blue Box area.
The fund pursues its investment objective by investing in a portfolio of exchange-traded futures on Light Sweet Crude Oil (WTI), Heating Oil, RBOB Gasoline, Natural Gas, Brent Crude, Gold, Silver, Aluminum, Zinc, Copper Grade A, Corn, Wheat, Soybeans, and Sugar. The index is composed of notional amounts of each of these commodities.
5 Wave Impulse Structure + ABC correction
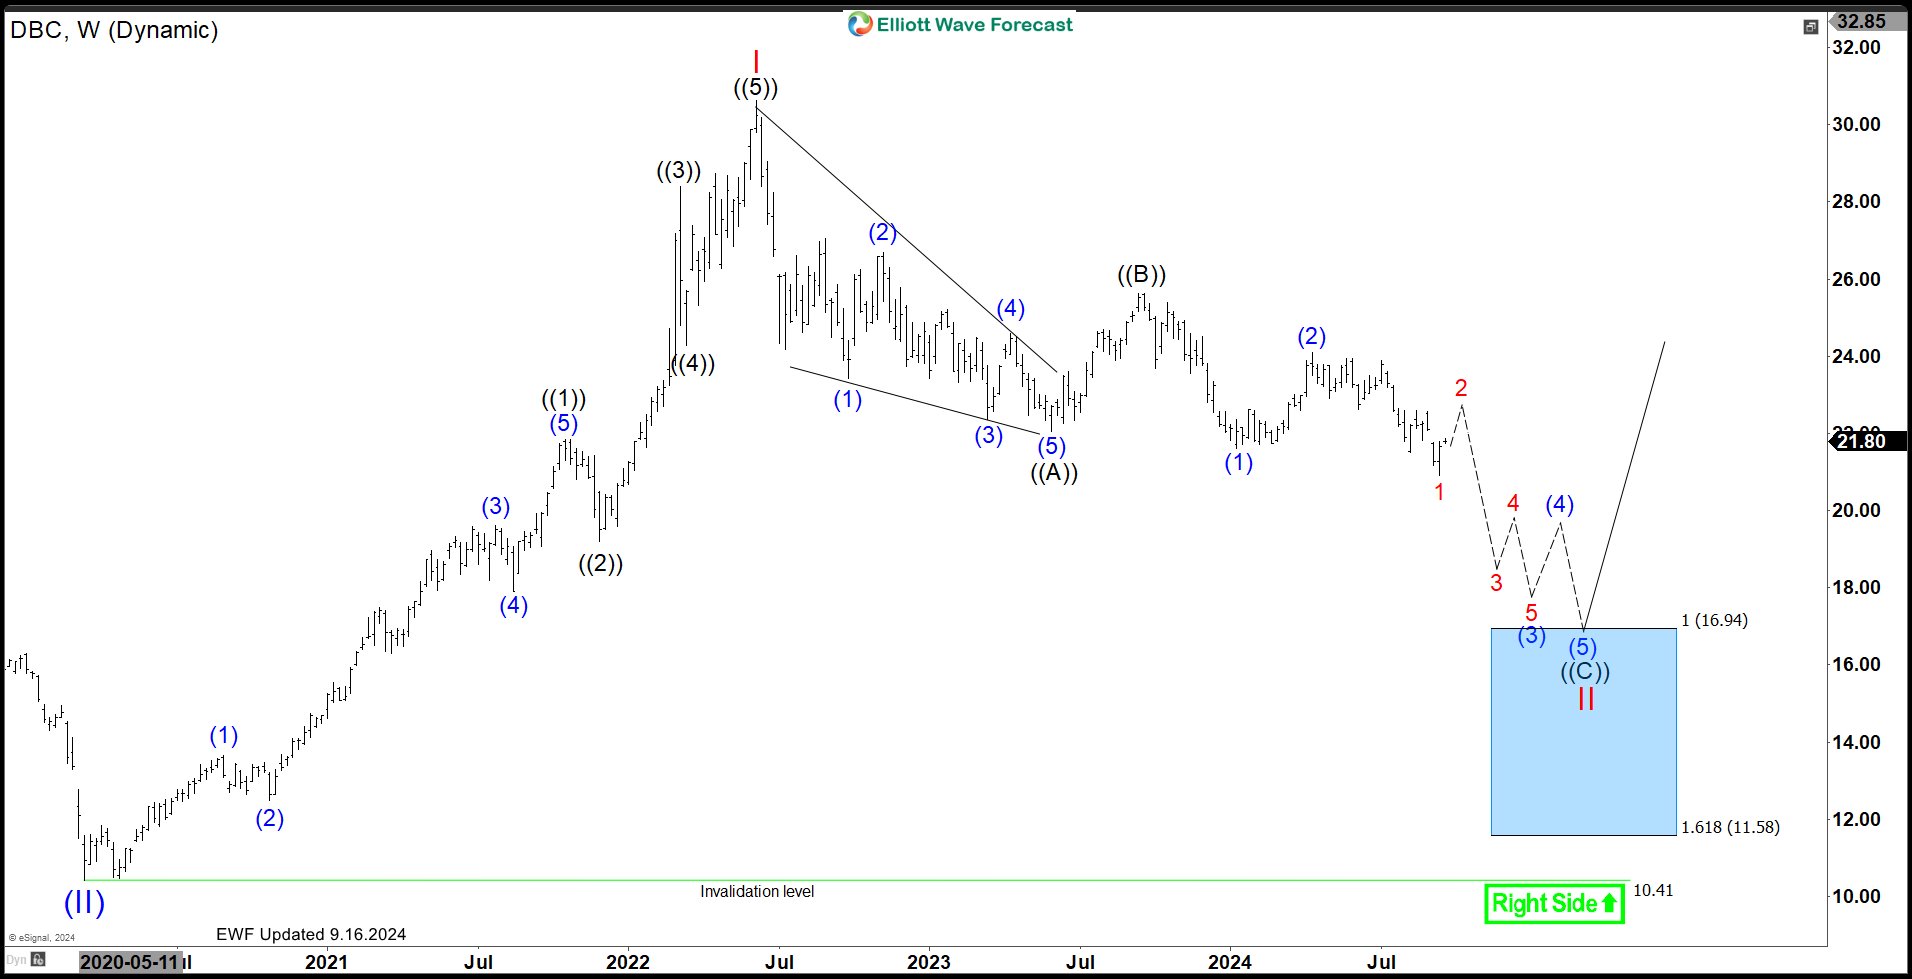
$DBC Weekly Elliott Wave View – Sep 16, 2024:
The weekly chart above clearly illustrates the cycle that started from the March 2020 low, unfolding as a 5-wave impulse. This structure suggests the beginning of a bullish trend. However, after the rally peaked in June 2022, the market began to correct in a Zig-Zag pattern.
Initially, the first leg down unfolded in a 5-wave structure. Subsequently, a bounce occurred in 3 swings, which corrected the downward movement. Despite this bounce, it failed at wave ((B)), and sellers managed to push the price below wave ((A)), creating a bearish sequence. As a result, sellers are currently in control and any bounces are likely to fail in either 3 or 7 swings.
On the other hand, buyers may wait for the blue box area for the next opportunity to enter the market. In conclusion, the ETF is expected to remain weak and reach $16.94 to $11.58, where a higher reaction might occur.
Elliott Wave Forecast
At Elliott Wave Forecast, we cover 78 instruments, providing comprehensive analysis and updates. Please note that not every chart is a trading recommendation. Official Trading Recommendations are available in our Live Trading Room. If you’re not a member yet, Sign Up for 14 days Trial to access new trading opportunities and enhance your trading strategy.
Welcome to Elliott Wave Forecast!
Back


