The last time I covered Indonesia Energy Corp was back in March 2022. The instrument had already done a 3 waves pullback from the peak, and was looking like a bottom was under way. Before I get into the charts, lets again take a look at what this company does:
“Indonesia Energy Corp is an independent energy company in the oil and gas business with operations primarily in Indonesia.
Our strategy is to build an oil and gas assets portfolio with an optimum mix between medium-sized producing blocks and exploration blocks with significant potential resources.
Indonesia Energy producing asset, Kruh Block, located in Pendopo, is a stable and positive cashflow generating oil asset. Our exploration play, Citarum Block, located in the most populated province in Indonesia, only 16 miles south of the capital city of Indonesia, Jakarta, is a de-risked asset with proven presence of hydrocarbons that offers an immense growth opportunity and downstream integration possibilities.
We are also conducting a joint study program to acquire an area that we believe to hold large amounts of crude oil due to its proven petroleum system and location on the Northwest Java basin, the Rangkas Area.”
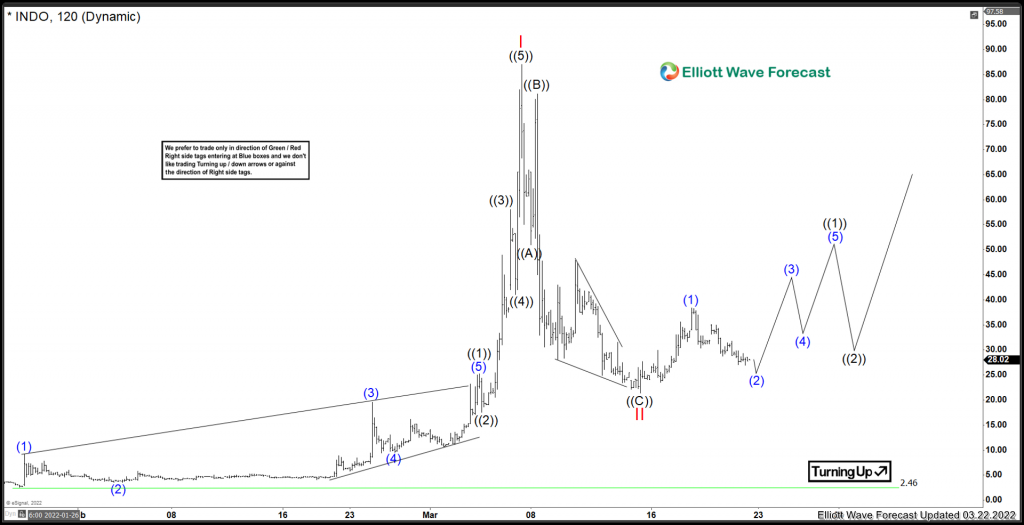
So lets take a look at the March 2022 view and see how it panned out.
Indonesia Energy Elliottwave View From March 2022:
As you can see above I was favouring the low was set. However the market had other plans and wanted to do a double correction. Instead, Indonesia Energy continued to extend lower in swings of 3 or 7. This is why it is important not to chase any reactions out of a low. If you chase, you risk getting caught in a drawdown situation. The only way to trade is the extreme areas where algos like to enter and exit.
So lets take a look at the current idea and see where things stand in this stock.
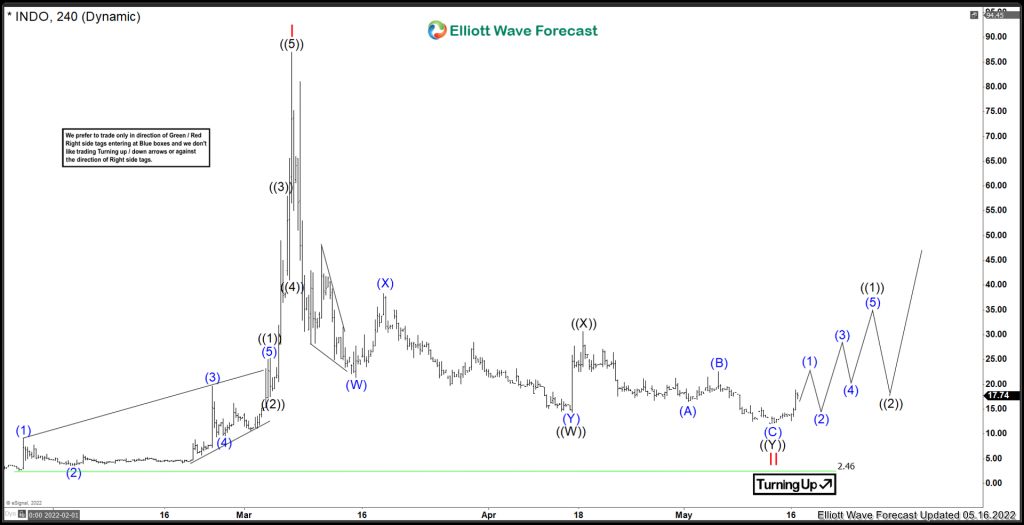
Indonesia Energy Elliottwave View May 2022
Medium term term view. As mentioned above, the correction in Red II took place as a double correction. The market was not ready to continue rallying higher back in March. After the (W) got taken in price, more choppy action continued to take place before bottoming in ((W)) and bouncing in ((X)). After that, another decline took place. This decline came in 3 waves (A) (B) (C) and the low comes without momentum divergence. This suggests that this has chance for a larger bounce in 3 swing at least. From the low set on May 12/2022, the stock appears to be rallying impulsively. It is imporant not to chase any price action. Any long trades are now trading against the lows of May 12, should that low get violated, there is greater potential for much more downside to take place.
In conclusion, the next leg higher is favoured to be underway. As long as Red II low holds. If that low gets invalided, then the stock can grind even lower before resuming higher.
Risk Management
Using proper risk management is absolutely essential when trading or investing in a volatile stocks. Elliott Wave counts can evolve quickly, be sure to have your stops in and define your risk when trading.
Improve your trading success and master Elliott Wave like a pro with our 14 day trial today. Get Elliott Wave Analysis for 78 instruments (26 in trial) including GOOGL, TSLA, AAPL, FB, MSFT, GDX and many many more.
Back


