Honeywell International Inc., (HON) operates as a diversified technology & manufacturing company operating globally. It is working in different segments like Aerospace segment, Building technology segment, Performance materials & technologies segment, Safety & productivity solutions segment etc. It is based in Charlotte, NC, comes under Industrials sector & trades as “HON” ticker at Nasdaq.
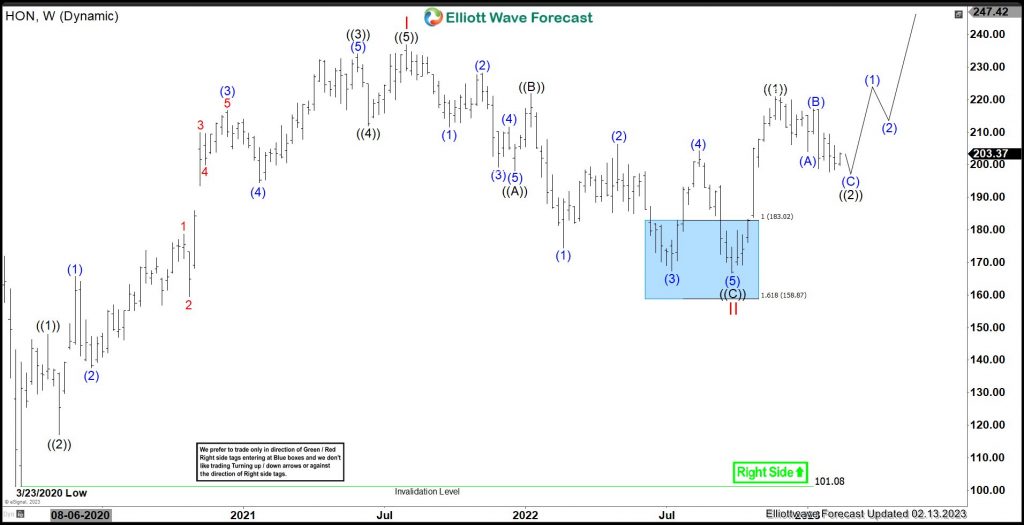
HON made low of $101.08 on 3/23/2020 during global sell-off. Above there, it confirms higher high sequence as impulse wave I ended at $236.86 high. It finished zigzag correction in wave II at $166.63 low in blue box area. Currently, it favors higher in III & needs to breaks above I high, to confirm the sequence.
HON – Elliott Wave Latest Weekly View:
It ended ((1)) at $147.87 high & ((2)) at $117.11 low. ((2)) was 0.618 Fibonacci retracement of first leg. Above there, it started third wave extension. It favored ended ((3)) at $234.02 high & ((4)) at $211.96 low. ((4)) was 0.236 Fibonacci retracement of third leg. Finally, it placed ((5)) at $236.86 high as wave I on 8/02/2021 high. Below there, it favored ended zigzag wave II on 9/30/2022 low. It placed ((A)) at $198.10 low & ((B)) at $221.89 high. Finally, it ended ((C)) leg as diagonal in blue box area at $166.63 low as wave II.
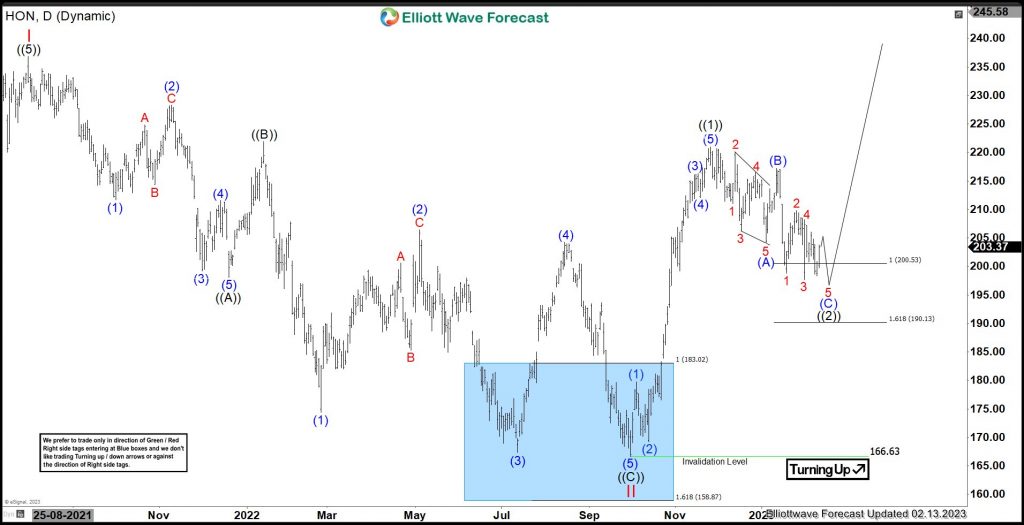
HON – Elliott Wave Latest Daily View: 
Above wave II low, it favored ended ((1)) at $220.96 high & correcting in (C) of ((2)) before upside resumes. It ended (1) at $179.77 high & (2) at $169.22 low. While above there, it favored ended (3) at $216.23 high & (4) at $212.02 low. It placed (5) at $220.96 high as ((1)). Below there, it favors correcting ((2)) before upside resumes. It placed (A) at $204.06 low & (B) at $217.22 high. Currently, it favors lower in 5 of (C) & expect downside below wave 3 low. It expects (C) to finish between $200.53 – $190.13 area before upside resumes in ((3)) or at least can see 3 swing bounce. Buyers from blue box area should remain long for further upside.
Elliottwave Forecast updates 1-hour charts four times a day & 4-hour charts once a day for all our 78 instruments. We do a daily live session where we guide our clients on the right side of the market. In addition, we have a chat room where our moderators will help you with any questions you have about what is happening in the market at the moment. You can try us for 14 days for only $9.99.
Back
