$FXE Elliott Wave & Long Term Cycles
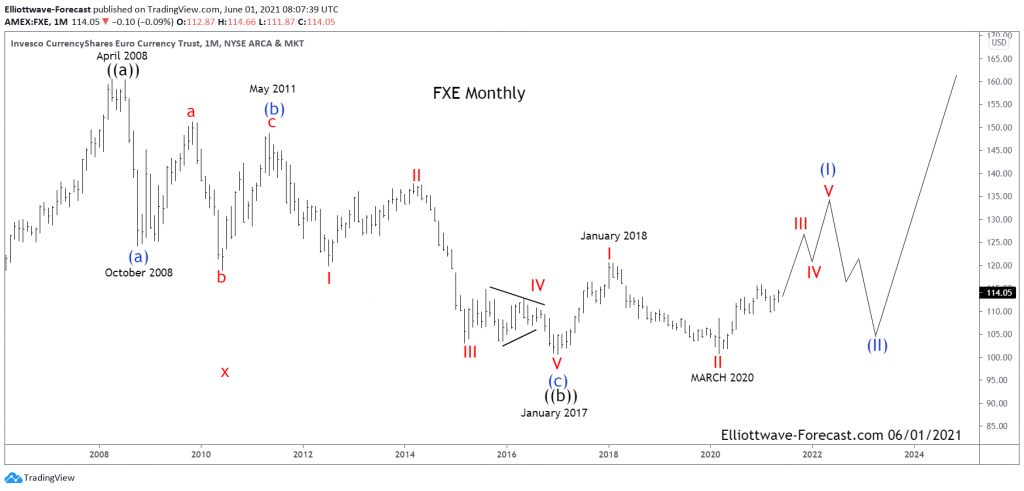
Firstly as seen on the monthly chart shown below the instrument made a high in April 2008. There is data back to December 2005 in the ETF fund. Data correlated in the EURUSD foreign exchange pair suggests the high in April 2008 was the end of a cycle up from the all time lows. EURUSD data shows the pair had a five wave up move from the early 1970’s era. This data is derived from the German Mark currency against the US Dollar that preceded the inception of the Euro currency.
As you can see the FXE instrument reflects the price swings of the single currency well. As previously mentioned the instrument made a high in April 2008. This where the analysis begins on the monthly chart shown below. The correction from those highs appears to be a an Elliott Wave zig zag structure correction. The analysis continues below the monthly chart.
Secondly as mentioned the decline from the April 2008 highs appears to be an Elliott Wave zig zag structure. This structure is also called a 5-3-5 in Elliott Wave terms. When a cycle ends against a trend it will show up in momentum indicators usually before price makes it obvious. Further these cycle lows and highs are in the blue color as shown on the chart above (a)-(b)-(c). This finished ((b)) in January 2017.
Lastly and in conclusion. The instrument ended a cycle lower from the January 2018 highs in March of 2020. It can further bounce higher toward the 130.00 to 135.00 area while above the March 31st, 2021 lows. It should reach that area before it corrects the cycle up from the January 2017 lows.
Thanks for looking. Feel free to come visit our website. Please check out our services Free for 14 days to see if we can be of help. Kind regards & good luck trading. Lewis Jones of the ElliottWave-Forecast.com Team
Back

