In this blog, we will have a look at a European index called FTSE MIB. It is the stock market index for the Borsa Italiana. Which is traded in Italy. It has a market capitalization of around 4 Trillion €. The index consists of the 40 most-traded stocks in Italy.
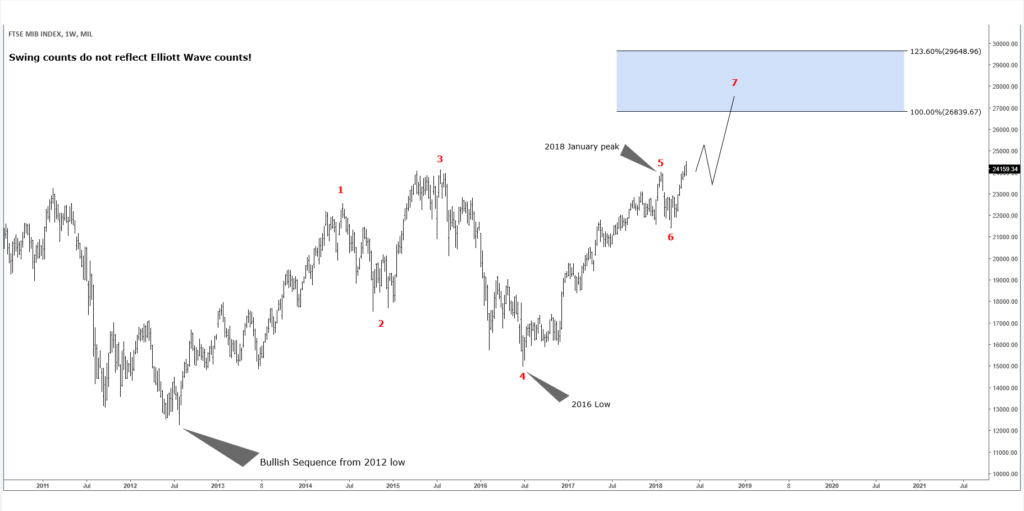
This index has a very interesting swing structure. Having a look at the chart below, you can see that the FTSE MIB has a 5 swing bullish sequence from 2012 low, targeting the areas of 26840 areas (Blue Box). This coincided with our bullishness in the European indices and globally after all. The main point I want to make out in this blog is the fact, that the Index broke already it’s 2018 peak. Opening now further bullish extension higher. It is the only Index which broke the January 2018 peak if you compare it to the DAX or FTSE100.
FTSE MIB Weekly Chart
With FTSE MIB breaking already the 2018 peak, it ended the correction from the 2016 move higher, which means that the 6 swing correction (March lows) is over and we should see more upside in the 7th swing. Keep in mind that the chart above is a weekly chart. Corrections in lower timeframes will obviously occur. Markets never move in one straight line, so we need to be aware of corrections.
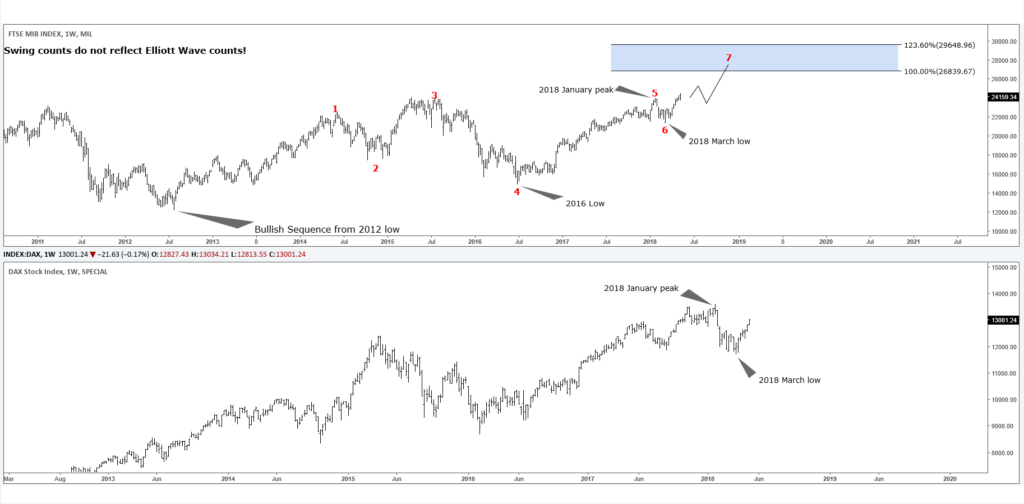
FTSE MIB vs DAX
In the chart above you can see the FTSE MIB vs DAX. We can make out that the DAX is still missing the break above the 2018 January peak. But with the FTSE MIB breaking already its respective Jan. peak, we can assume that the correction against 2016 low in the DAX may also be completed. But for a confirmation of this view, the DAX itself needs to break the January peak.
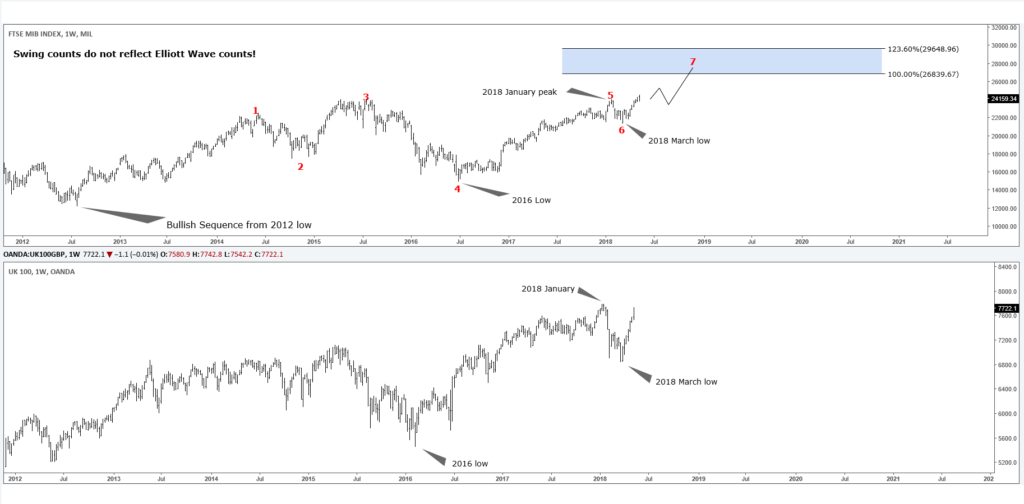
FTSE MIB vs FTSE 100
In the chart above you can see the FTSE MIB vs FTSE100. You can see that the FTSE is also missing the break above the 2018 January peak. However, the difference between the DAX and the FTSE is that the U.K. Index is close to breaking the highs and with the FTSE MIB breaking already its respective Jan. peak, we can assume that the correction against 2016 low in the FTSE may also be completed. But like always for a confirmation of this view, better to wait for a break above January peak.
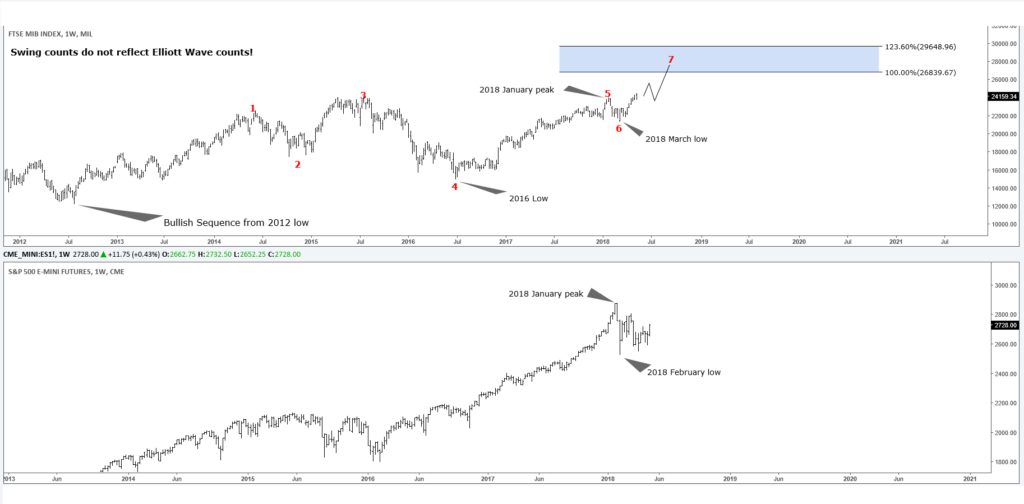
FTSE MIB vs S&P 500 E-Mini Futures
The last chart represents the FTSE MIB vs ES Futures. The American indices are clearly lagging in the move higher. If you compare the ES to the DAX or FTSE 100 you can make out the move higher is stronger in the European once, so when the European Indices starts their respective correction against the March 2018 lows. The American Indices should get sideways to lower. However, the right side remains to the upside in global indices. But like always, better to wait for a break above the January peak in ES too.
I hope you enjoyed this blog and I wish you all good trades and if you interested in learning more about our unique way of forecasting. You can join for FREE to a 14 days Trial below.
We believe in cycles, distribution, and many other tools in addition to the classic or new Elliott Wave Principle.
