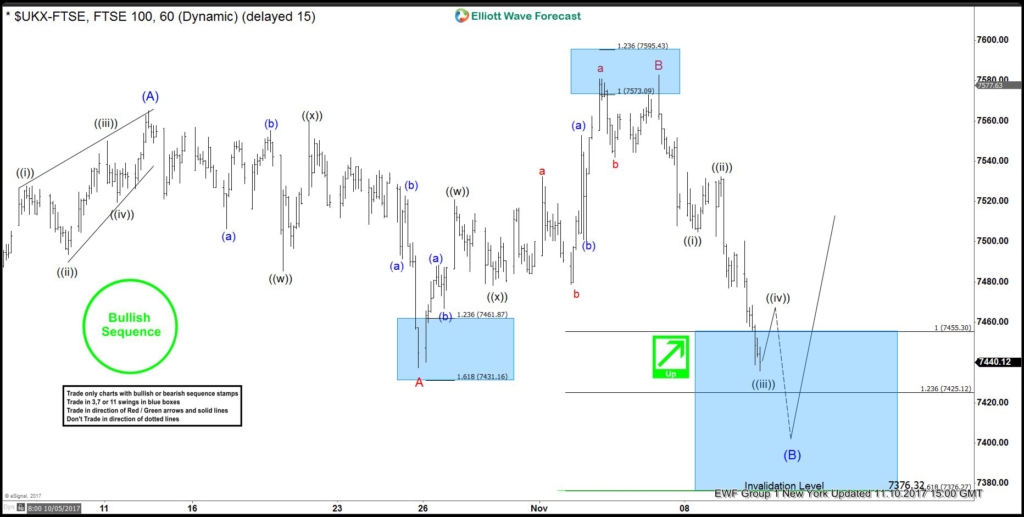
FTSE Elliott Wave view suggests that the decline to 7199.5 ended Primary wave ((4)). Up from there, the rally is unfolding as a zigzag Elliott Wave structure where Intermediate wave (A) ended at 7565.11 on 10/12 peak. A rally to intermediate wave (A) is subdivided as an impulse Elliott Wave structure. Minor wave 1 ended at 7327.5, Minor wave 2 ended at 7289.75, Minor wave 3 ended at 7527.72, Minor wave 4 ended at 7493.68, and Minor wave 5 of (A) ended at 7565.11.
The recent decline has broken the pivot from 10/25 low (7436.69) suggesting that we are correcting the 9/15 low (7197.66) as a flat structure in intermediate wave (B) dip still. Where Minor wave A ended as double three at 7436.92, Minor wave B ended at 7582.85, and Index is currently in Minor wave C as 5 waves to correct cycle from 9/15 low (7197.66). Minute wave ((i)) ended at 7494.80 low, Minute wave ((ii)) ended at 7537.50 and below from there Minute wave ((iii)) remain in progress towards 7425.12 1.236% ext area, afterwards index should do a bounce in Minute wave ((iv)) followed by another push lower 7376.12 1.618% ext area of A-B before the Index resumes the rally higher. We don’t like selling the index and favor buying the dips against 9/15 low (7197.66) in a sequence of 3, 7 or 11 swings.
FTSE 1 Hour Elliott Wave Analysis
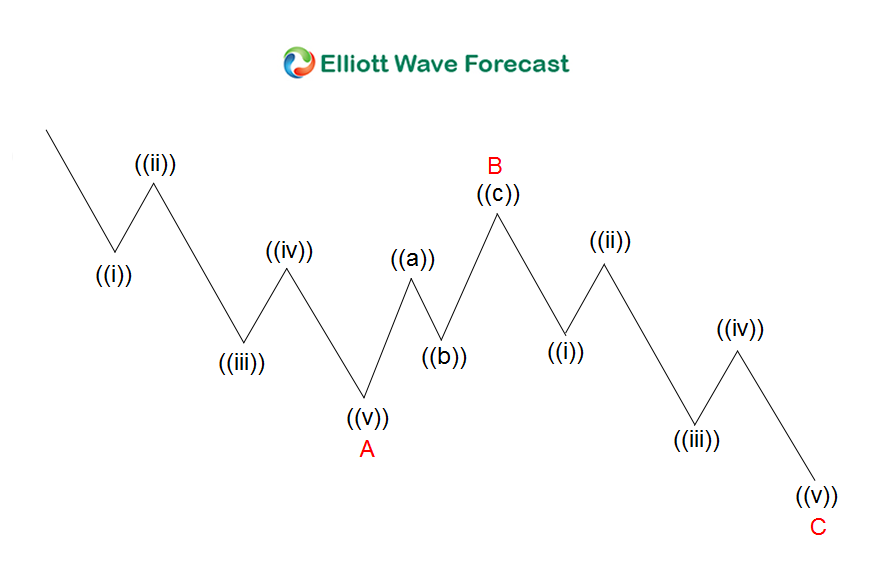
Zigzag is a 3 waves corrective pattern which is labeled as ABC. The subdivision of wave A is in 5 waves, either as impulse or diagonal. The subdivision of wave B can be any corrective structure. Finally, the subdivision of wave C is also in 5 waves, either as impulse or diagonal. Thus, zigzag has a 5-3-5 structure. Wave C typically ends at 100% – 123.6% of wave A.
Back


