In this Technical blog, we are going to take a quick look at the past Elliott Wave Chart performance of ES_F (S&P 500). Which we presented to our clients at elliottwave-forecast.com. We are going to explain the structure and the forecast. As our members know, we were pointing out that ES_F (S&P 500) is trading within the larger bullish trend in the Weekly cycle from the 2016 low. We advised our members to avoid selling it, keep favoring the long side as the mentioned cycle from the January 2016 low is still incomplete to the upside.
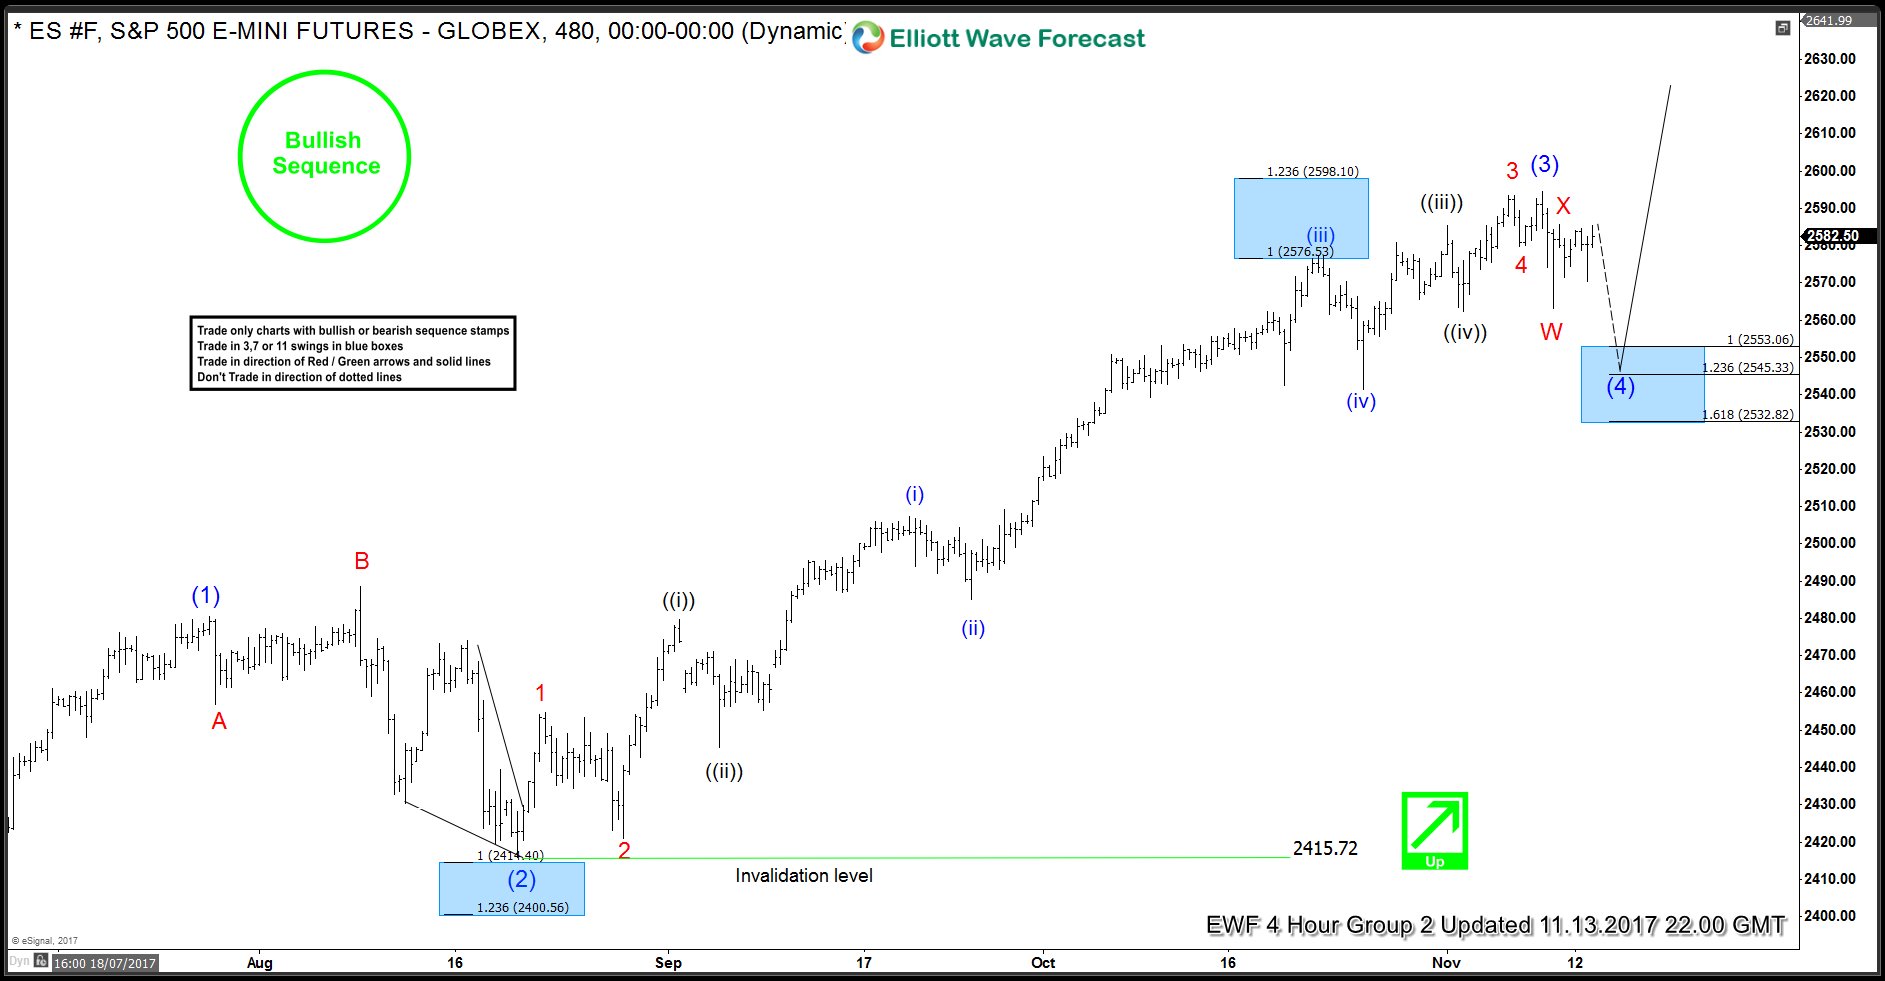
ES_F (S&P 500) 11.13.2017 4 Hour Elliott Wave Chart
Above is the 4hr Chart from 11.12.2017 Weekend update the index was showing the incomplete impulsive sequence to the upside within the cycle from March lows. And the index was expected to see more upside within that cycle as far as dips remain above 8/21 low 2415.72. It is also important to note that, in the above Chart, we can see that there is a green arrow to indicate that the trend is up, the bullish Sequence mark to maintain the sequence is also bullish. So, we advised our member’s to buy the dips in the index on any blue box in 3, 7 or 11 swings provided the pivot at 2415.72 low remains intact. In the Above Chart, we can see that the index is showing blue box area for the long side at 2553.06-2532.82 100%-1.618% Fibonacci extension area of W-X.
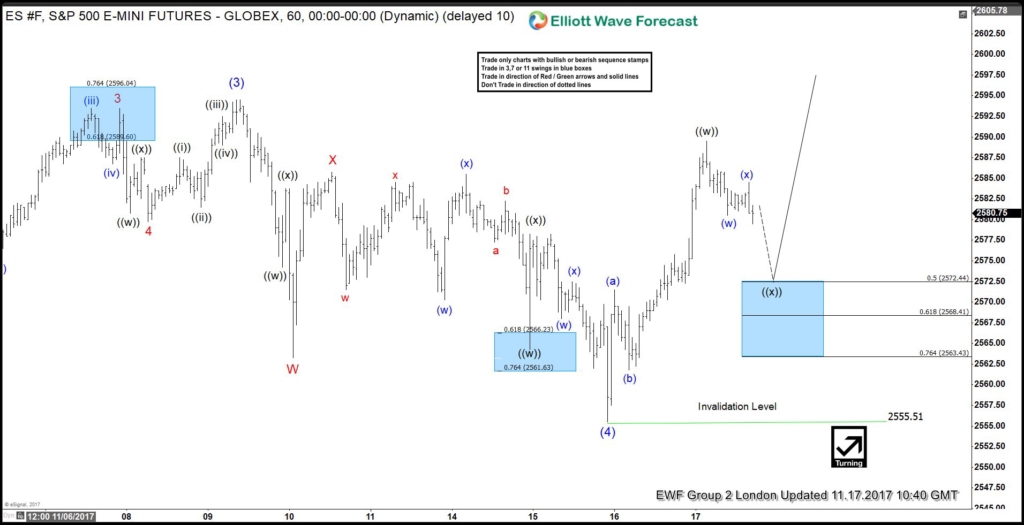
ES_F (S&P 500) 11.17.2017 1 Hour Elliott Wave Chart
The index fails to reach it’s blue box area 2553.06-2532.82 100%-1.618% Fibonacci extension area of W-X and rallied strongly with Intermediate wave (4) dip ended at 2555.51 low. Above from there, the index ended the first leg higher in Minute wave ((w)) at 2589.73 and did another 3 waves back in Minute wave ((x)) dip. And offered us another buying opportunity from blue box area i.e 50-764% Fibonacci retracement area at 2572.44-2563.43.
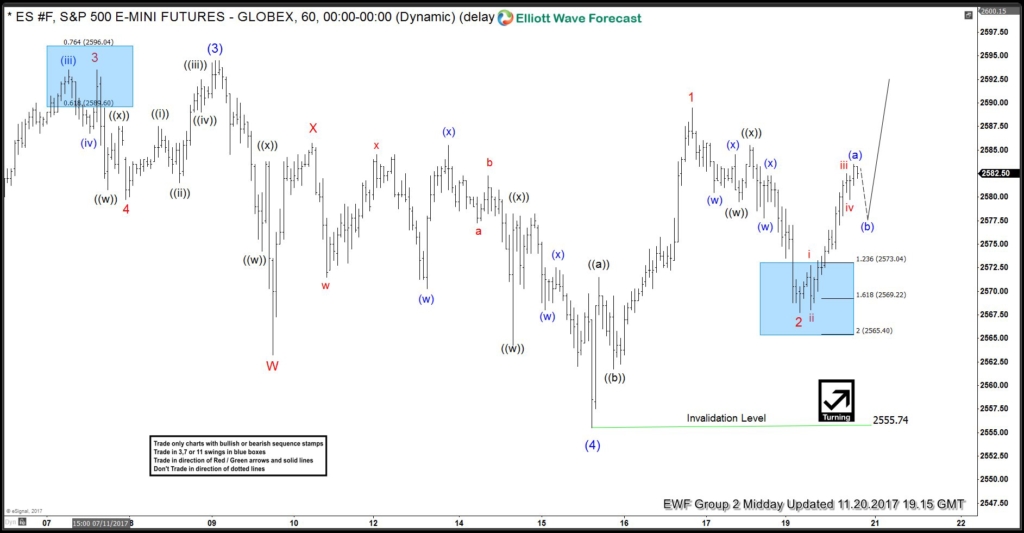
ES_F (S&P 500) 11.20.2017 1 Hour Elliott Wave Chart
The index ended the dip to 2555.74 low in Minor wave 2 pullbacks at 2568.40 low as expected. After reaching the 50-764% Fibonacci retracement area at 2572.44-2563.43 ( blue box area) and gave us the reaction higher to allow our members to create a risk-free position. Since then, the index has broken to new highs suggesting that the next extension higher in Intermediate wave (5) has started and now any dip in the index should provide buying opportunity against 2555.74 low in a sequence of 3, 7 or 11 swings. Please Note that we adjusted the degree of labeling from Minute to Minor.
Keep in mind that the market is dynamic and the view could change in the meantime. Success in trading requires proper risk and money management as well as the understanding of Elliott Wave theory, cycle analysis, and correlation. We have developed a very good trading strategy that defines the entry. Stop loss and take profit levels with high accuracy and allows you to take a risk-free position, shortly after taking it by protecting your wallet. If you want to learn all about it and become a professional trader, register now for your 14 day Trial.
Back


