Weekly Elliott Wave Counts Suggest The Correction Is Nearing Completion
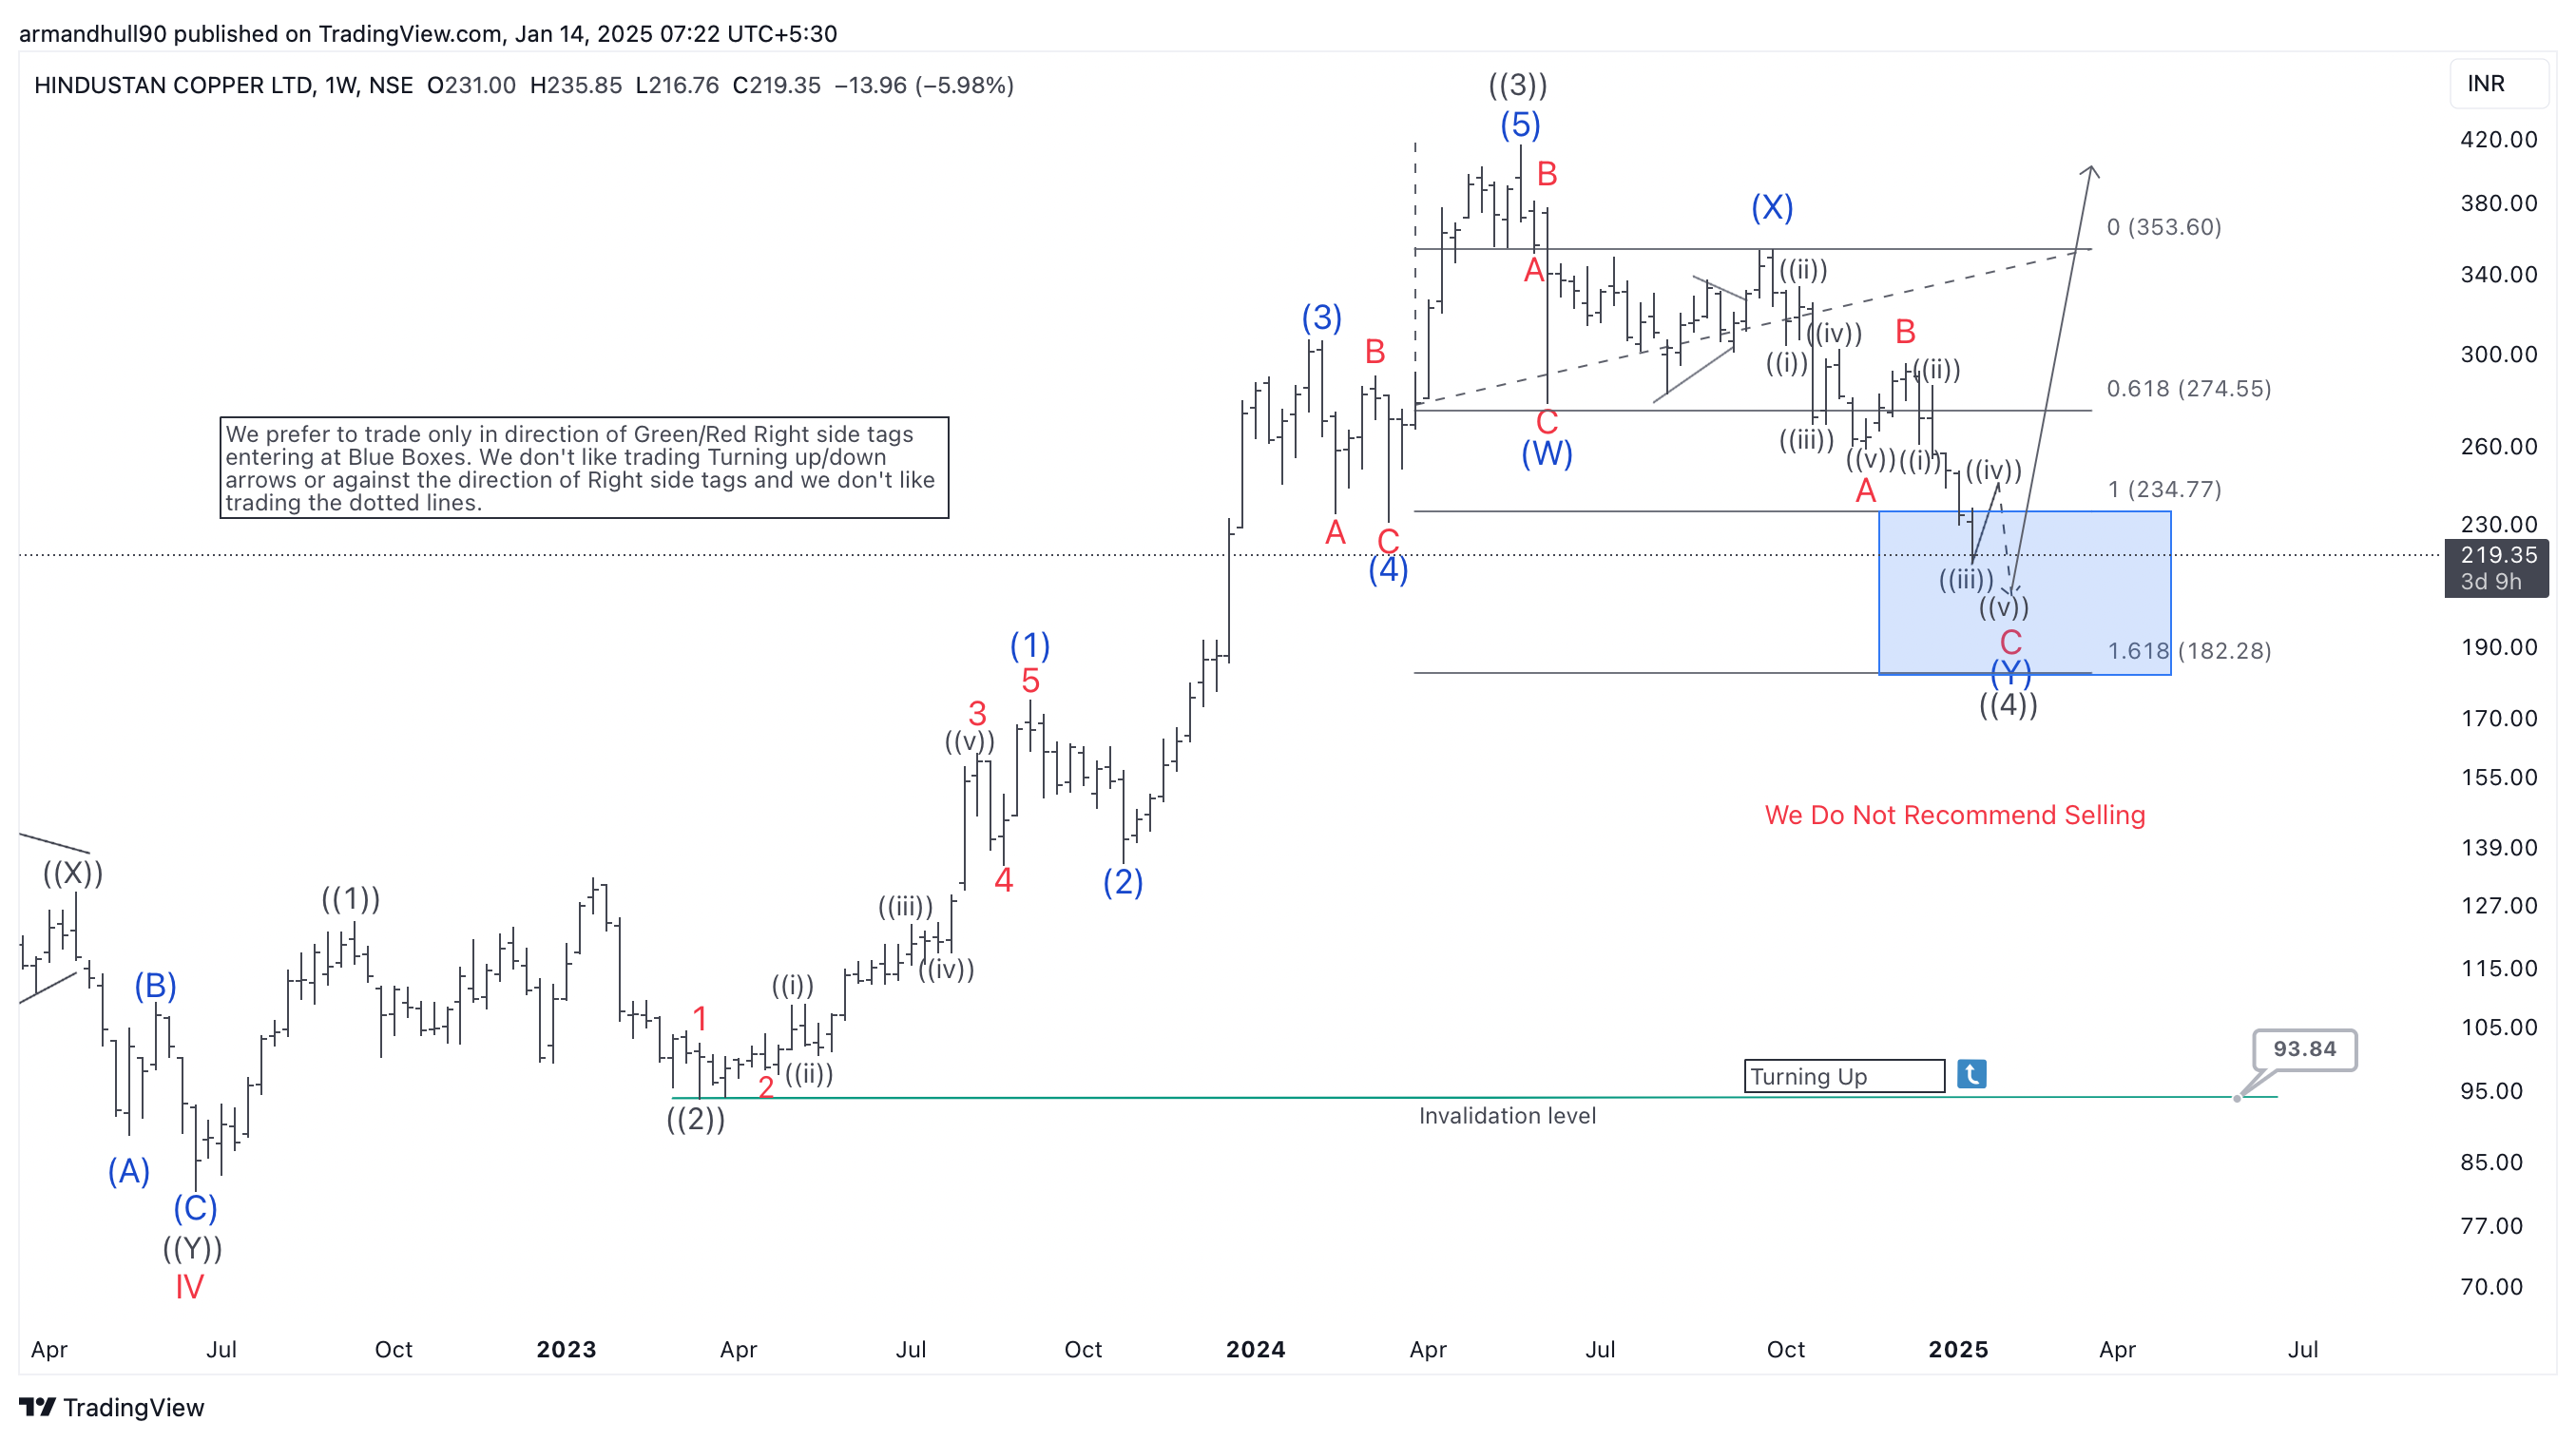
The Elliott Wave analysis for Hindustan Copper Ltd. (NSE) indicates a correction on the weekly chart. The broader structure follows a five-wave sequence, with waves ((1)) and ((3)) already completing their upward moves. Currently, wave ((4)) is unfolding as a double zigzag pattern (W-X-Y). Wave (Y) aims for the area of 1 and 1.618 Fibonacci extension of wave (W), between 234 and 182 INR.
Importantly, the analysis identifies a blue box zone, which signals a high-probability reversal area. Wave ((4)) is likely to end here, after which wave ((5)) should resume the bullish trend. This wave is expected to break above the high of wave ((3)) at 354.65 INR. However, the invalidation level lies below the blue box. If the price falls below this level, the analysis would need revision.
 Daily Chart: Short Term Outlook
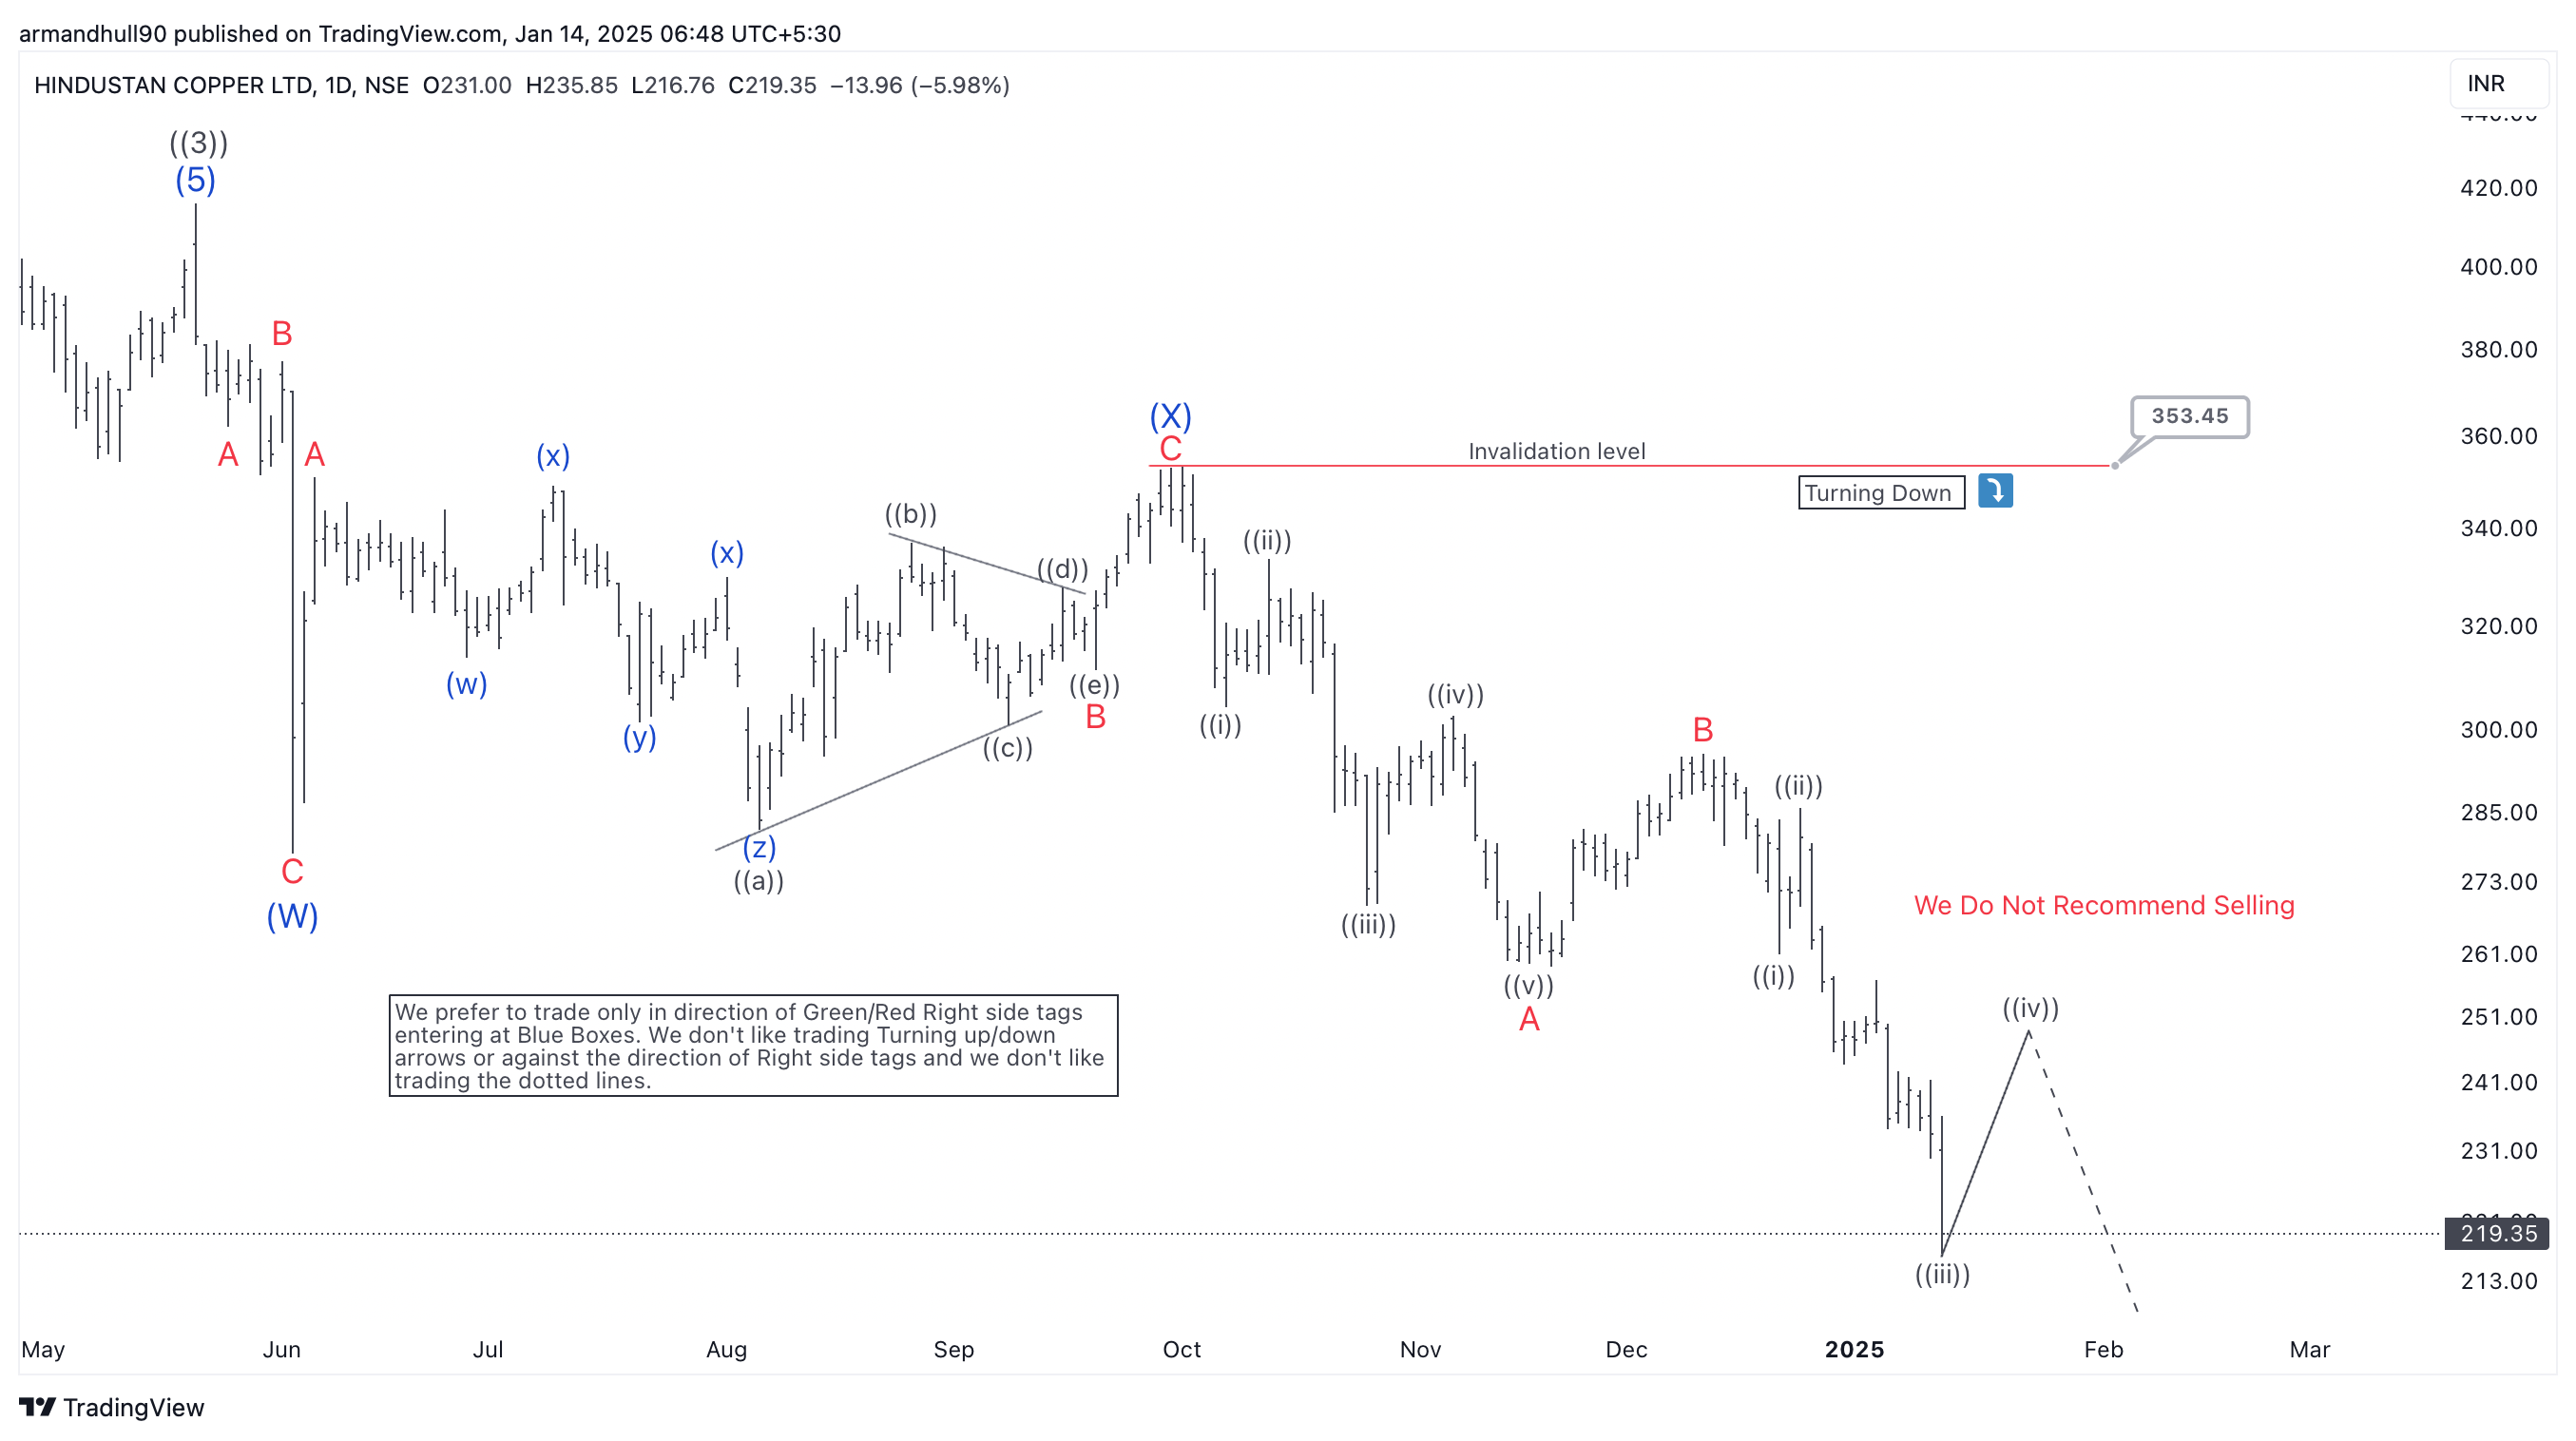
On the daily chart, wave ((4)) is visible as a detailed double zigzag (W-X-Y). The final wave (Y) is progressing as a downward five-wave move. So far, the price has reached the blue box, which aligns with Fibonacci levels between 1.0 and 1.618.
A minor rebound in wave (iv) is likely, with resistance near 250–260 INR. Afterward, wave (iii) may extend further downward, targeting an area of 234-182 INR. Traders should look for confirmation of a trend reversal in the blue box before taking long positions. This zone is crucial because it could mark the end of the correction and the start of wave ((5)).
bit.ly/3ZTb33n > Login or Get 14 day Trial at $9.99 (first time members only) to access updated charts for various #Forex #Indices and #Commodities and be prepared for the next move in the markets. Click here: bit.ly/4g7HjFc #Elliottwave #Trading
Back


