Wipro Limited (WIT) operates as Information technology, Consulting & Business process services company globally. It operates through three main segments, IT Services, IT Products & India State Run Enterprise Services. The company is based in Bengaluru, India (ADR stock) & trades under $WIT ticker at NYSE. It comes under Technology sector as Information Technology services Industry.
WIT consolidates since October-2010 high to March-2020 low between $5.69 – $2.52 range. But after global sell off ends in early last year during Covid Pandemic, it started the impulse sequence higher & rise almost 4X from the bottom. It proposed ended the sequence at $9.96 high on 10/19/2021 against March-2020 low & as shown in previous blog, that it favors flat correction lower towards $8.23 – $7.23 area.
WIT – Elliott Wave Latest Daily View:
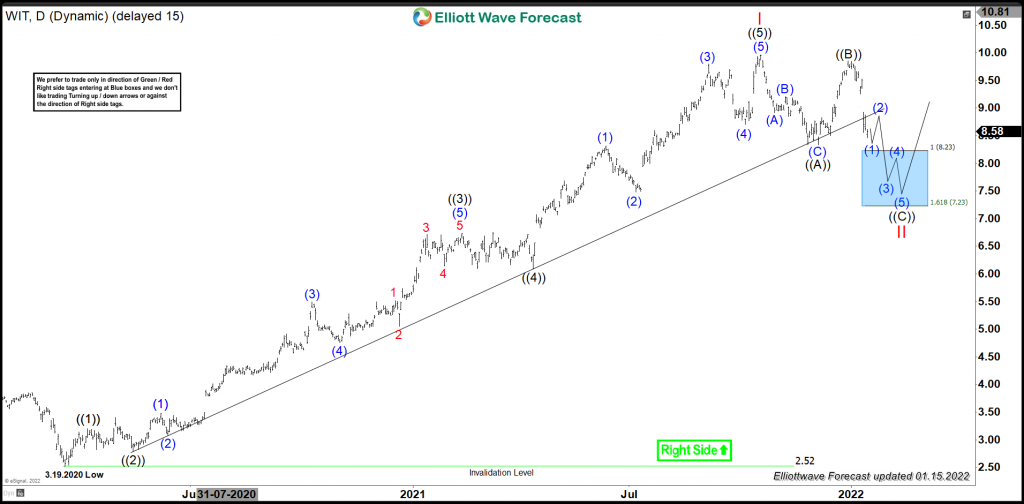
It favored ended ((1)) at $3.20 high on 4/07/2020. It placed ((2)) at $2.79 low on 5/14/2020 as expanded flat retraced 0.618 of previous cycle. The wave ((3)) favored ended at $6.74 high on 2/12/2021 as third wave extension. Wave ((4)) was a shallow correction favored ended at $6.09 low on 4/14/2021. While above there, it placed ((5)) at $ 9.96 high on 10/19/2021 to end the cycle as I red started from March-2020 low.
In short term, below $9.96 high of I red, it favored ended ((A)) at $8.34 low & ((B)) at $9.86 high dated 12/30/2021. Currently, it favors lower in (1) blue & expect one or more lows before start bouncing in (2). The bounce in (2) should ideally fail below $9.86 high & expect two more lows to end ((C)) in impulse between $8.23 – $7.23 area before it resume upside. We like to buy the pullback in equal leg area, when it ends II flat correction for further upside or at least for 3 swings bounce.
WIT – Elliott Wave Alternate View:
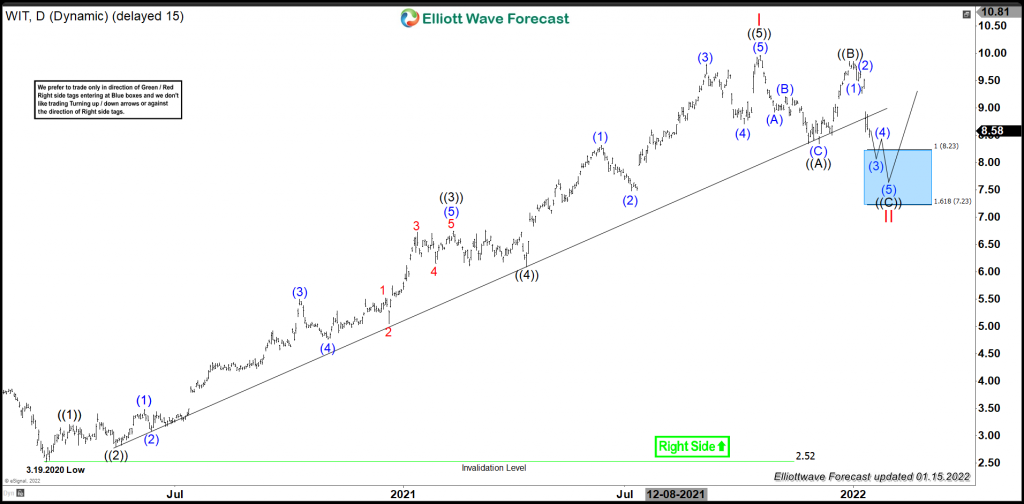
Alternatively in short term, it might be in (3) of ((C)) & favors one more low to end (3). Thereafter it expect a bounce in (4) followed by next leg lower in (5) of ((C)) to end II correction in equal leg area before resume upside.
Elliottwave Forecast updates 1-hour charts four times a day & 4-hour charts once a day for all our 78 instruments. We do a daily live session where we guide our clients on the right side of the market. In addition, we have a chat room where our moderators will help you with any questions you have about what is happening in the market at the moment. You can try us for 14 days for only $9.99.
Back
