Global Indices have seen an impressive start of Q3 as the major US indices are not tired of hitting new highs occasionally. With applause July dissemination among equity investors, capital bulls are flexing their muscles in August as well. At the beginning of last week, the indices hits fresh highs as US retail sales and wholesale prices did not go too optimistic and then the chances of a rate hike from the Fed in the short term were reduced. This also ensures the continuity of economic flows in dollars, maintaining the party stock up. Also note that the improvement in bank earnings, technology giants and even from the retail sector and hints of recovery in oil prices also played a role in pushing stocks higher. This rise came despite a flurry of concerns loitering around, especially the impact has not yet been seen Brexit, global macroeconomic depression, especially in Europe and Japan, uncertainty continues on the board of oil and key emerging market from China. Overvaluation concerns raised by many analysts, besides the Fed itself also has the potential to derail this rally. If these were not enough, New York, William Dudley, president of the Fed hinted at the possibility of a rate hike in September.
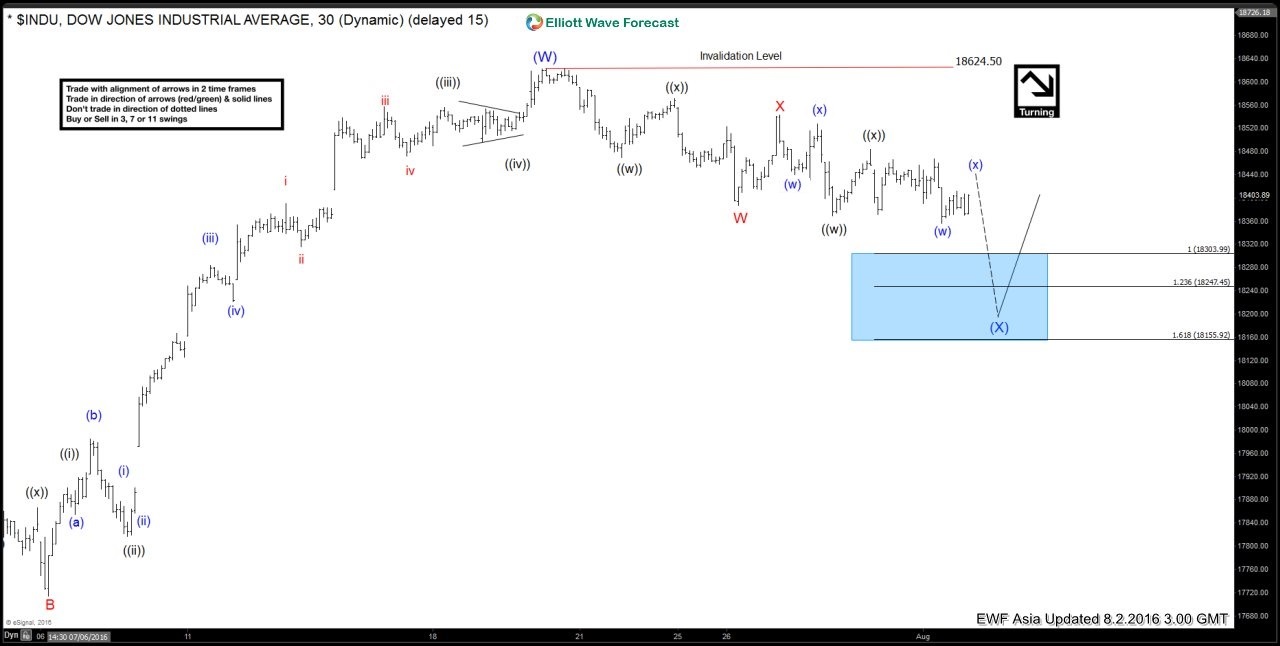
However we at Elliott Wave Forecast do not account much attention on Fundamental (illusion) & our bias on Global indices remains bullish & we believe every pullback no matter what time frames will offer a good buying opportunity in future. Keeping the bias in mind Dow ($INDU) index showed some weakness in the mid of July after making fresh highs & thus offered another opportunity in the near term. As the Chart below of August 02.2016 shows an incomplete WXY Elliott Wave structure in the making from the peak. Wave W can be sub-divided in 3 swings i.e. ((w)),((x)) and ((y)) after which we saw a bounce in wave X and we are now looking for a drop in wave Y towards 100 – 123.6% Fibonacci extension area of W-X to complete 7 swings. Please note wave Y should also have a corrective sequence, so far we have seen 5 swings within wave Y and another swing lower will make it 7 swings within wave Y or 3 larger swings in Y which will make it 7 larger swings from the peak in total. After completion of 7 swings, we expected the Index to rally to new highs or bounce in 3 waves at least.
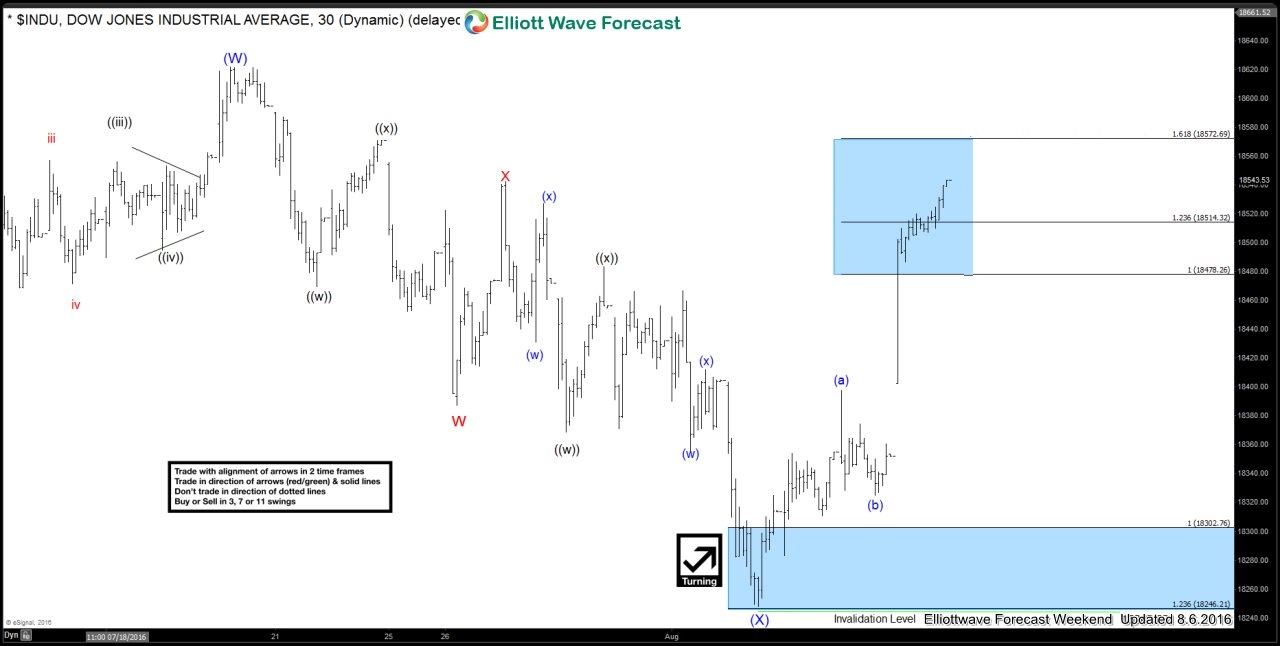
1 hour August 6th 2016 weekend updated chart below chart showing index bounced from mentioned area as expected and traders who bought the dip after 7 swings in the highlighted area got a chance to get into a risk free position.
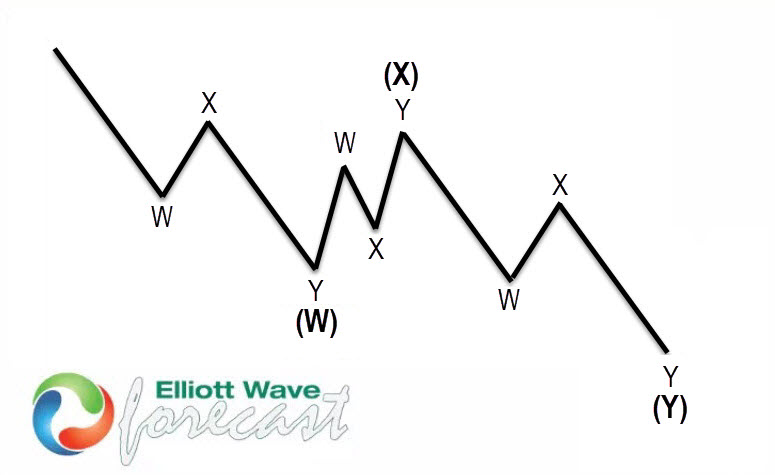
7 swings structure is one of the most common patterns in the theory of New Elliott Wave & it is also mainly know as double three Elliott Wave pattern. Market find that very often nowadays in many instruments in almost all time frames. It is a very reliable structure by which we can make a good analysis and what is more important is giving us good business inputs with clearly defined levels invalidation and destination areas.
The image above shows what Elliott wave pattern Double Three looks like. Has (W), (X), labeling (Y) and 3,3,3 internal structure, which means that all these 3 legs are corrective sequences. Each (W), (X) and (Y) are made of three waves, which are having the structure W, X, Y in lesser degree as well. Elliott Wave principle is a form of technical analysis that traders use to analyze the cycles of financial markets and market trends forecast by identifying extremes in investor psychology, high and low prices, and other collective factors. Important to Note that 3 waves could also be labeled ABC (5-3-5) structure as well. How are labeled 3 waves it depends on the internal price structure subdivisions waves i.e. whether the price action is corrective or motive.
Proper Elliott Wave counting is crucial in order to be a successful trader. If you want to learn more on how to implement Elliott Wave Theory in your trading and to learn more about next trading opportunities in the Market, Try free 14 day trial. You will get access to Professional Elliott Wave analysis in 4 different time frames, Daily Elliott Wave Setup Videos ,Live Trading Room and 2 live Analysis Session done by our Expert Analysts every day, 24 hour chat room support, market overview, weekly technical videos and much more. If you are not member yet, use this opportunity and Sign up now to get your (free trial).
Back


