MasterCard shares (NYSE: MA) failed to break above the all-time highs made last month even with the “Trump Rally” which started 3 weeks ago pushing the stock market strongly to the upside , this doesn’t seems to had any impact on MasterCard so with investors looking to cash-out before Christmas and some stocks reaching extremes like American Express that could put pressure on the stock market which can see a healthy pullback .
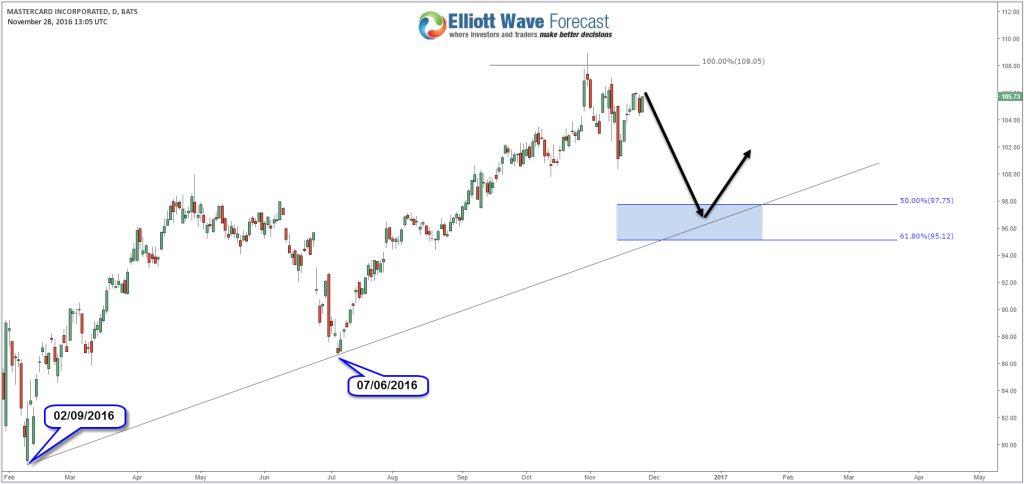
The technical picture of MA is showing that the stock is doing 3 swings sequence from February lows which already reached its equal legs area at 108.05 and since then MA has been struggling to add new highs , it managed to pullback in 3 waves already which is generally enough to resume the trend but in this case MA still has the possibility to do a double three to correct the cycle from July low toward 50% – 61.8% Fibonacci area ( 97.75 – 95.12 ) which will provide buyers with another opportunity to go Long there meaning either new highs or just a 3 waves bounce .
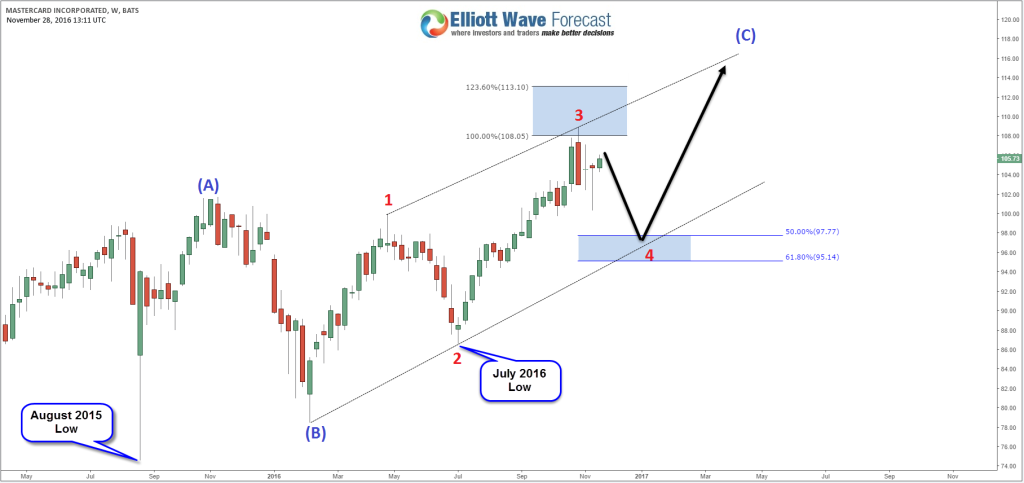
If MasterCard manage to hold July 2016 pivot in the pullback then the stock could be doing an ending Diagonal in wave (C) of a Flat from August 2015 low which means the last leg higher could reach 113 – 115 area or even extend further toward 120 before a larger pullback is seen .
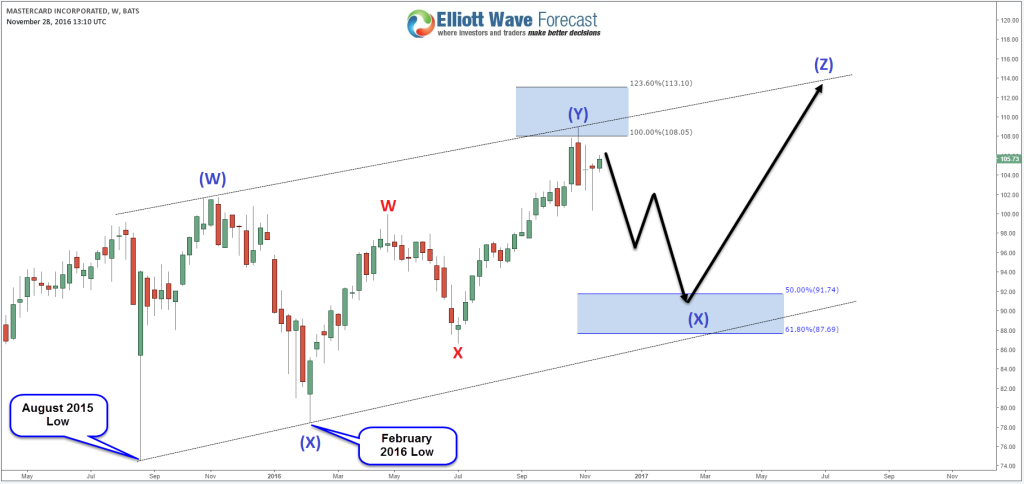
If July 2016 pivot fails then the stock could extend lower to correct cycle from February 2016 low or August 2015 low meaning a deeper pullback to around 91.75 could be seen as a second wave (X) connector in a triple three structure from August 2015 low , in that case it will take a longer time before it can see new highs .
In both cases , MasterCard reached an extreme area ending 3 swings from 2015 & 2016 lows so even breaking the previous peak from current levels it’s not a good idea to chase Longs as cycles are mature and it’s better to wait for a clear structure pullback in 3 , 7 or 11 swings before buying the stock for another rally . Using Elliott Wave Theory can always provide you with different scenarios but combined with the right tool it can give you an edge to find the best trading opportunity .
For further information on how to find levels to trade forex, indices, and stocks using Elliott Wave and the 3 , 7 or 11 swings technique, try us FREE for 14 days. You will get access to Professional Elliott Wave analysis in 4 different time frames, Daily Elliott Wave Setup Videos , Live Trading Room and 2 live Analysis Session done by our Expert Analysts every day, 24 hour chat room support, market overview, weekly technical videos and much more so if you are not a member yet, use this opportunity and sign up to get your FREE trial . If you enjoyed this article, feel free to read other diversified articles at our Technical Blogs and also check Chart of The Day .
Back


