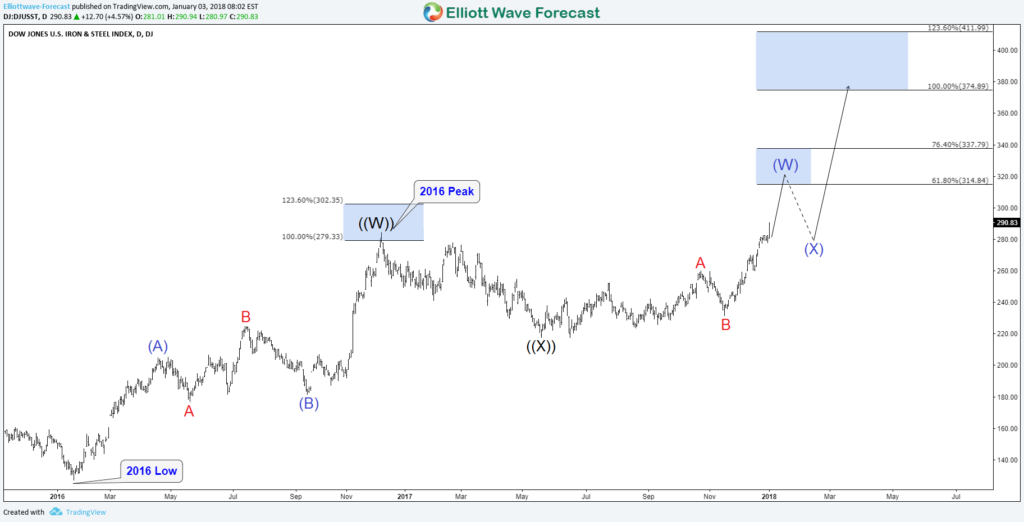
Last month, Dow Jones Iron & Steel Index DJUSST managed to break above December 2016 peak and created an incomplete bullish sequence from 2016 low calling for a move higher toward equal legs area $374 -$411. In the daily chart, we can see that the move higher was expected to pullback from the 61.8% – $76.4 fib ext area before resuming the trend to the upside.
DJUSST Daily Chart 01/03/2018
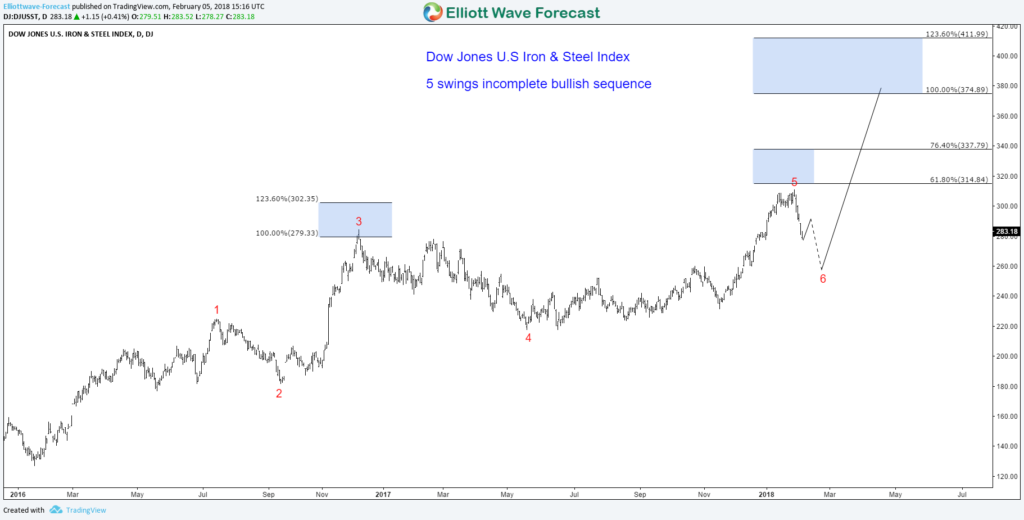
In the next chart, we can notice that DJUSST already ended the 5 swings higher slightly below the 61.8 % area and started the 6th swing pullback which we expect to find buyers in 3, 7 or 11 swings against June 2017 low then it will resume higher or bounce in 3 waves at least.
DJUSST Daily Chart 02/05/2018
Recap
Dow Jones Iron & Steel Index DJUSST is showing an incomplete 5 swings bullish sequence from 2016 low and expected to hold above June 2016 low. Any related stock to Iron & Steel will remain supported in 2018 until it ends the cycle from 2016.
If you want to learn more the new Elliott Wave Theory using our system then take this opportunity and try our services 14 days. You’ll learn how to trade Stocks and ETFs using our blue boxes and the 3, 7 or 11 swings sequence. You’ll also get access to our 78 instruments updated in 4 different time frames, Live Trading & Analysis Session done by our Expert Analysts every day, 24-hour chat room support and much more.
Back


