Walt Disney Company (NYSE: DIS) is one of the strongest players in the entertainment industry on a global scale and it rewarded its investors by a +255% return over the recent decade , more than twice the S&P 500’s 95% total return. The company wrapped up its sixth consecutive year of record-high sales and profits with revenue rising 14% and adjusted earnings per share (EPS) soaring 28% mostly driven by the phenomenal success of its movie “Star Wars: The Force Awakens” .
Although the entertainment giant’s overall business has been performing superbly, it’s facing an important challenge as many consumers are moving away from cable subscriptions and joining online streaming services like Netflix , and this is hurting traditional TV operators across the board.
After struggling for more than a year, Disney’s stock has moved steadily upwards gaining +20% over the last three months and pushing into new highs. Investors are optimistic heading into its first-quarter results for fiscal 2017 next Tuesday 7th February as the latest movie “Rogue One: A Star Wars Story”, released in mid-December, has been dominating box offices around the world , so let’s take a look at the technical picture and discuss the possible paths that the stock may follow .
Disney Elliott Wave Technical Analysis
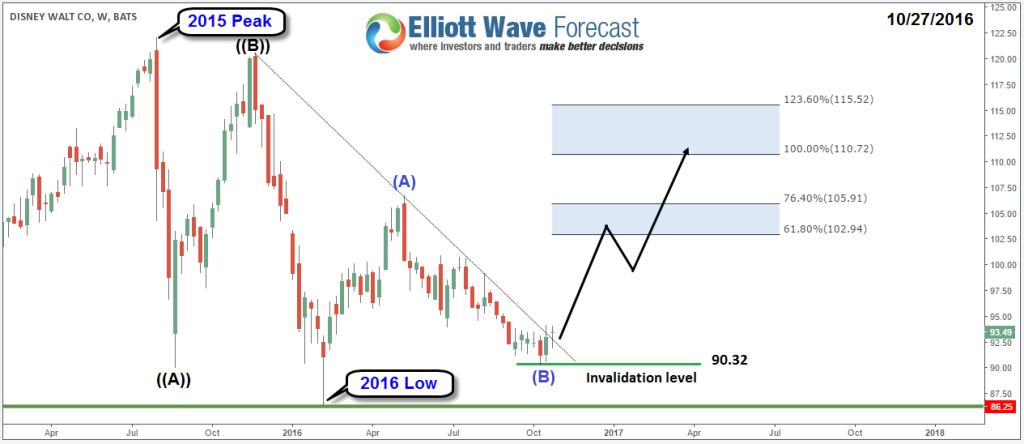
Since the 2015 peak , Disney made 3 waves pullback providing a first buying opportunity exactly 1 year ago. After doing the first leg up , the stock pullback held 2016 low and on October started breaking above its descending trend-line signaling that bulls are back in town aiming for $110 area that we are showing in a chart from October 2016 in which we were looking for extension higher toward that target which was achieved last week .
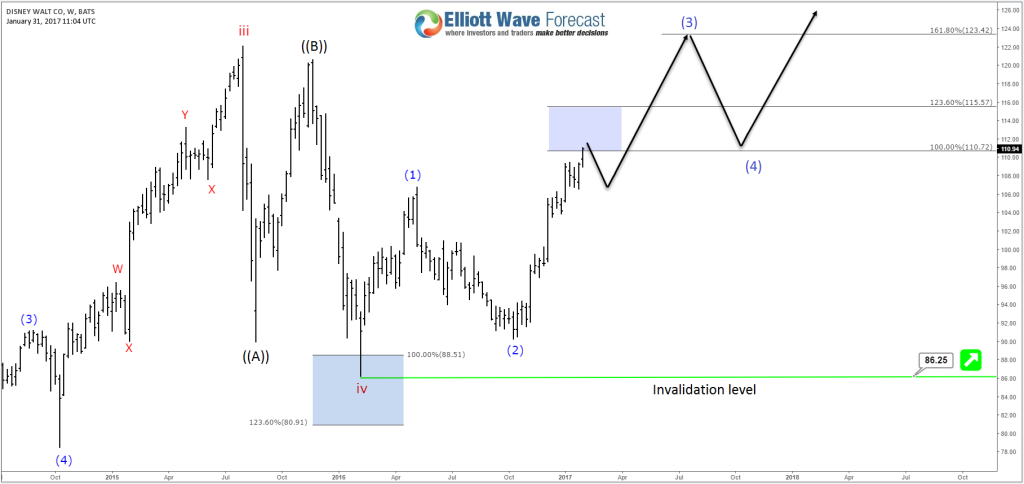
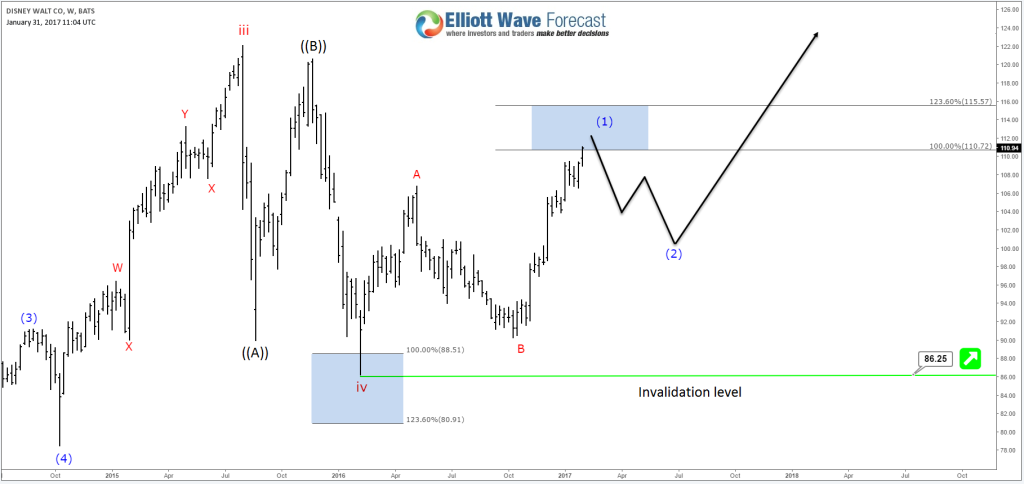
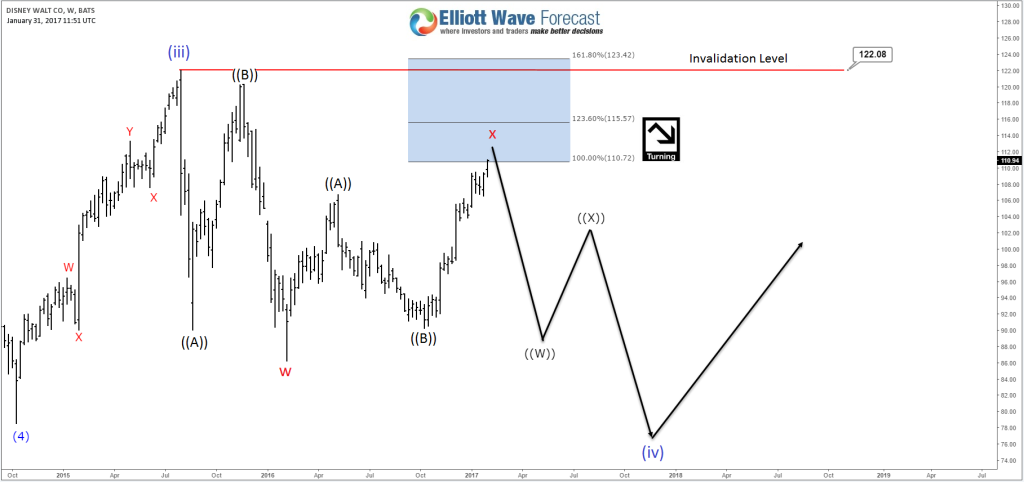
So now after Disney reached the equal legs area ($110 – $115) from February 2016 low , there is 3 possibilities that could take place for the stock :
Scenario 1: The most aggressive path would happen if DIS is doing a diagonal structue in the current red wave v that started from February 2016 low , so it’s currently in the blue wave (3) that should unfold as 3 waves and the stock is only ending the first leg which mean it can correct the rally from October 2016 low before resuming higher toward $123 area.

Scenario 2: DIS will end 3 waves as a Flat structure as the first leg A was 3 waves and the third leg C is unfolding as 5 waves which means that it will soon be ending the 2016 cycle and start correcting lower before it can resume the upside looking for new highs as long as $86.25 low is holding .

Scenario 3: The surprise would happen if Disney already ended a larger degree cycle wave (iii) and it’s still in a corrective stage. Consequently , the stock is finishing a connector red x and should hold below 2015 peak $122 to resume another leg to the downside before ending 7 swing sequence and resume higher or bounce in 3 waves at least.

Recap : The overall view of Disney remain bullish as Disney movie brands Marvel & Pixar are well ahead of their competitors despite facing new challenges . Technically , the stock is currently in an extreme area and could soon experience a pullback that will define the path for the coming year either new highs or sideways to lower depending on the speed and structure of the correction if it happens .
If you enjoyed this article, feel free to navigate to our Technical Blog and also check our Chart of The Day .
For further information on how to trade forex, indices, commodities and stocks using Elliott Wave Theory , try us 14 days for FREE . You will get access to our Professional Elliott Wave analysis in 4 different time frames, Daily Elliott Wave Setup Videos , Live Trading Room and 2 Live Analysis Session done by our Expert Analysts every day, 24 hour chat room support, Weekly Technical videos and much more so if you are not a member yet, use this opportunity and sign up to get your FREE trial .


