The Corona Virus has provided some amazing opportunities for certain sectors. Cloud computing is one of those sectors that have vastly outperformed the marketplace since the March 2020 low. DataDog Inc is in the cloud computing business and has been on a tear since the all time lows that were printed in March 2020. Lets take a look at what the company does:
“Datadog helps developers and operations teams see their full infrastructure – cloud, servers, apps, services, metrics, and more – all in one place. This includes real-time interactive dashboards that can be customized to a team’s specific needs, full-text search capabilities for metrics and events, sharing and discussion tools so teams can collaborate using the insights they surface, targeted alerts for critical issues, and API access to accommodate unique infrastructures.
Datadog also integrates with various cloud, enterprise, and developer software tools out of the box, so established team workflows will be unchanged and uninterrupted when adopting Datadog’s service.”
Cloud computing is one of the sectors that the marketplace has made clear will benefit in the future. DDOG is counting clean off the October 2019 all time low low, lets take a look at the Daily chart below.
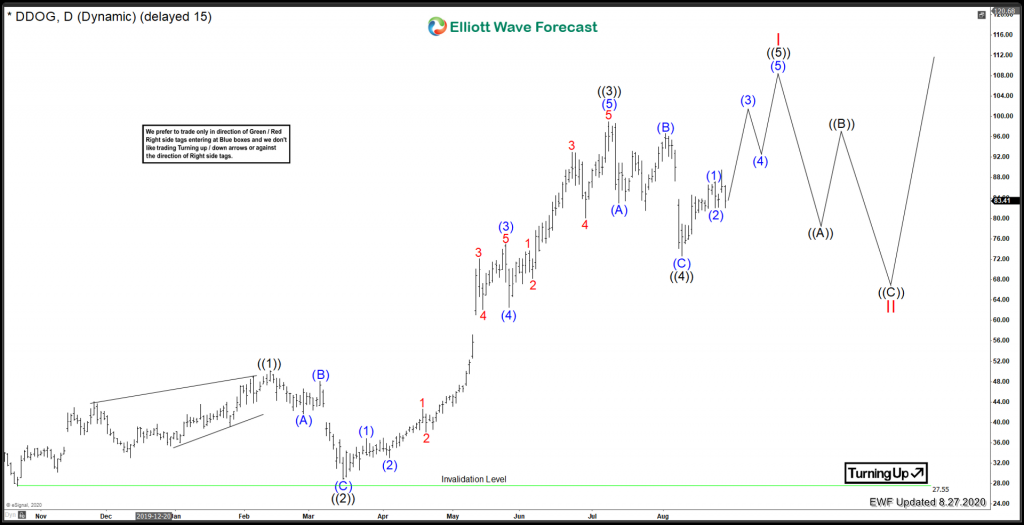
DataDog Elliottwave Daily View:
DataDog has not been public that long, and doesn’t have much historical data. It set an all time low in October 2019, and has rallied impulsively off that low. It set a wave ((2)) low in March 2020 and has been acting impulsively from there. Lets take a look at some levels.
Medium term term view from 10/23/2019 lows of 27.55. Wave ((1)) is set at 50.12 on 2/12/2020 and wave ((2)) at 28.88 on 3/216/2020. After that, an extended Black ((3)) took place, which topped on 7/09/2020 at 98.99. After that, Black ((4)) is favoured to be set at 72.60 on 8/10/2020. Currently, the is an incomplete bullish sequence off the October low. This means that one more high is needed to meet the minimum number of swings to complete an impulse from the Oct 2019 lows. The area that Black ((5)) can target is from 105.40 to 115.56 before setting a larger degree Red I peak.
In conclusion, Black ((4)) is favoured to be set as long as that 72.60 low remains intact. Blue (1) of Black ((5)) is also favoured to be set. But prices can correct a bit deeper for blue (2). As long as ((4)) low remains intact, I do favour one more high to take place to complete the bullish sequence. After that, a deeper pullback in Red II can be realized.
Risk Management
Using proper risk management is absolutely essential when trading or investing in a volatile stocks. Elliott Wave counts can evolve quickly, be sure to have your stops in and define your risk when trading.
Improve your trading success and master Elliott Wave like a pro with our free 14 day trial today.
Back

