Chevron Corporation (CVX) is an American multinational energy company. It is the second largest oil company in the United States and has operation in more than 180 countries. Chevron is involved in the entire spectrum of supply chain within the oil and natural gas industries from exploration, production, refining, marketing, transport, and sales. Due to the war between Russia and Ukraine, the U.S and European countries have tried to reduce dependency on Russia’s oil and energy exports. Moreover, the West has pressured and threatened other countries with secondary sanction if they do business with Russia.
This has caused the reduction of supply in the energy market. As a result, energy price such as oil, diesel, and natural gas have spiked higher contributing to the high inflation data. This elevated price may remain here for a longer time as there doesn’t seem to be an end in the war anytime soon. Moreover, even when the war ends, sanctions might still be intact and European countries will not go back to their previous relationship with Russia anytime soon. Despite the brutal selloff in high tech sector and general market, energy sector remains one of the bright sides. Below we look at the Elliott Wave outlook of Chevron Corporation.
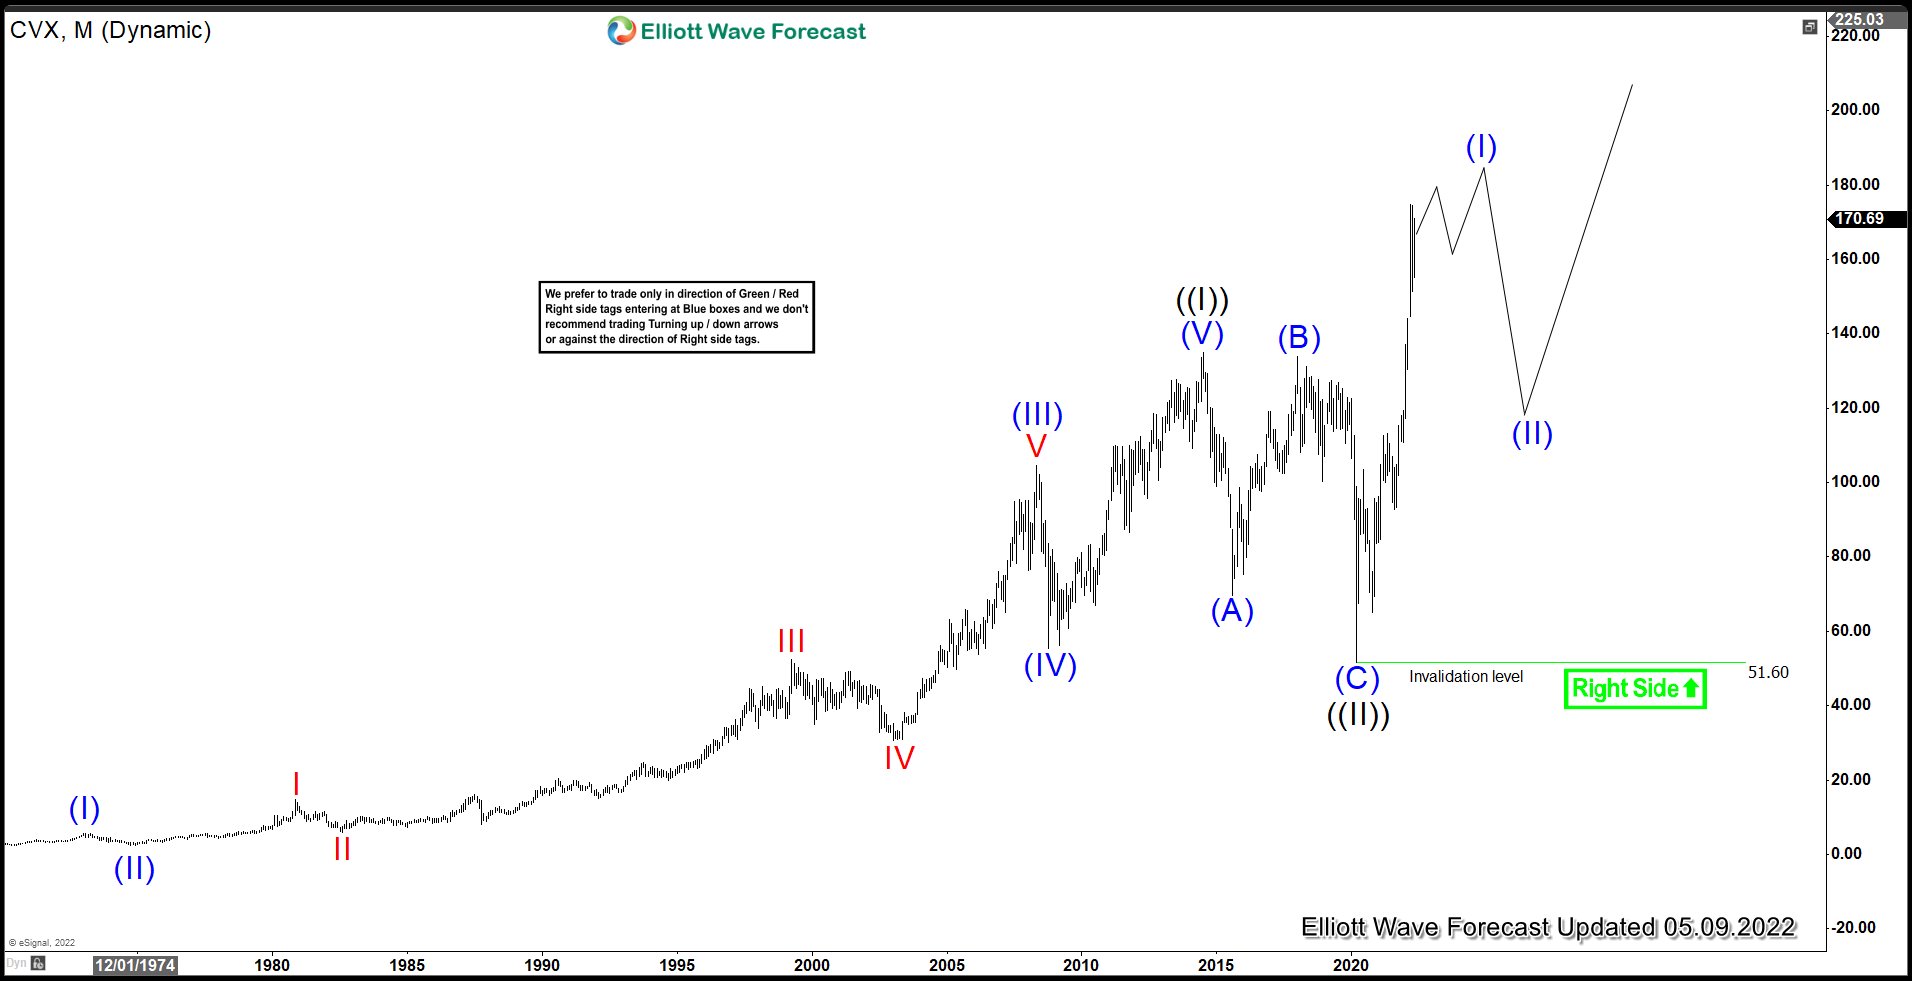
Chevron Monthly Elliott Wave Chart
Monthly Elliott Wave of CVX suggests the rally to $135.1 on July 2014 ended wave ((I)). Pullback in wave ((II)) ended at $51.60 on March 2020 low as a zigzag Elliott Wave structure. The stock has resumed higher in wave ((III)) with internal subdivision as a 5 waves impulse. Expect a few more highs to end wave (I) before it pullback in wave (II) and extends higher again.
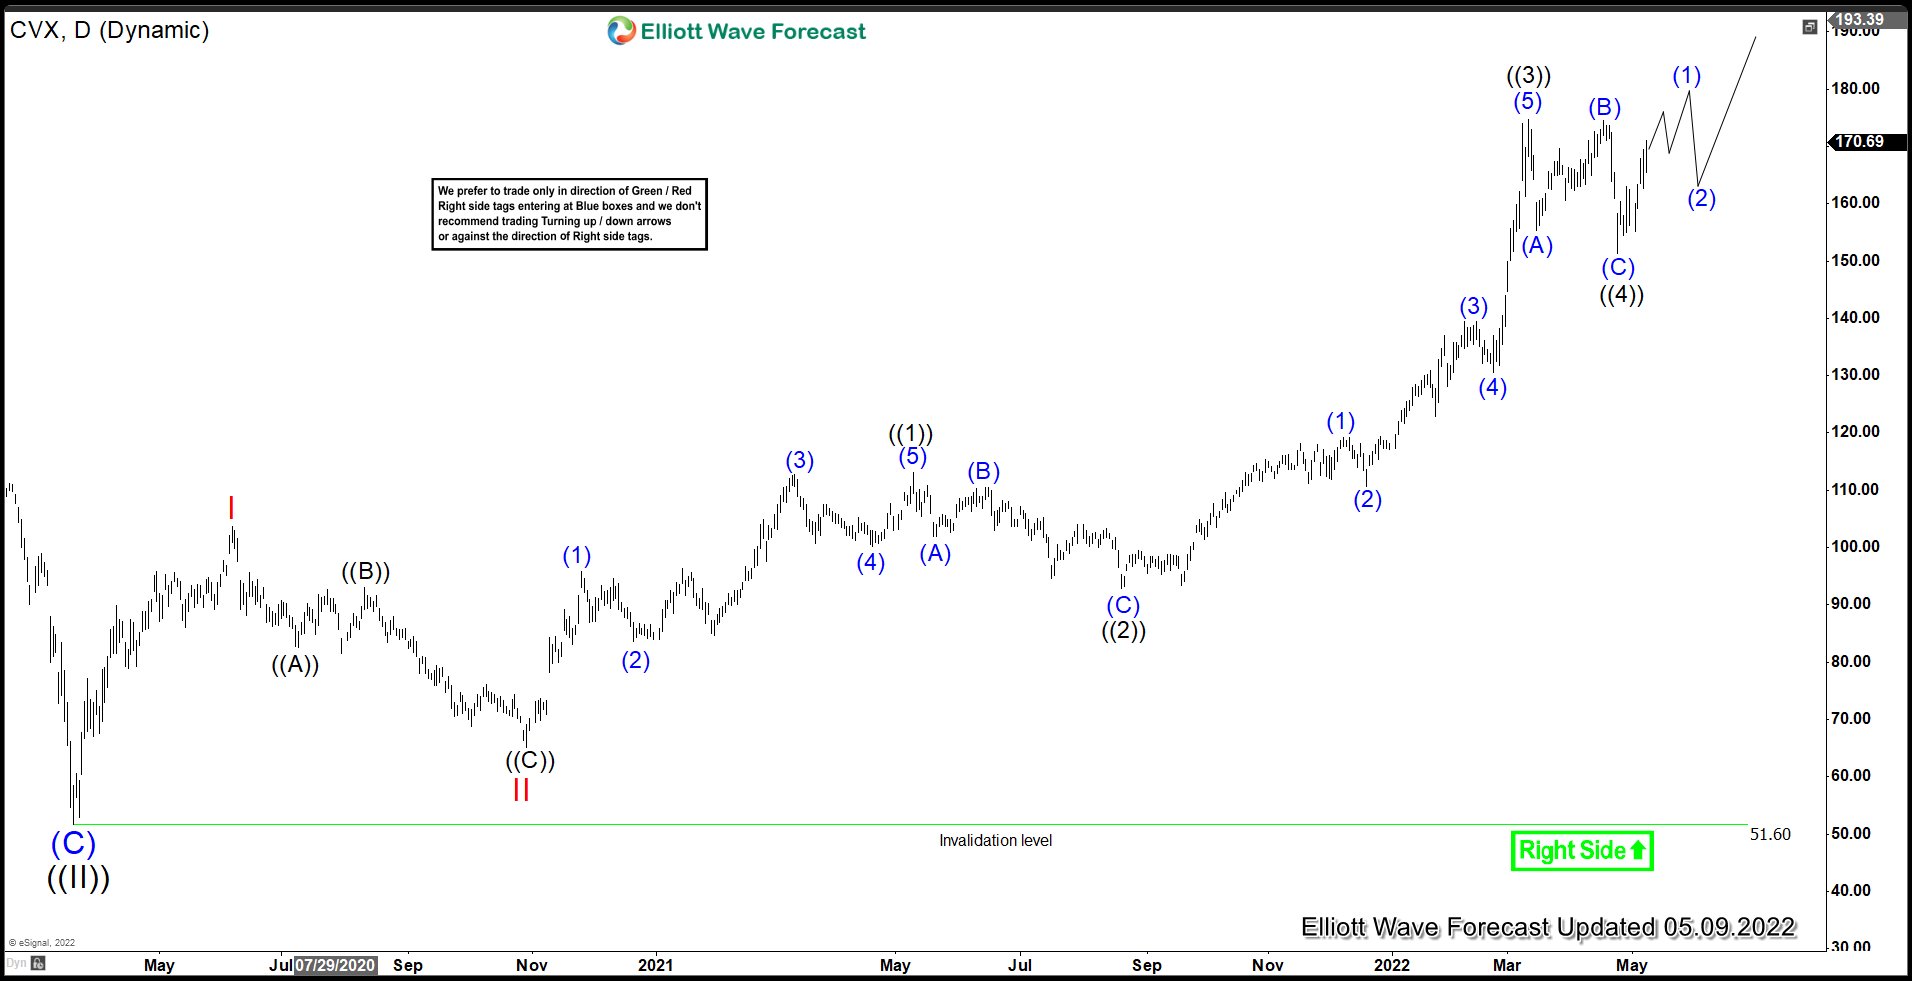
Chevron Daily Elliott Wave Chart
Daily Chart of Chevron above suggests rally from wave ((II)) low is nesting as an impulse. Up from wave ((II)), wave I ended at $103.59 and pullback in wave II ended at $65.16. Wave III is currently in progress with internal subdivision as another impulse in lesser degree. Up from wave II, wave ((1)) ended at $113.11 and wave ((2)) ended at $92.86. Wave ((3)) ended at $174.76, and pullback in wave ((4)) ended at $151.36. Expect stock to continue higher within wave ((5)) of III as far as it stays above $151.36.
If you’d like to get regular updates on other stocks, ETF, forex, and commodities, feel free to take our trial here –> 14 days Trial
Back


