Chevron Corporation (CVX) is one of the world’s largest integrated energy companies, engaged in all aspects of the oil and natural gas industry. Headquartered in San Ramon, California, Chevron operates in various segments including exploration and production, refining, and marketing. The company’s operations span across multiple continents, with significant assets in the United States, Australia, Kazakhstan, and several other countries. Below we update the Elliott Wave outlook for the company.
Chevron Monthly Elliott Wave Chart
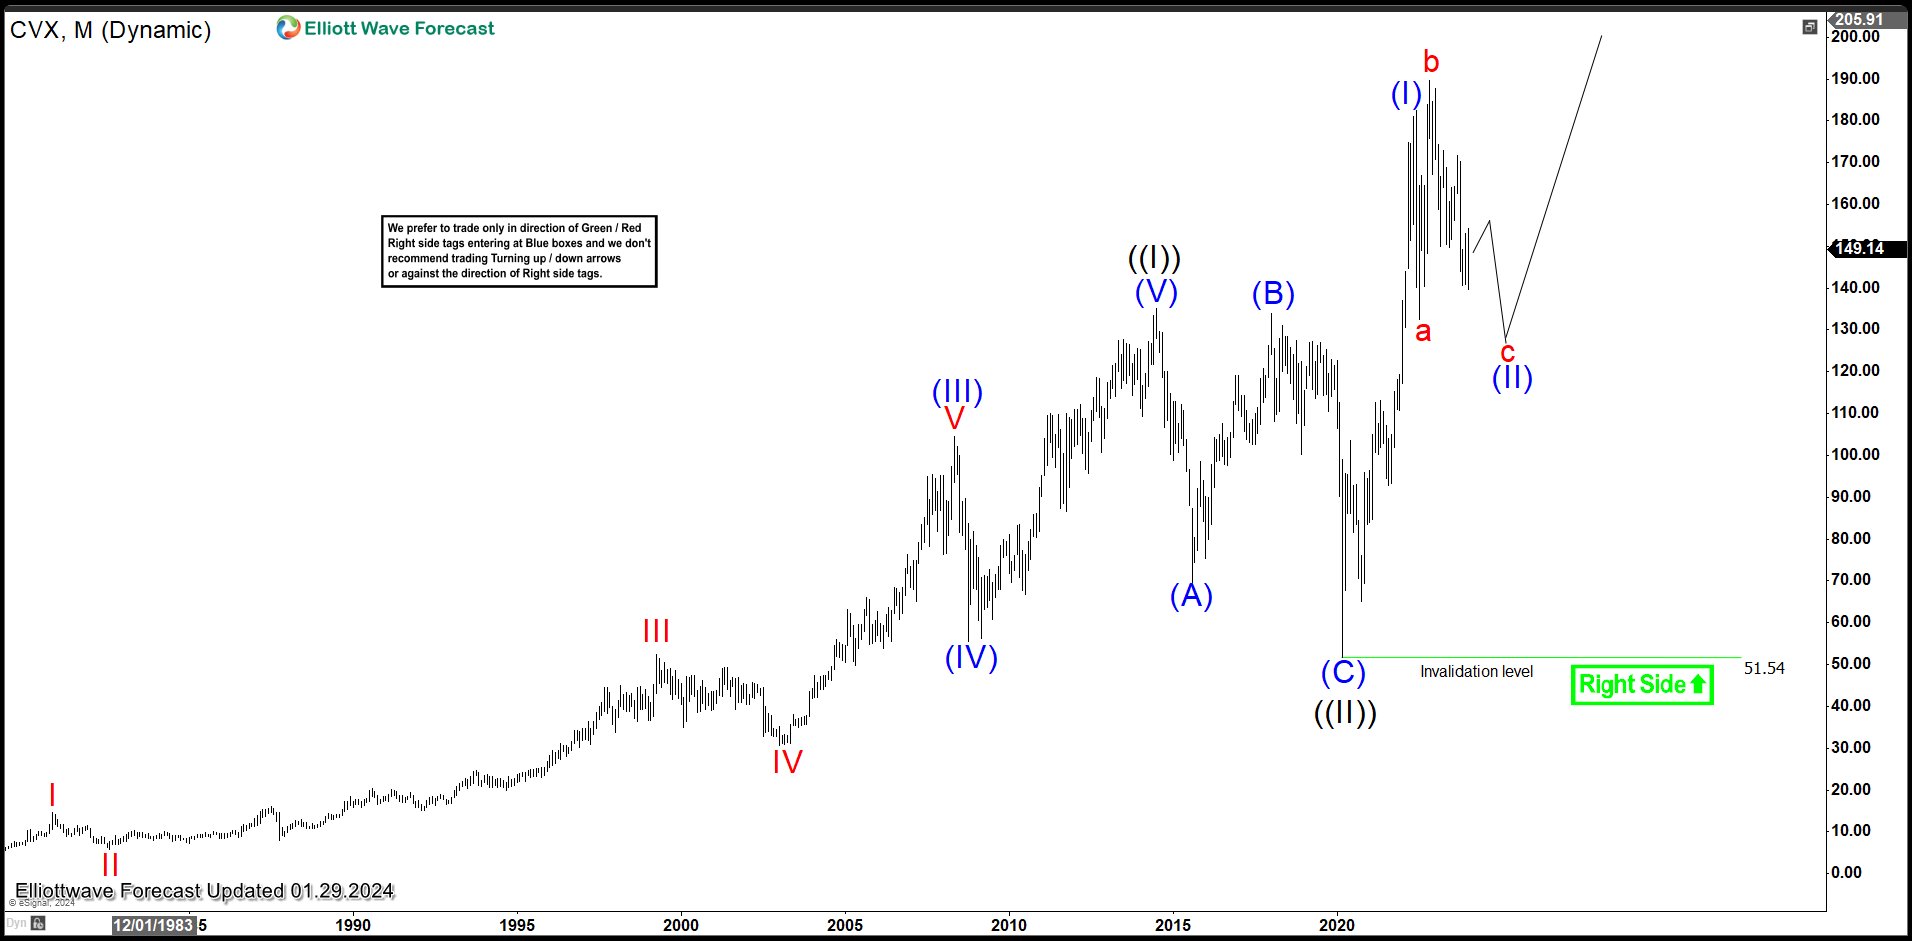
Monthly Elliott Wave Chart of Chevron (CVX) above shows that the rally to 135.1 ended wave ((I)). Pullback in wave ((II)) unfolded as a zigzag Elliott Wave structure. Down from wave ((I)), wave (A) ended at 69.58 and rally in wave (B) ended at 133.88. The stock then extended lower in wave (C) towards 51.54 which completed wave ((II)) in higher degree. Chevron then extended higher in wave ((III)). Up from wave ((II)), wave (I) ended at 182.4. Pullback in wave (II) is in progress as expanded flat before the stock resumes higher again. As far as pivot at 51.54 low stays intact, expect dips to find support once the expanded flat correction is complete and the stock to extend higher.
Chevron Daily Elliott Wave Chart
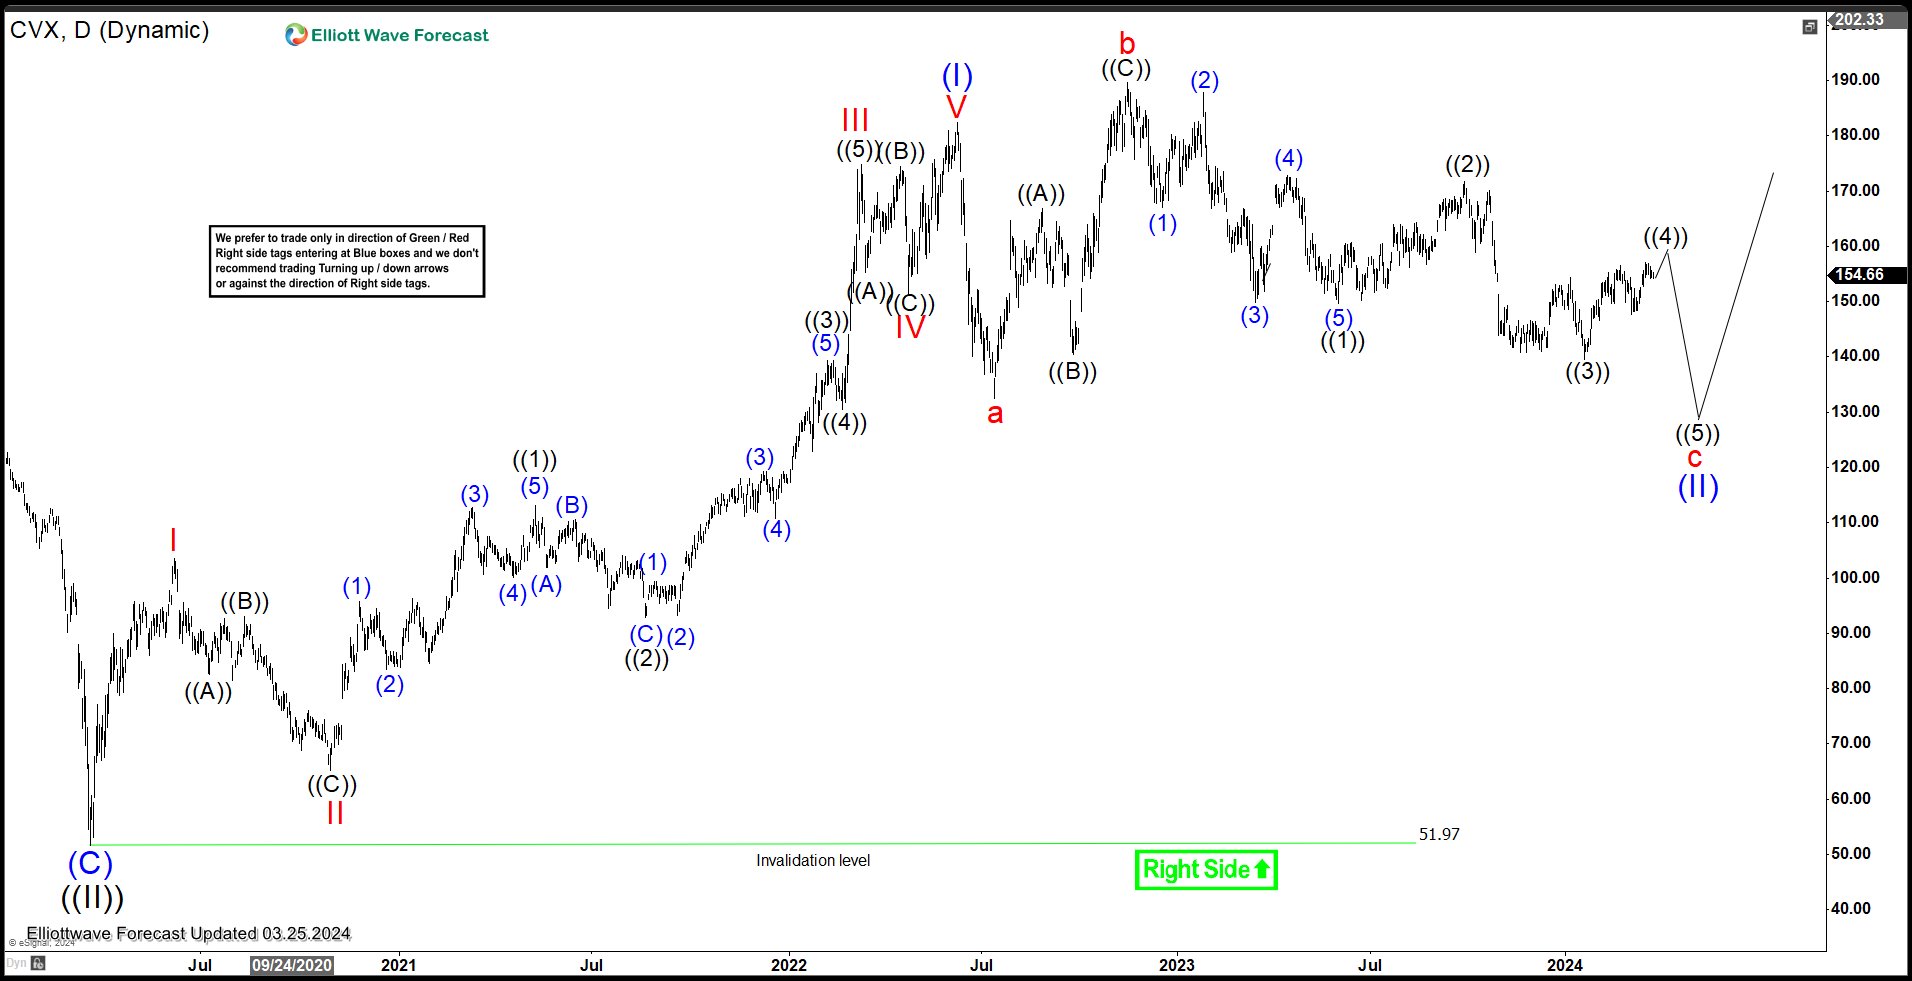
Daily Elliott Wave Chart for Chevron above shows that rally to 182.4 ended wave (I). Pullback in wave (II) is unfolding as an expanded Flat Elliott Wave structure. Down from wave (I), wave a ended at 132.54 and wave b ended at 189.68. Stock then turned lower in wave c which subdivides into 5 waves diagonal. Down from wave b, wave ((1)) ended at 149.74 and wave ((2)) ended at 171.7. Wave ((3)) lower ended at 139.62. Expect wave ((4)) to end below wave ((2)) and stock to turn lower 1 more leg in wave ((5)) before ending wave c of (II). As far as pivot at 51.97 low is holding, expect pullback to find buyers and stock to extend higher.
If you’d like to get regular updates on other stocks, ETF, forex, and commodities, feel free to take our trial here –> 14 days Trial
Back


