Hello Traders. In this previous Boeing blog, we discussed the path for the Boeing stock.
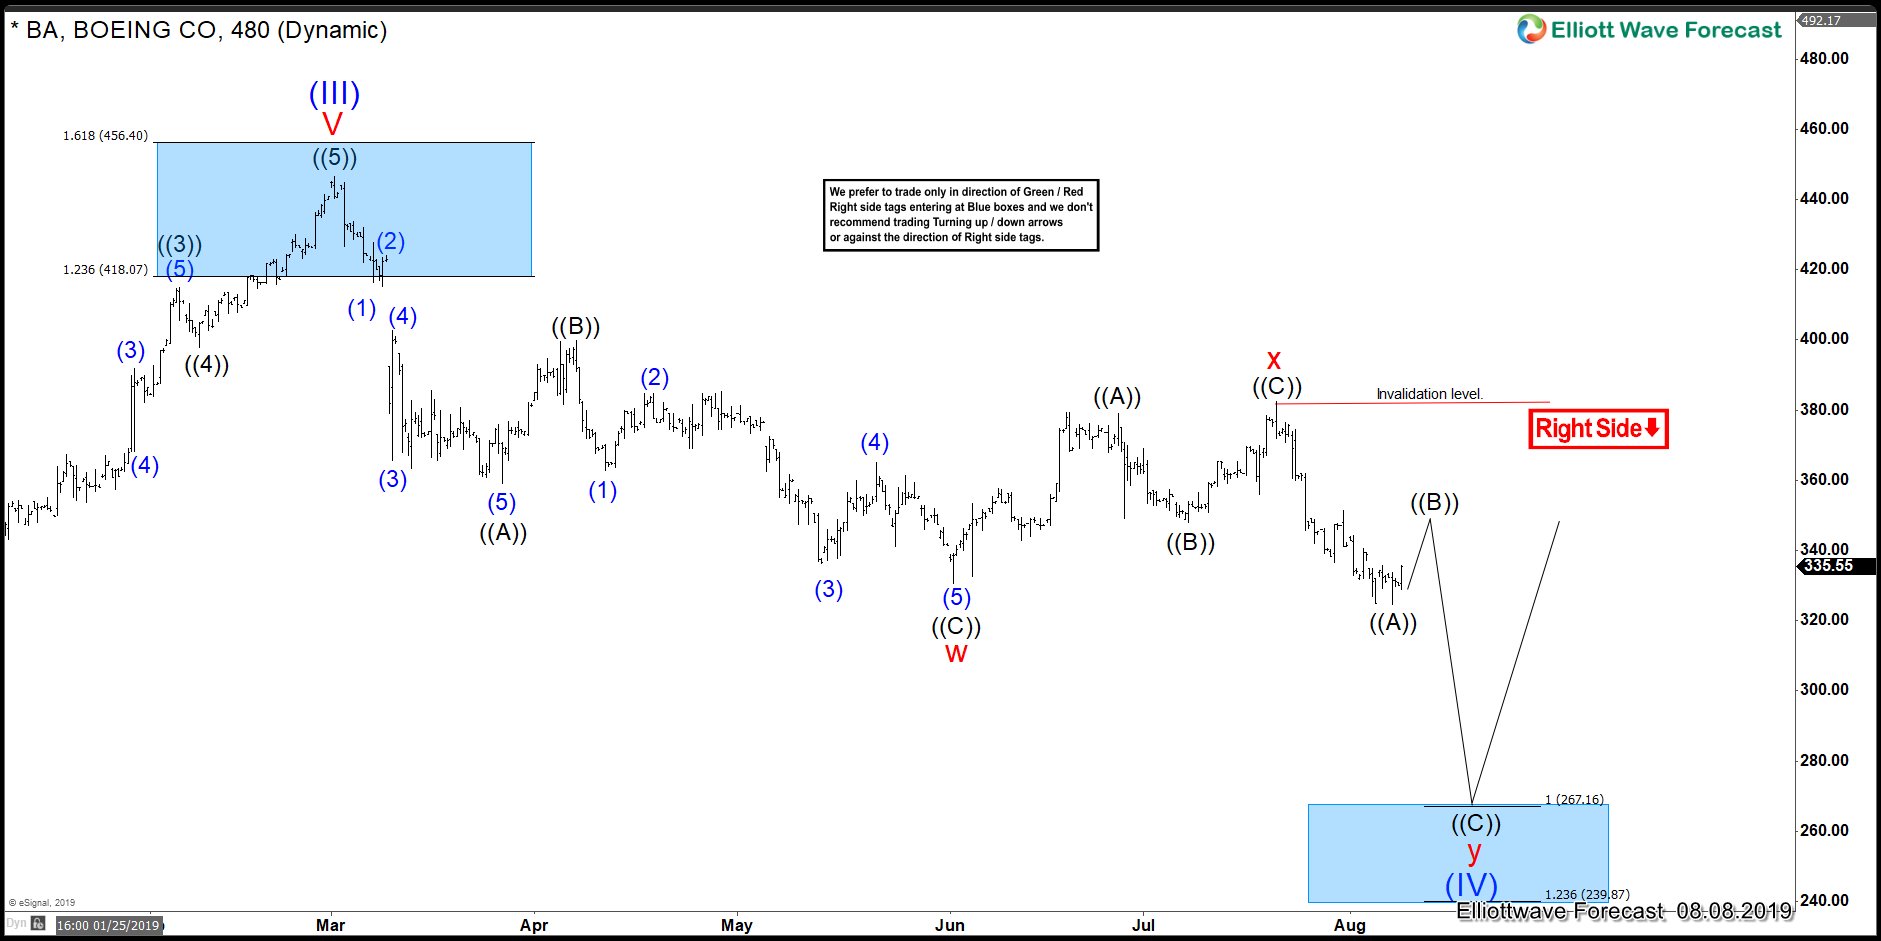
Now, let have a look at the latest 4 Hour chart. We can see that soon the stock will be reaching the $267.00 area. That area in the following chart is the 100% extension from 3.1.2019 peak. The Instrument has created a bearish sequence from its March 2019 peak and should trade lower into the mentioned target.
Boeing (BA) 8.8.2019 4-Hour Elliott Wave Analysis
The idea of the bearish sequence in Boeing will keep the world Indices sideways at best. But most likely will force Indices into a 7 swings structure from their July 2019 peak respectively.
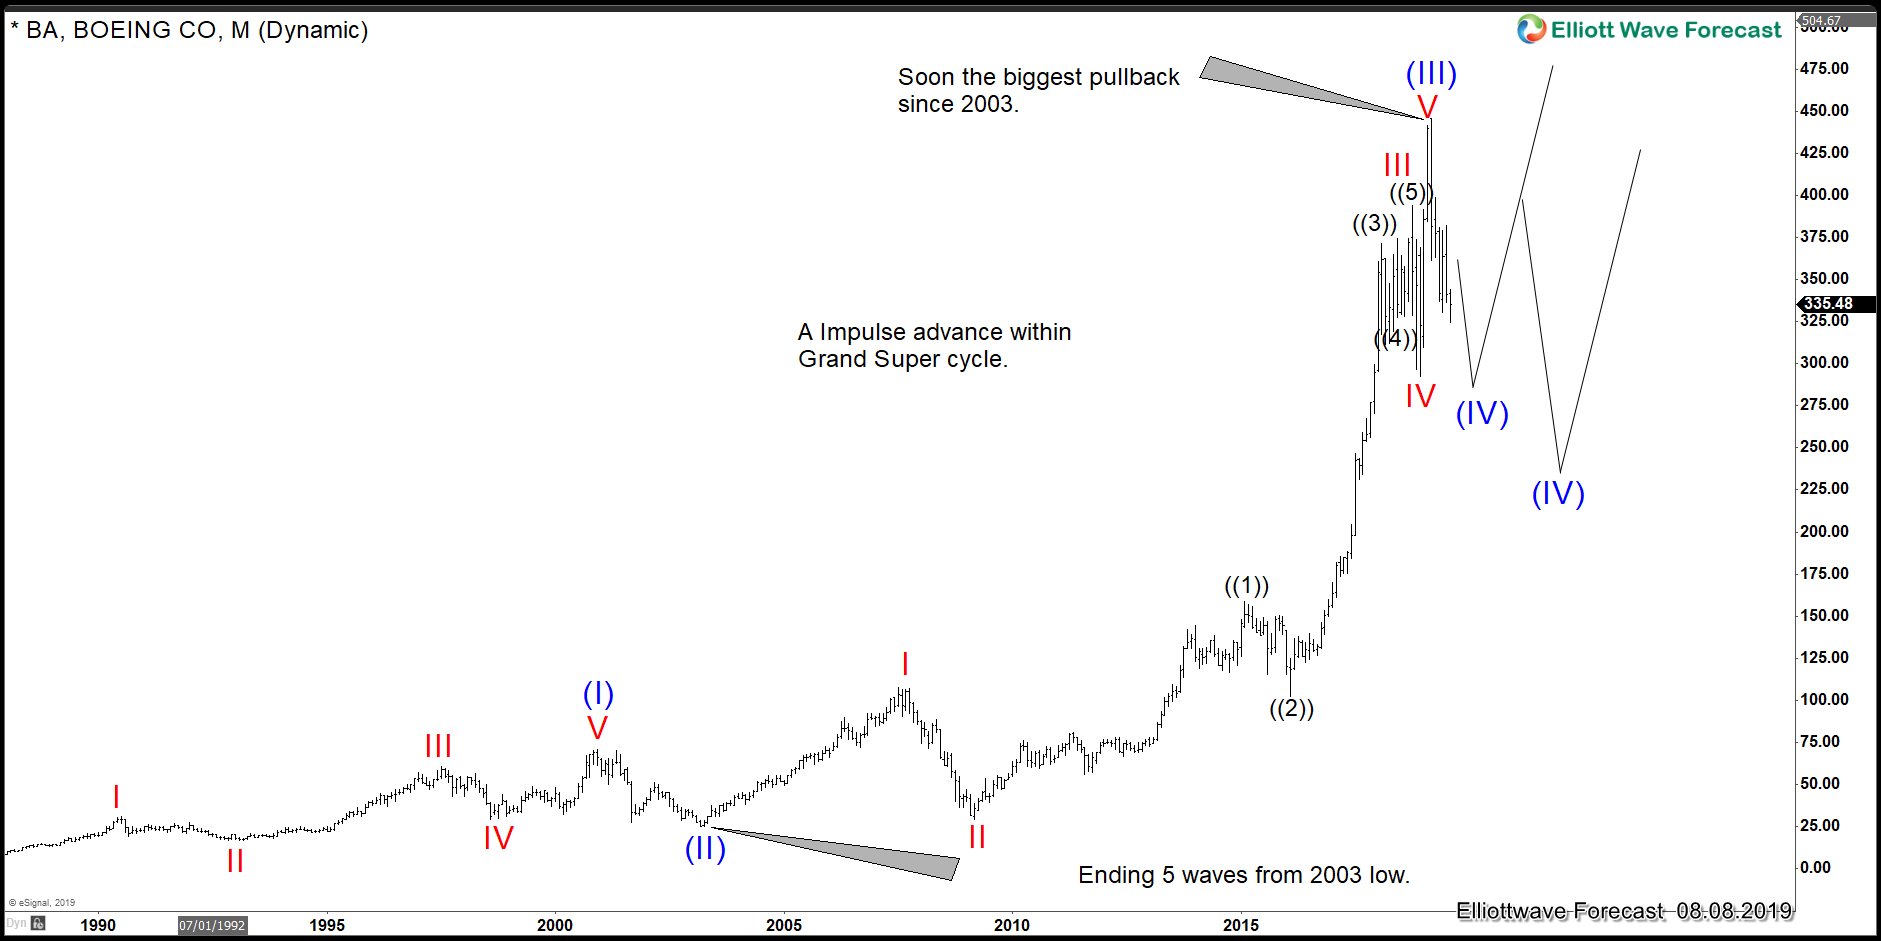
It will be interesting to see what BA will do when reaching the $267.00 area. Because from there either rally into new highs or fail to make new highs and then turn lower again. Which can be seen in the chart below.
Boeing (BA) 8.8.2019 Monthly Elliott Wave Analysis
As we know, SPX, SPY and some other World Indices have the minimum numbers of swings within the Supercycle degree since 2009 low in place. And the reaction in BA from $267.00 will dictate if they will extend within the 2009 cycle or a significant peak have formed already. We still believe nothing significantly has happened across World Indices and the 2018 Decembmer low pivot is holding.
But BA will be showing the path for months and even years to come. The following video explains the idea and why the timing of the $267.00 target will make the difference if the SPX will see the 3500-3700 area.


