In this blog, we will take a look at the drop in AT&T in July and how that presented a buying opportunity in the stock which we highlighted on our chart. We also prove that all markets are technical and even when fundamentals news can create short-term volatility in the market, it doesn’t have the power to change the long-term trend. We are all aware that AT&T has been in the news a lot lately because of it’s $85 billion acquisition of Time Warner. We also know that federal government had gone to court in order to block this deal. On Tuesday, June 12 2018, a federal judge handed AT&T a sweeping victory and approved it’s $85 billion acquisition of Time Warner. This should have been viewed as a good news for AT&T and stock price should have rallied but let’s take a look at the the price action on June 12 and see what happened after the ruling on June 12.
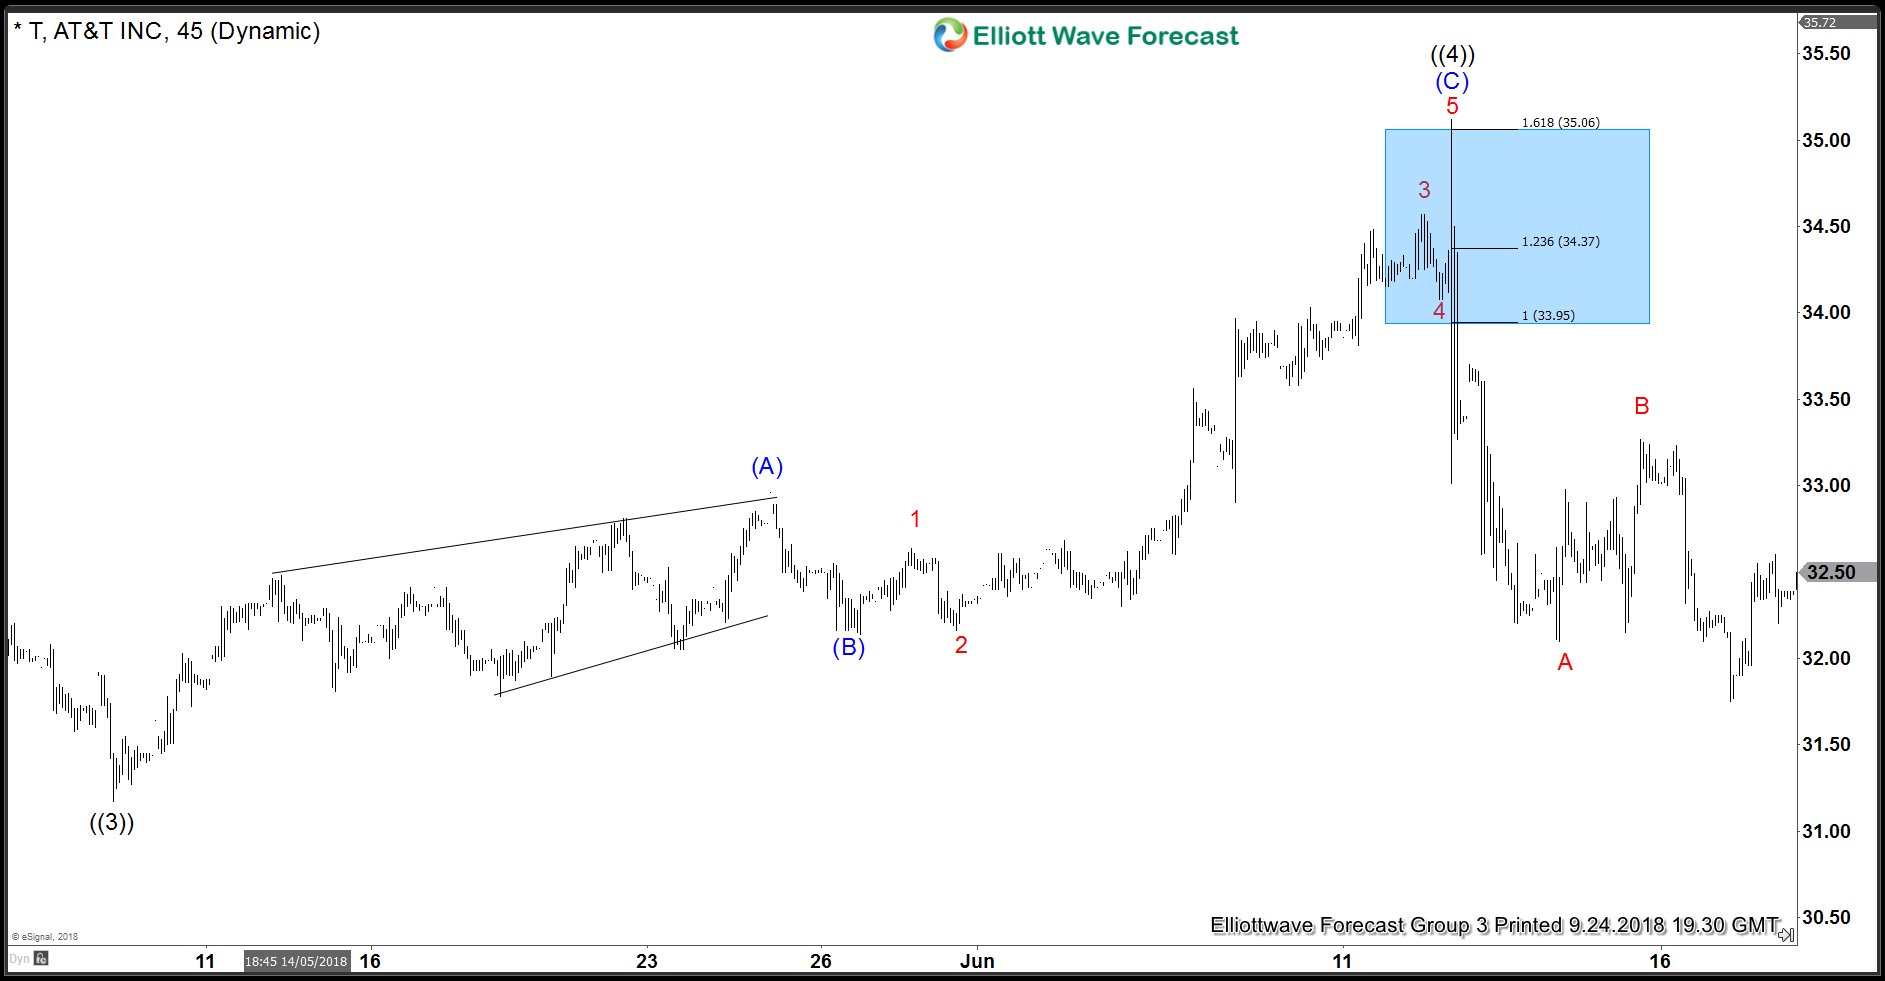
AT&T Chart below shows stock price was trading around $34.25 area, we have highlighted the area between 33.94 – 35.06 with a blue box because it represented 100 – 161.8% Fibonacci extension area of blue (A)-(B) i.e the rally from 31.17 (May 9) low to 32.96 (May 25) high projected higher from 32.12 (May 29) low. When AT&T got the go ahead from the court on June 12, stock price was already in the blue box which means there wasn’t enough room for a rally so there was an initial spike higher to the top of the blue box but it was quickly rejected resulting in a sharp drop to 33.01 after hours. So after hours, stock price had dropped which supports our case that markets move on the basis of technicals and not fundamentals.
AT&T Price action from May 9 low to June 12 high
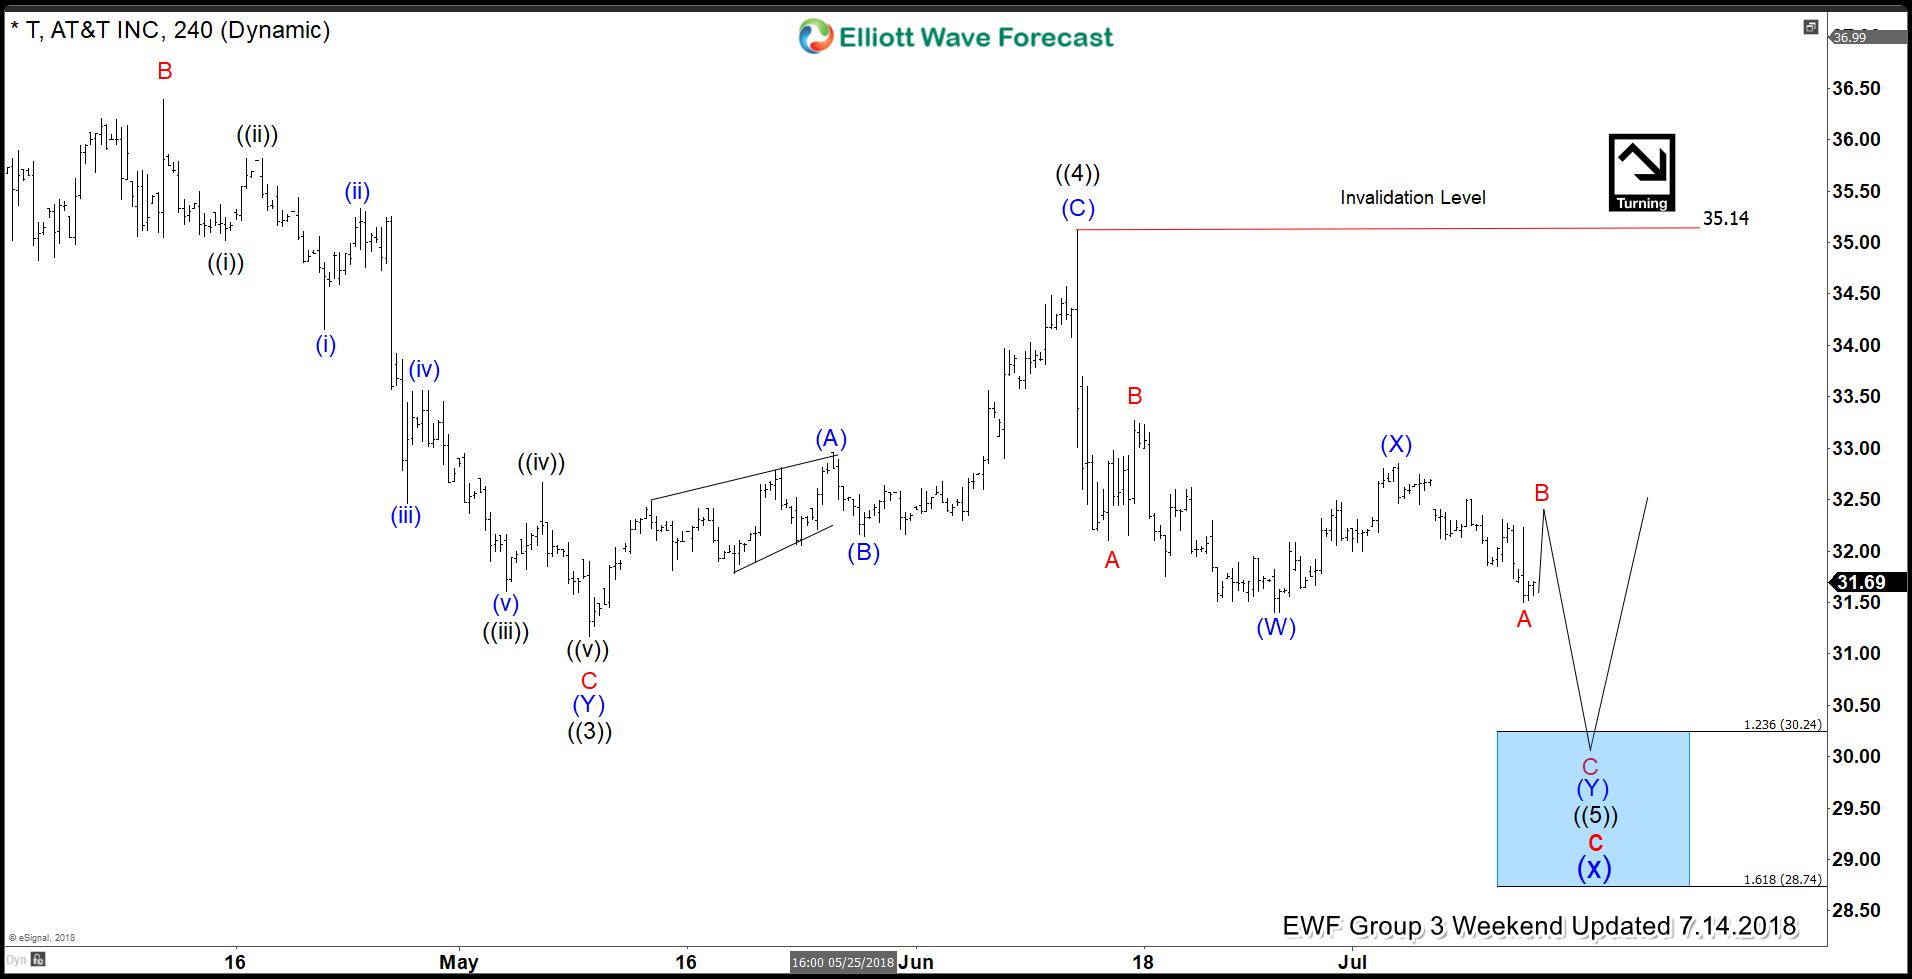
AT&T 14 July 4 Hour Elliott wave Analysis
AT&T preferred Elliott wave structure had the stock in a FLAT structure from July 2016 peak. On July 14, another low was expected in wave ((5)) towards 30.24 – 28.74 which highlighted the inverse 1.236 – 1.618 Fibonacci extension area of wave ((4)) recovery. A few days later, price dropped to 30.07 to complete 7 swings down from wave ((4)) peak, that met minimum requirements for wave ((5)) extension and completed minimum number of swings in the Elliott Wave FLAT structure down from July 2016 peak and resulted in a rally in the stock.
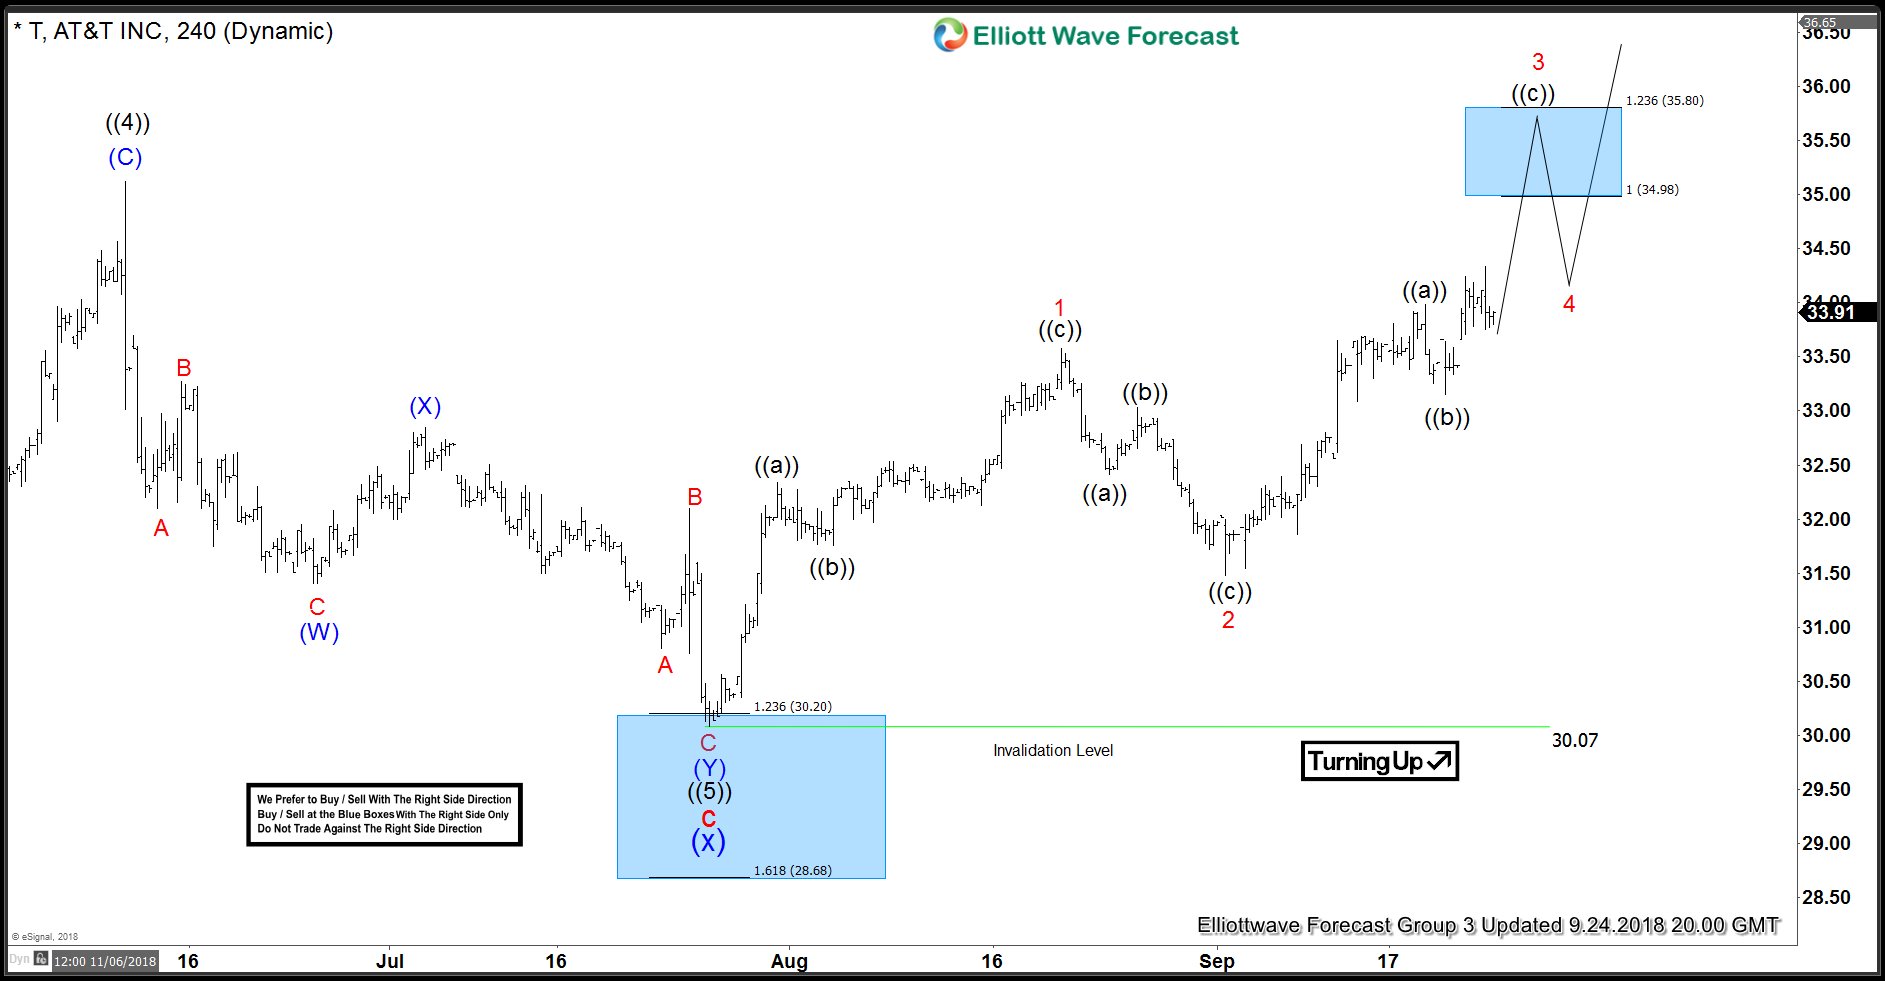
AT&T 24 September 4 Hour Elliott Wave Analysis
Chart below shows stock has rallied nearly $4 from the low in the blue box and any longs from the blue box should already be in a risk free position. Currently, we have an incomplete sequence higher from 30.07 low which calls for more upside towards 34.98 – 35.80 area to complete 7 swings up from 30.07 low. After that it should either pull back in wave 4 and extend higher to complete a diagonal structure up from 30.07 low or make a larger pull back to correct the entire rally from 30.07 low.
Back


