Amazon is one of the fewest company that kept a strong portfolio during the recent decades even after 2 stock market crises . The company issued its initial public offering of stock on 1997, trading under the NASDAQ stock exchange symbol AMZN, at a price of $1.50 per share and since then the price just kept rising year over year providing the best return for its investors .
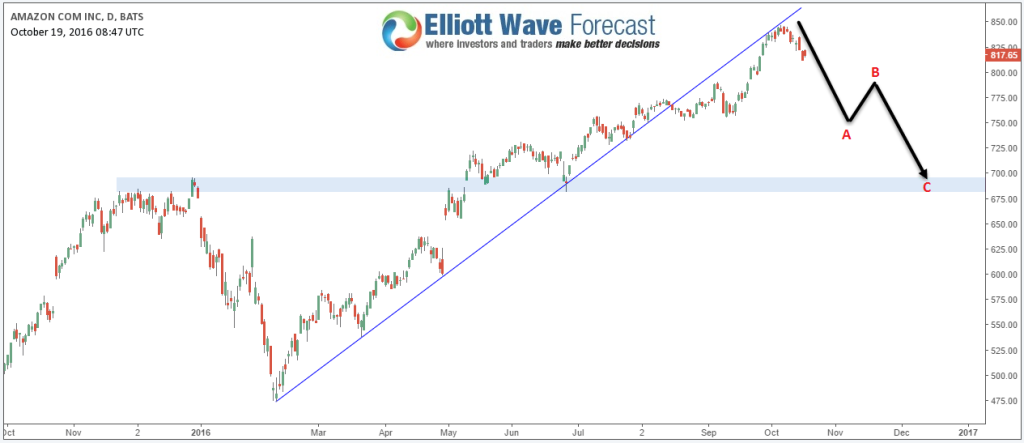
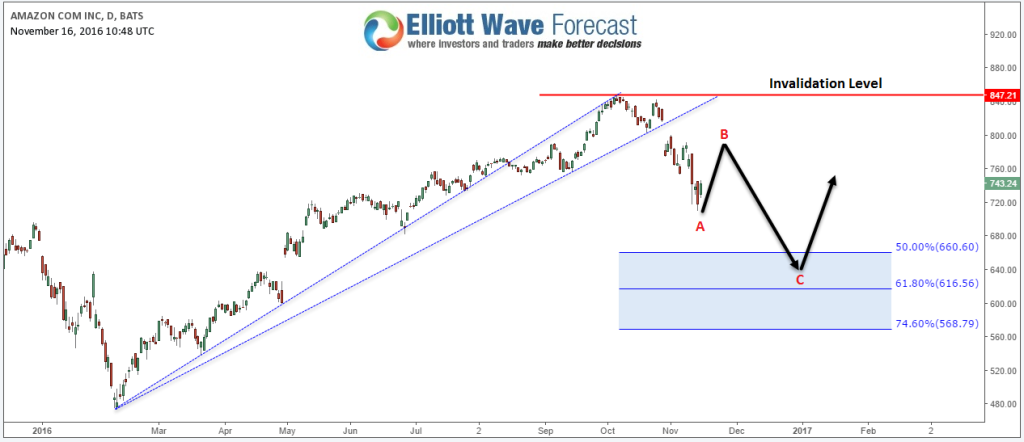
After almost 20 years , Amazon is still rising and making new all time highs . Recently on the 6th of last October the stock made another high at $847.21 retesting the broken trend-line from February low then starting a pullback from there . The stock was expected to resume higher as usual but the pivot at September low gave up indicating that the stock was looking for a deeper 3 wave pullback before buyers could step up once again.
Looking at the current daily chart of AMZN , the stock is correcting the rally from Fabruary low looking to reach 50% – 74.6% Fibonacci area at ( $660.6 – $568.8 ) to end 3 waves from $847.2 peak . Currently it’s ending the first leg A of the correction and it’s expected to bounce in wave B against October peak before doing another leg to the downside . The correction doesn’t necessary have to be a Zigzag ( ABC ) it could switch depending on the coming structure but what’s more important is that the main trend for the Amazon remain bullish and any correction in 3 , 7 or 11 swings should provide an opportunity to buy it either for new highs or at least a larger bounce .
For further information on how to find levels to trade forex, indices, and stocks using Elliott Wave and the 3 , 7 or 11 swings technique, try us for 14 days. You will get access to Professional Elliott Wave analysis in 4 different time frames, Daily Elliott Wave Setup Videos , Live Trading Room and 2 live Analysis Session done by our Expert Analysts every day, 24 hour chat room support, market overview, weekly technical videos and much more so if you are not a member yet, use this opportunity and sign up to get your trial . If you enjoyed this article, feel free to read other diversified articles at our Technical Blogs and also check Chart of The Day .
Back


