Advanced Micro Devices, Inc. (AMD: NASDAQ) is a Global semiconductor company based in California and it was founded 48 years ago. The company’s main products include microprocessors, motherboard chipsets, embedded processors and graphics processors for servers, workstations and personal computers, and embedded systems applications.
The semiconductors industry saw it’s biggest growth since 2014 as global revenue surpassed $101.4 billion for the last quarter and it’s related stocks price kept flying high. The sector has benefited from the climbing prices of cryptocurrencies such as Bitcoin and Ethereum as demand for graphical card ( GPU ) for mining purpose and gaming as well surged higher.
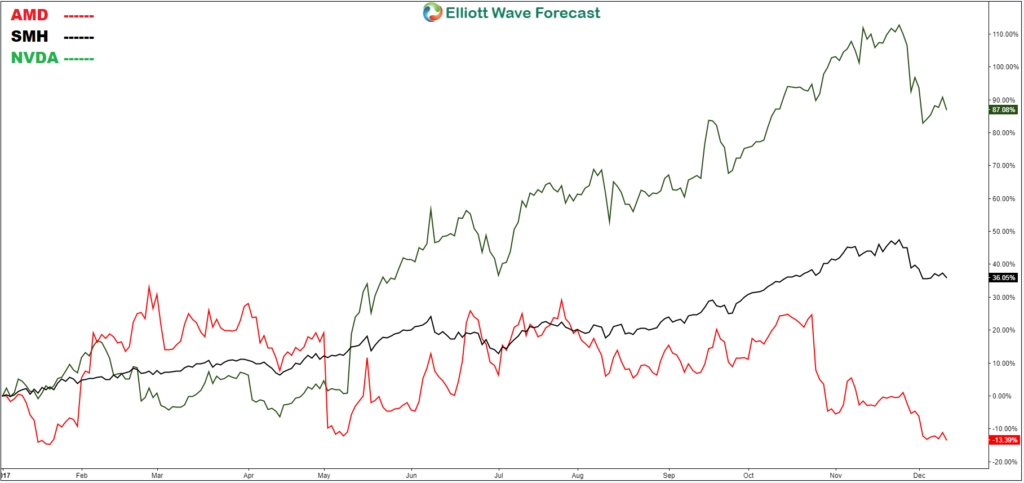
The graph above shows the 2017 performances of the VanEck Vectors Semiconductors ETF (SMH) as well as chipmakers NVIDIA (NVDA) and Advanced Micro Devices (AMD) :
We can notice that both NVDA & SMH is having a good year as the stock & etf are making record highs compared to AMD which is now entering the negative territory ( -13% ) after a good start early this year.
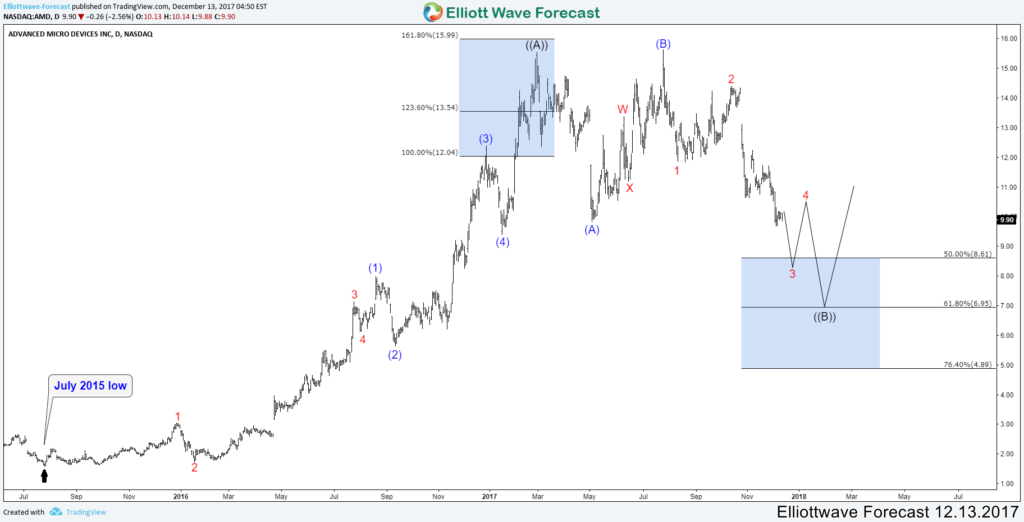
Let’s take a look at the Elliott Wave Technical chart of AMD to understand the current situation for the stock :
AMD Daily Chart 12.13.2017
AMD did an impulsive 5 waves from July 2015 low which ended early this year at February peak $15.55. Down from there, the stock is proposed to be doing a 3 waves flat structure to correct the whole cycle and looking to extend lower toward 50% – 76.4% Fibonacci retracement area $8.61 – $4.89. From there, AMD can either resume the rally to new highs or bounce in 3 waves at least.
The flat correction is one of the common structure in the market but it’s difficult to trade it as the instrument can always extend further within the 3rd leg which make it tricky for trader to rejoin the trend. That’s why e don’t recommend trading the flat structure or at least find a clear invalidation level against the previous peak / low.
If you’re interested in getting more trading ideas in the Stock Market then take this opportunity and try our services 14 days to learn how to trade Stocks and ETFs using the 3, 7 or 11 swings sequence. You will get access to our 78 instruments updated in 4 different time frames, Live Trading & Analysis Session done by our Expert Analysts every day, 24-hour chat room support and much more.
Back

